Gasoline Genset Market Size and Share
Market Overview
| Study Period | 2021 - 2031 |
|---|---|
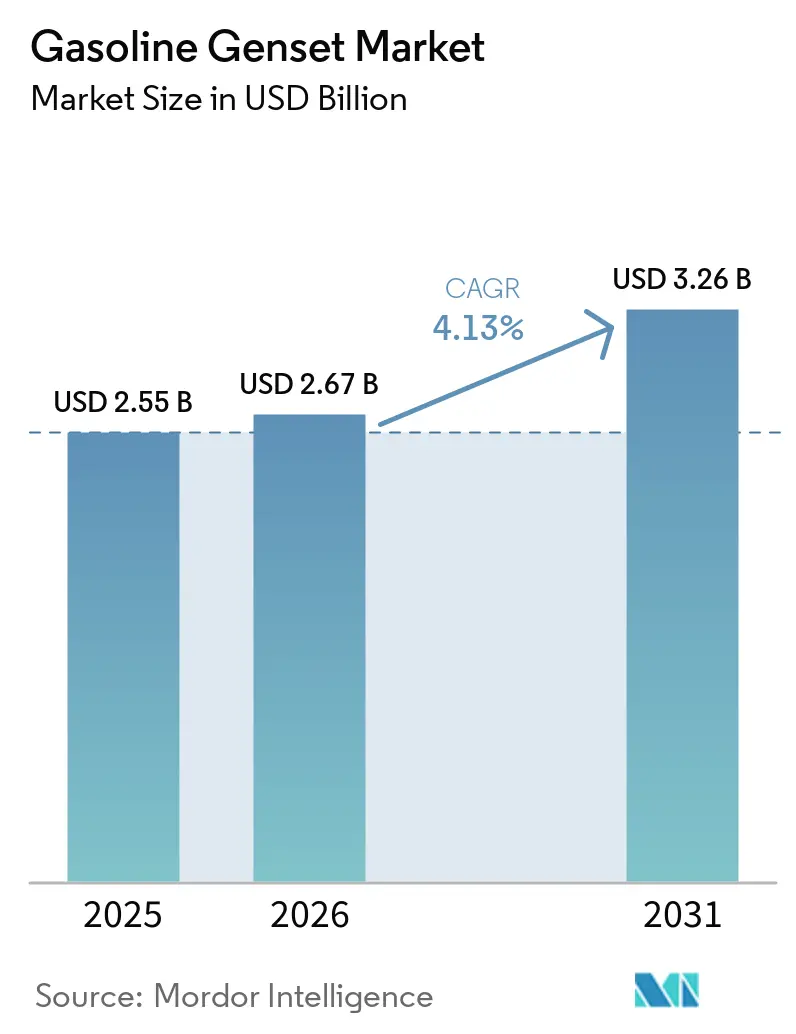
| Market Size (2026) | USD 2.67 Billion |
| Market Size (2031) | USD 3.26 Billion |
| Growth Rate (2026 - 2031) | 4.13% CAGR |
| Fastest Growing Market | Asia-Pacific |
| Largest Market | Asia-Pacific |
| Market Concentration | Medium |
Major Players *Disclaimer: Major Players sorted in no particular order Image © Mordor Intelligence. Reuse requires attribution under CC BY 4.0. | |
Gasoline Genset Market Analysis by Mordor Intelligence
The Gasoline Genset Market size is expected to increase from USD 2.55 billion in 2025 to USD 2.67 billion in 2026 and reach USD 3.26 billion by 2031, growing at a CAGR of 4.13% over 2026-2031. Residential buyers remain the largest customer group because longer and more frequent weather-related outages push households in North America and Europe to install standby units. At the same time, construction booms in India, China, and key Middle East economies sustain strong portable-set sales, while recreational-vehicle and outdoor-leisure users worldwide shift toward quiet inverter models that pair easily with sensitive electronics. Industrial users such as hyperscale data-center operators, mining firms, and remote oil and gas facilities are turning to high-capacity gasoline sets for prime or continuous duty where grid power is either unreliable or prohibitively expensive. Persistent grid under-investment more than 70% of U.S. transmission assets older than 25 years, keeps short-term demand elevated for backup generation. Intensifying regulation, especially U.S. EPA small-engine rules and EU Stage V standards, prompts leading manufacturers to launch cleaner, electronically controlled engines that meet new limits without sacrificing performance.
Key Report Takeaways
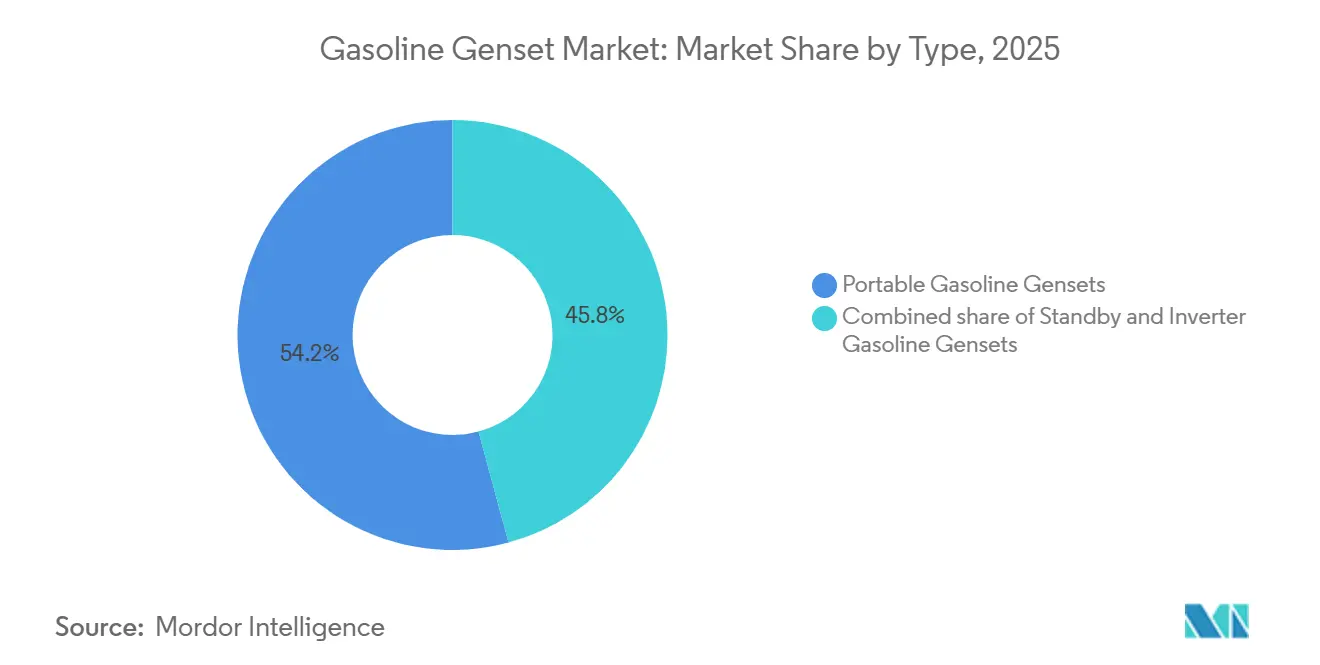
- By type, portable units led with 54.2% gasoline genset market share in 2025, while inverter sets are projected to expand at a 7.0% CAGR to 2031.
- By capacity, sub-50 kVA models commanded 73.5% of the gasoline genset market size in 2025, whereas above-330 kVA units are expected to climb at a 6.4% CAGR through 2031.
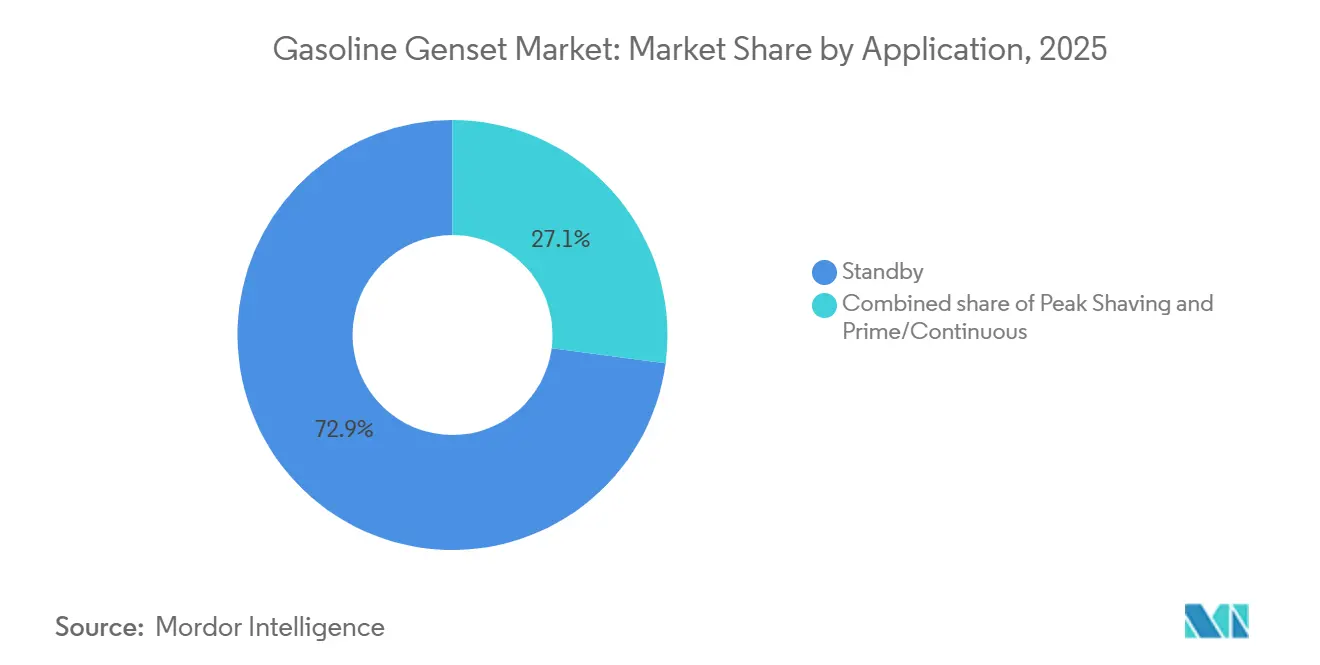
- By application, standby systems accounted for 72.9% of the gasoline genset market size in 2025, and prime-plus-continuous duty is expected to grow at 6.7% CAGR.
- By end user, residential buyers took 59.1% gasoline genset market share in 2025; commercial installations are projected to grow at 5.9% CAGR over the forecast period.
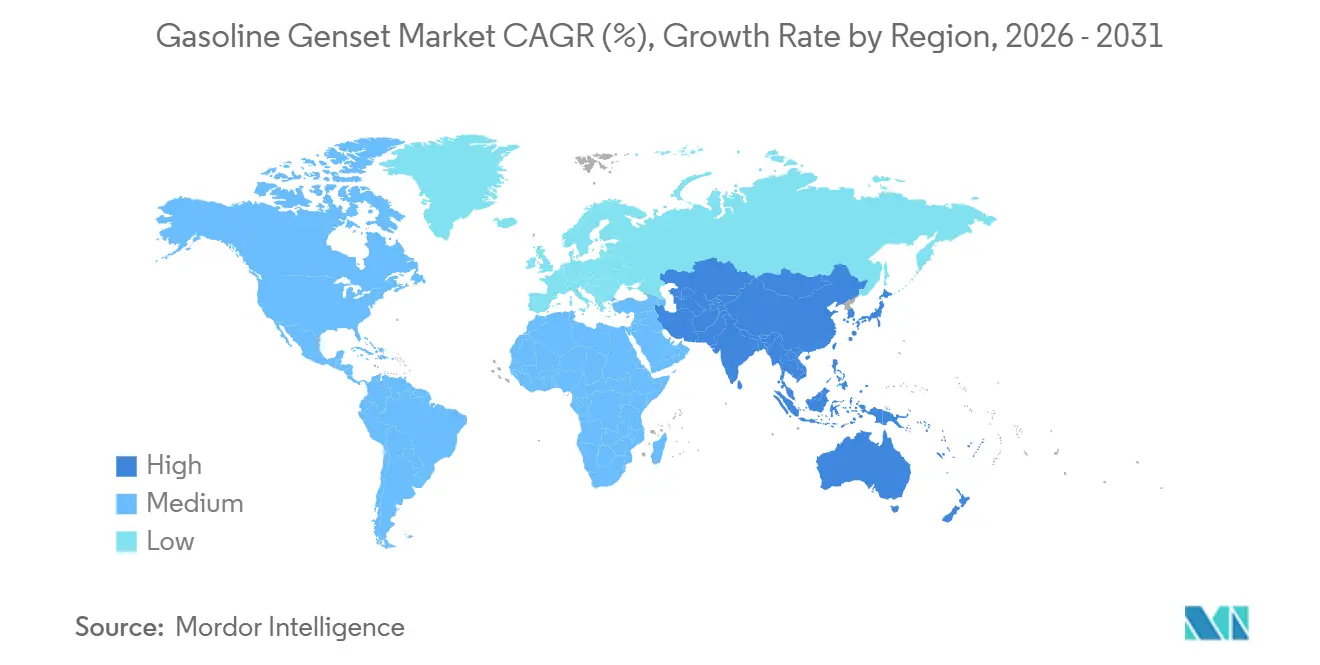
- Asia-Pacific contributed 46.4% of 2025 revenue and is expected to grow at 5.7% CAGR, driven by infrastructure programs in India, China, and ASEAN members.
Note: Market size and forecast figures in this report are generated using Mordor Intelligence’s proprietary estimation framework, updated with the latest available data and insights as of January 2026.
Global Gasoline Genset Market Trends and Insights
Drivers Impact Analysis*
| Driver | (~) % Impact on CAGR Forecast | Geographic Relevance | Impact Timeline |
|---|---|---|---|
| Aging grid infrastructure causing frequent outages | +1.2% | North America, Europe, select Asia-Pacific utilities | Medium term (2-4 years) |
| Residential backup-power demand from extreme weather events | +1.5% | Global, concentrated in North America, Australia, Southern Europe | Short term (≤ 2 years) |
| RV & outdoor-leisure boom boosting portable inverter sales | +0.6% | North America, Europe, Australia | Medium term (2-4 years) |
| Urban construction surge in emerging economies | +0.8% | Asia-Pacific (India, China, ASEAN), Middle East, Latin America | Long term (≥ 4 years) |
| IoT-enabled remote monitoring improving OPEX economics | +0.4% | Global, early adoption in North America, Europe | Long term (≥ 4 years) |
| Source: Mordor Intelligence | |||
Aging Grid Infrastructure Causing Frequent Outages
U.S. utilities report that over 70% of transmission lines and transformers have exceeded their intended service life, and this aging fleet contributed to 431 automatic transmission outages during Hurricane Helene in 2024 [1]North American Electric Reliability Corporation, “Hurricane Helene Event Analysis Report,” nerc.com. Customers in New York endured 162% more interruption hours in 2024 than in 2023, forcing many homeowners and small businesses to purchase standby gasoline sets for guaranteed resilience [2]New York State Department of Public Service, “Electric Reliability Performance Report 2024,” dps.ny.gov. Europe shows a similar pattern, with 50-year-old wooden distribution poles still in place across several national networks, pushing demand for backup power during scheduled maintenance windows. Although utilities are installing reclosers, sectionalizers, and advanced metering, grid upgrades occur over multi-year cycles, leaving a near-term window where gasoline genset market demand remains elevated. Manufacturers are capitalizing by promoting remote-monitoring packages that alert owners to outages and automate generator starts, ensuring seamless operation during grid failures.
Residential Backup-Power Demand from Extreme Weather Events
The U.S. Energy Information Administration recorded more than 10 outage hours per utility customer in 2024, the highest level in a decade, with 80% of those hours caused by major storms. Hurricanes Helene and Milton left 4.7 million customers without electricity, while wildfire-driven public-safety shutoffs in California expanded dramatically, encouraging households to install standby sets pre-emptively. NOAA forecasts an above-average Atlantic hurricane season in 2026, further intensifying homeowner appetite for robust backup systems [3]National Oceanic and Atmospheric Administration, “Atlantic Hurricane Outlook 2026,” noaa.gov. Briggs & Stratton’s 26-kW PowerProtect generator offers 65.6 kVA of motor-starting capacity and a quick weekly self-test that reduces fuel use and noise, appealing to residents in quiet suburban areas. The gasoline genset market gains a tailwind as households seek turnkey solutions that ensure refrigeration, HVAC, and critical electronics remain operational during multiday blackouts.
RV & Outdoor-Leisure Boom Boosting Portable Inverter Sales
Post-pandemic lifestyle shifts have lifted U.S. recreational-vehicle registrations to record highs, with inverter generators becoming the preferred off-grid energy source thanks to clean sine-wave output and whisper-quiet operation [4]Recreational Vehicle Industry Association, “2025 RV Ownership Report,” rvia.org. Honda’s new iGX400 and iGX430 engines feature smart fuel injection that eliminates carburetor varnish issues, enabling effortless starts even after long winter storage. These engines’ SAE J1939 capability allows RV owners to monitor generator health on dashboard displays, encouraging preventive maintenance. Parallel-ready inverter models let campers link two smaller units to match high-demand loads without lugging a heavy frame generator. As outdoor recreation spending remains resilient, the gasoline genset market in the inverter subset benefits from both replacement purchases and first-time buyers chasing quiet comfort at campsites and tailgate events.
Urban Construction Surge in Emerging Economies
India’s National Infrastructure Pipeline and China’s Belt and Road‐linked projects keep large urban job sites humming, yet grid connections often lag project timelines. Cummins India alone shipped more than 25,000 gasoline and diesel gensets in fiscal 2024-25, supplying tower cranes, concrete pumps, and lighting systems on high-rise projects. ASEAN governments are funding mass-transit corridors and industrial parks that require months of on-site generation before permanent substations arrive. Portable gasoline units remain the go-to for lower-duty loads such as hand tools and security cabins because they are lighter and cheaper than diesel equivalents. OEMs differentiate through local-emission compliance CPCB IV+ norms in India, for example, mandate advanced aftertreatment even on small sets, prompting manufacturers to revise engine calibrations and introduce retrofit kits to help rental fleets remain compliant. The sustained construction pipeline secures a long-term growth channel for the gasoline genset market.
Restraints Impact Analysis*
| Restraint | (~) % Impact on CAGR Forecast | Geographic Relevance | Impact Timeline |
|---|---|---|---|
| Stricter emission norms for small spark-ignition engines | -0.8% | Global, particularly North America (EPA), Europe (EU Stage V), India (CPCB IV+) | Medium term (2-4 years) |
| Rising uptake of solar-plus-storage home systems | -0.6% | North America, Europe, Australia | Short term (≤ 2 years) |
| Volatile copper & steel prices inflating production costs | -0.3% | Global | Short term (≤ 2 years) |
| Source: Mordor Intelligence | |||
Stricter Emission Norms for Small Spark-Ignition Engines
The U.S. EPA’s Phase 3 rules impose HC+NOx limits as low as 8 g/kWh for non-handheld engines, while Europe’s Stage V adds particulate-number counting and in-service conformity audits. Manufacturers answer with fuel injection, catalytic mufflers, and evaporative canisters, raising bill-of-materials costs and forcing design compromises on weight and enclosure size. India’s CPCB IV+ regulation came into force in July 2024 and already covers engines up to 800 kW, obliging OEMs to certify both gasoline and diesel models and to offer retrofit aftertreatment for existing fleets. Compliance testing and paperwork stretch engineering budgets and lengthen product-launch cycles, marginally dampening gasoline genset market growth until learning curves and economies of scale bring costs back down.
Rising Uptake of Solar-Plus-Storage Home Systems
Homeowners in California added batteries to more than 50% of new rooftop solar arrays in 2024, triple the 2023 attachment rate, seeking silent, emissions-free backup during public-safety shutoffs. Lithium-iron-phosphate chemistry costs dropped another 13% during 2025, narrowing the capital-cost gap with small standby generators. Honda has already partnered with OMC Power in India to lease mobile battery packs for rural microgrids, a sign that OEMs are hedging against substitution risk. Batteries’ chief limitation is finite stored energy, which means gasoline sets still dominate multi-day outages and high-wattage motor starts. Nevertheless, rising storage adoption trims the gasoline genset market’s ceiling in well-electrified, high-sun regions.
*Our forecasts treat driver/restraint impacts as directional, not additive. The impact forecasts reflect baseline growth, mix effects, and variable interactions.
Segment Analysis
By Type: Inverter Technology Gains Traction
Portable units dominated the gasoline genset market size with a 54.2% revenue share in 2025, confirming their go-anywhere appeal for households, contractors, and outdoor enthusiasts. Inverter models, however, are forecast to climb at a 7.0% CAGR to 2031 because smart fuel injection and variable-speed operation slash noise and fuel burn. Honda’s iGX400 and iGX430 demonstrate how electronic control, SAE J1939 connectivity, and choke-free starts attack customer pain points in seasonal-use scenarios. Standby sets benefit from rising grid outages, yet face silent competition from solar-plus-storage. Briggs & Stratton’s 26-kW PowerProtect, certified for non-emergency cycles, bridges this gap by letting owners earn utility demand-response revenue. The gasoline genset market, therefore, tilts gradually toward inverters and advanced standby platforms that combine clean output with digital controls.
Traditional open-frame portables remain price leaders for light construction and do-it-yourself backup, especially in emerging markets. Nevertheless, country-level noise ordinances and stricter engine standards push buyers in premium segments toward quieter, cleaner inverter sets. OEMs are broadening their catalogs with parallel-ready 2-3 kW models that can be hand-carried yet linked for higher draws, providing a modular alternative to 5-7 kW open-frame designs. Retail channels highlight fuel-savings calculators and decibel comparisons to convert legacy-generator owners, supporting sustained inverter share gains inside the gasoline genset market.


By Capacity: Large Units Serve Industrial Expansion
Sub-50 kVA machines captured 73.5% gasoline genset market share in 2025, serving residential backup, kiosks, and light construction. Demand in this size class aligns directly with household outage trends and small-business growth. Conversely, units above 330 kVA are projected to grow at a 6.4% CAGR thanks to hyperscale data-center builds, utility peaking projects, and mining camps. Cummins’ new QSK50- and QSK78-powered Centum Series sets exemplify the high-power push by emphasizing density and reliability for mission-critical workloads.
Middle-capacity gensets, ranging from 50 to 330 kVA, are consistently utilized in applications such as hotels, mid-rise office buildings, and rental fleets. However, as industrial operations consolidate into fewer, larger facilities, such as AI chip manufacturing plants and giga-factories, demand for gensets above 330 kVA is increasing. In response, original equipment manufacturers (OEMs) are introducing modular paralleling panels and on-board diagnostics to streamline multi-megawatt installations. At the same time, the sub-50 kVA segment is experiencing gradual competition from rooftop solar systems combined with batteries for essential-load circuits. Despite this, the portability and lower upfront costs of these smaller units continue to attract many buyers. Consequently, the gasoline genset market is diverging: high-horsepower units are targeting growth in energy-intensive industries, while smaller units focus on maintaining their extensive installed base.
By Application: Prime Power Gains in Off-Grid Markets
Standby duty accounted for 72.9% of 2025 revenue, underlining generators’ classic role as emergency insurance. Yet prime-and-continuous sets are projected to rise 6.7% per year until 2031 as data centers, mines, and remote construction sites require baseload generation. Atlas Energy Solutions’ agreement with Caterpillar for 1.4 GW of natural-gas sets to be delivered 2027-2029 shows the scale of forthcoming prime-power deployments.
Peak-shaving remains small but gains policy momentum where utilities offer rich demand-response credits. Modern controllers let standby owners run generators during tariff spikes without violating emissions rules, provided equipment meets non-emergency certification. Prime-power growth also emerges in developing regions where grid expansion lags economic development. The gasoline genset market, therefore, evolves from pure emergency focus toward hybrid duty cycles combining standby, prime, and distributed-energy roles.
By End User: Commercial Segment Accelerates
Homeowners represented 59.1% of sales in 2025, yet face growing competition from battery storage, making commercial customers the faster-growing group at a 5.9% CAGR to 2031. Data-center operators prize 100% uptime, and many deploy redundant N+1 gasoline-fueled sets alongside diesel fleets for fuel diversification. Cummins’ distribution arm booked USD 1.09 billion in North American generator sales in Q1 2025, largely into commercial channels.
Hospitals, hotels, and large retailers likewise broaden procurement in response to outage risks and rising electricity prices. Smaller enterprises adopt turnkey 40-100 kW systems that combine automatic transfer switches and cloud monitoring, trimming maintenance overhead. Residential growth persists where natural gas lines are widespread, and property values support whole-home systems, but the discretionary nature and growing solar incentives temper momentum. The gasoline genset market’s center of gravity thus shifts steadily toward professionally managed commercial fleets.
Geography Analysis
Asia-Pacific led the gasoline genset market with 46.4% revenue in 2025 and is forecast at a brisk 5.7% CAGR to 2031. India tightened small-engine emissions with CPCB IV+ in 2024, yet Cummins India still shipped over 23,000 compliant units and expanded its GOEM dealer roster to 127 outlets, signaling strong underlying demand. China’s infrastructure push and ASEAN electrification projects keep portable and rental fleets busy, while Japan and South Korea favor inverter units to meet stringent noise and fuel-efficiency criteria. Rapid data-center construction in Singapore and Indonesia also lifts orders for high-capacity standby sets.
North America remains the bellwether for standby and inverter purchases because wildfire-driven shutoffs and severe storms lengthen outage durations. One Colorado contractor saw inquiries soar from 12 per year to seven per week once utilities began preventive shutoffs in 2024. Generac opened a USD 35 million, 350,000-square-foot facility in Beaver Dam, Wisconsin, in 2025 and bought a Sussex plant for USD 20 million to meet climbing commercial-industrial demand. Canada’s remote mining and pipeline sectors, plus Mexico’s construction boom, round out regional growth.
Europe’s gasoline genset market grapples with EU Stage V rules that inflate diesel compliance costs, indirectly benefiting gasoline models in light-duty niches. Germany and the Nordics embrace hybrid battery-diesel gensets to trim emissions on job sites, yet southern nations with older building stock still rely on conventional portables during seasonal heat waves. Atlas Copco’s QHS Integrated Hybrid launch in March 2026 claims up to 80% CO2 savings, showing European OEMs’ pivot to low-carbon solutions. Meanwhile, Middle East megaprojects like Saudi giga-cities and UAE data hubs drive multi-megawatt orders for standby and prime sets, while South Africa’s rolling blackouts fuel residential and C&I uptake across sub-Saharan Africa. Latin America contributes via Brazilian construction and Andean mining, though currency volatility occasionally slows imports.

Competitive Landscape
The Gasoline Genset Market is moderately concentrated. Generac, Cummins, Honda, Yamaha, Kohler, and Briggs & Stratton anchor the top tier, combining global distribution, robust warranties, and deep service networks. Generac’s commercial-industrial backlog doubled to USD 300 million by late 2025, driven heavily by data-center builds, and management targets a further doubling of C&I sales within five years. Cummins’ Power Systems posted USD 1.7 billion in Q4 2024 sales, up 22% year on year, and rolled out four Centum Series gensets optimized for high density and low emissions.
Investment in capacity is accelerating: Generac’s Beaver Dam plant will employ up to 320 staff by end-2026, while Cummins plans USD 200 million in upgrades across U.S., U.K., and India sites to boost power-generation output. Innovation centers on hybridization, telematics, and alternative fuels. Atlas Copco’s purchase of New Zealand-based Generator Rental Services extends specialty-rental reach into Oceania and complements its new battery-integrated QHS line. Honda’s stake in OMC Power signals diversification into modular battery leasing to hedge against pure-combustion decline. Smaller regional assemblers face pricing pressure from input-cost swings and tightening engine rules but survive by targeting niche voltages, low-altitude calibrations, or rapid after-sales response.
Telematics vendors OmniMetrix and Power Telematics partner with OEMs to embed remote diagnostics, opening a lucrative aftermarket for subscription data services. Fleet owners benefit from lower technician visits and faster fault isolation, raising the switching costs for end users contemplating rival brands. Overall, strategic mergers, plant expansions, and digital service layers define competition, keeping barriers to entry high for newcomers in the gasoline genset market.
Gasoline Genset Industry Leaders
Honda Motor Co., Ltd.
Generac Holdings Inc.
Briggs & Stratton Corporation
Yamaha Motor Co., Ltd.
Rehlko
- *Disclaimer: Major Players sorted in no particular order

Recent Industry Developments
- January 2026: Harbor Freight introduced four new gasoline-powered generators as part of its Predator lineup, representing a notable advancement in the gasoline generator market. The new models included a 5,000 W and a 10,000 W portable generator, with the 10,000 W model featuring a remote start. Both generators incorporated the CO SECURE® carbon-monoxide shutdown technology.
- January 2025: Pramac, a Generac subsidiary, purchased a majority interest in India’s Captiva Energy Solutions to expand local generator manufacturing.
- November 2024: Cummins highlighted a 24% year-over-year rise in power generation revenues during Q3 2024, reinforcing its Destination Zero strategy.
- October 2024: Generac lifted its 2024 guidance after residential product sales climbed 28% following intense hurricane activity.


Global Gasoline Genset Market Report Scope
A gasoline genset, or gasoline genset, is a power generation unit that can be either portable or stationary. It operates using gasoline (petrol) as fuel to generate electricity. The primary components include an internal combustion engine, which runs on gasoline, and an alternator that converts the mechanical energy from the engine into electrical energy.
The gasoline genset market is segmented by type, capacity, application, end-user, and geography. By type, the market is segmented into portable, standby, and inverter gensets. By capacity, the market is segmented into below 50 kVA, 50 to 330 kVA, and above 330 kVA. By application, the market is segmented into standby, peak shaving, and prime/continuous power. By end-user, the market is segmented into residential, commercial, and industrial sectors. By geography, the market is segmented into North America, Europe, Asia-Pacific, South America, and the Middle East and Africa. The report also covers the market sizes and forecasts for the gasoline genset market across major countries in these regions. For each segment, the market sizing and forecasts have been done on the basis of value (USD).
| Portable Gasoline Gensets |
| Standby Gasoline Gensets |
| Inverter Gasoline Gensets |
| Below 50 kVA |
| 50 to 330 kVA |
| Above 330 kVA |
| Standby |
| Peak Shaving |
| Prime/Continuous |
| Residential |
| Commercial |
| Industrial |
| North America | United States |
| Canada | |
| Mexico | |
| Europe | Germany |
| United Kingdom | |
| France | |
| Italy | |
| NORDIC Countries | |
| Russia | |
| Rest of Europe | |
| Asia Pacific | China |
| India | |
| Japan | |
| South Korea | |
| ASEAN Countries | |
| Rest of Asia-Pacific | |
| South America | Brazil |
| Argentina | |
| Middle East and Africa | Saudi Arabia |
| United Arab Emirates | |
| South Africa | |
| Egypt | |
| Rest of Middle East and Africa |
| By Type | Portable Gasoline Gensets | |
| Standby Gasoline Gensets | ||
| Inverter Gasoline Gensets | ||
| By Capacity | Below 50 kVA | |
| 50 to 330 kVA | ||
| Above 330 kVA | ||
| By Application | Standby | |
| Peak Shaving | ||
| Prime/Continuous | ||
| By End-user | Residential | |
| Commercial | ||
| Industrial | ||
| By Geography | North America | United States |
| Canada | ||
| Mexico | ||
| Europe | Germany | |
| United Kingdom | ||
| France | ||
| Italy | ||
| NORDIC Countries | ||
| Russia | ||
| Rest of Europe | ||
| Asia Pacific | China | |
| India | ||
| Japan | ||
| South Korea | ||
| ASEAN Countries | ||
| Rest of Asia-Pacific | ||
| South America | Brazil | |
| Argentina | ||
| Middle East and Africa | Saudi Arabia | |
| United Arab Emirates | ||
| South Africa | ||
| Egypt | ||
| Rest of Middle East and Africa | ||


Key Questions Answered in the Report
How large is the global gasoline genset space today and how fast is it expanding?
It is projected at USD 2.67 billion in 2026 and on course to reach USD 3.26 billion by 2031, reflecting a 4.13% CAGR over 2026-2031.
Which capacity class is seeing the quickest uptake?
Units above 330 kVA show the fastest expansion, advancing at a 6.4% CAGR through 2031 as data centers, mines, and large infrastructure sites need high-output backup or prime power.
Why are inverter models gaining ground over conventional portables?
Variable-speed electronics slash fuel use and noise, while smart-injection engines offer clean power for sensitive devices, pushing inverter sales up at a 7.0% CAGR to 2031.
What factors are driving residential purchases in North America?
More frequent weather-related outages averaging over 10 hours per customer in 2024 are nudging homeowners toward standby systems for reliable whole-home backup.
How are tightening emission standards affecting suppliers?
U.S. EPA Phase 3, EU Stage V, and India’s CPCB IV+ rules require catalytic mufflers, fuel injection, and evaporative controls, raising material costs but spurring launches of cleaner, electronically controlled engines.
Which region contributes the most revenue and why?
Asia-Pacific accounts for 46.4% of global sales thanks to infrastructure buildout and electrification gaps in India, China, and ASEAN economies, supported by strong construction and data-center pipelines.
Page last updated on:


