Gas Engine Market Size and Share
Market Overview
| Study Period | 2021 - 2031 |
|---|---|
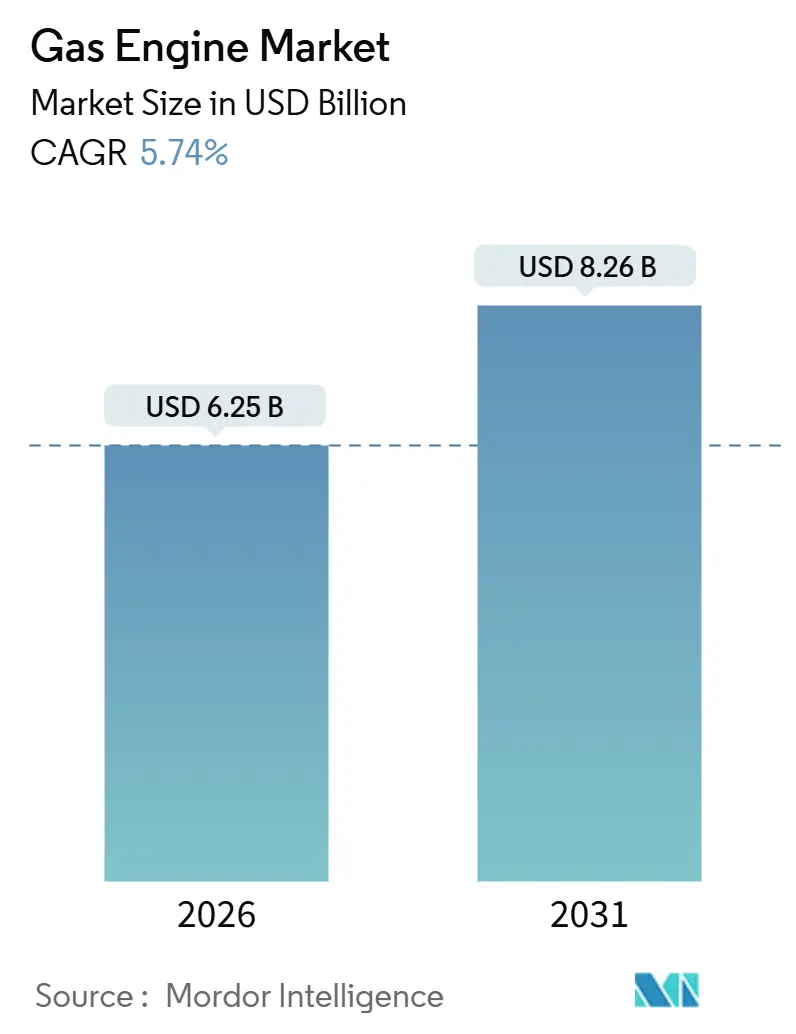
| Market Size (2026) | USD 6.25 Billion |
| Market Size (2031) | USD 8.26 Billion |
| Growth Rate (2026 - 2031) | 5.74% CAGR |
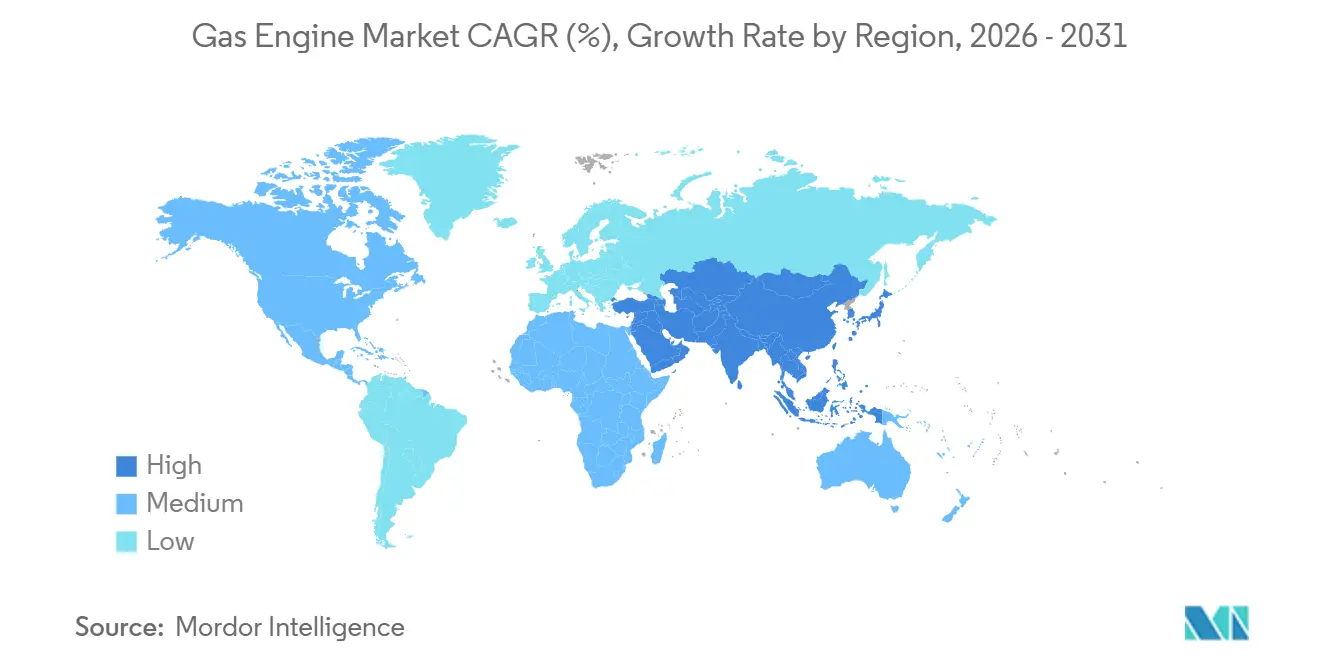
| Fastest Growing Market | Asia Pacific |
| Largest Market | Asia Pacific |
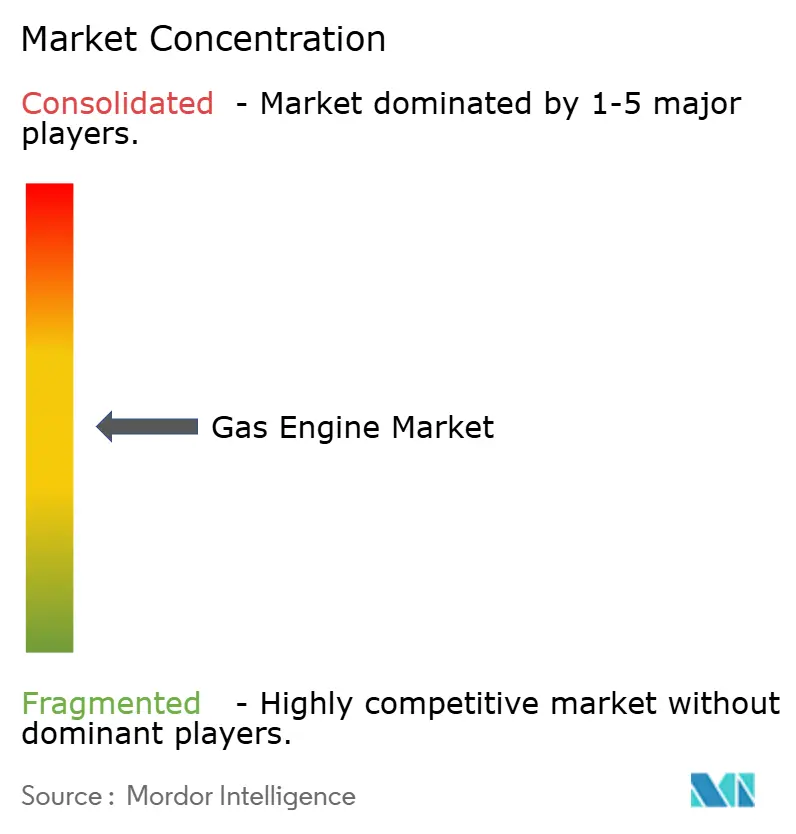
| Market Concentration | Medium |
Major Players *Disclaimer: Major Players sorted in no particular order Image © Mordor Intelligence. Reuse requires attribution under CC BY 4.0. | |
Gas Engine Market Analysis by Mordor Intelligence
The Gas Engine Market size is estimated at USD 6.25 billion in 2026, and is expected to reach USD 8.26 billion by 2031, at a CAGR of 5.74% during the forecast period (2026-2031).
Market growth is propelled by faster coal-to-gas switching in Asia-Pacific, tightening global NOx and SOx regulations that favor lean-burn reciprocating technology, and policy-supported combined heat and power (CHP) programs that monetize waste heat as well as electricity. Natural gas maintained the dominant fuel share in 2025, yet hydrogen-ready retrofits and dual-fuel flexibility are gathering speed as utilities and industrial operators align with 2030-plus decarbonization mandates. OEM product roadmaps now emphasize rapid-start modules above 5 MW that ramp within 10 minutes, a performance edge over battery storage for multi-hour peaking duty. At the same time, predictive-maintenance platforms are trimming unplanned downtime 20-30%, cutting lifecycle OPEX, and sustaining fleet utilization.
Key Report Takeaways
- By fuel type, natural gas retained 61.8% of the gas engine market share in 2025, while hydrogen and hydrogen blends posted the fastest growth at 8.1% CAGR through 2031.
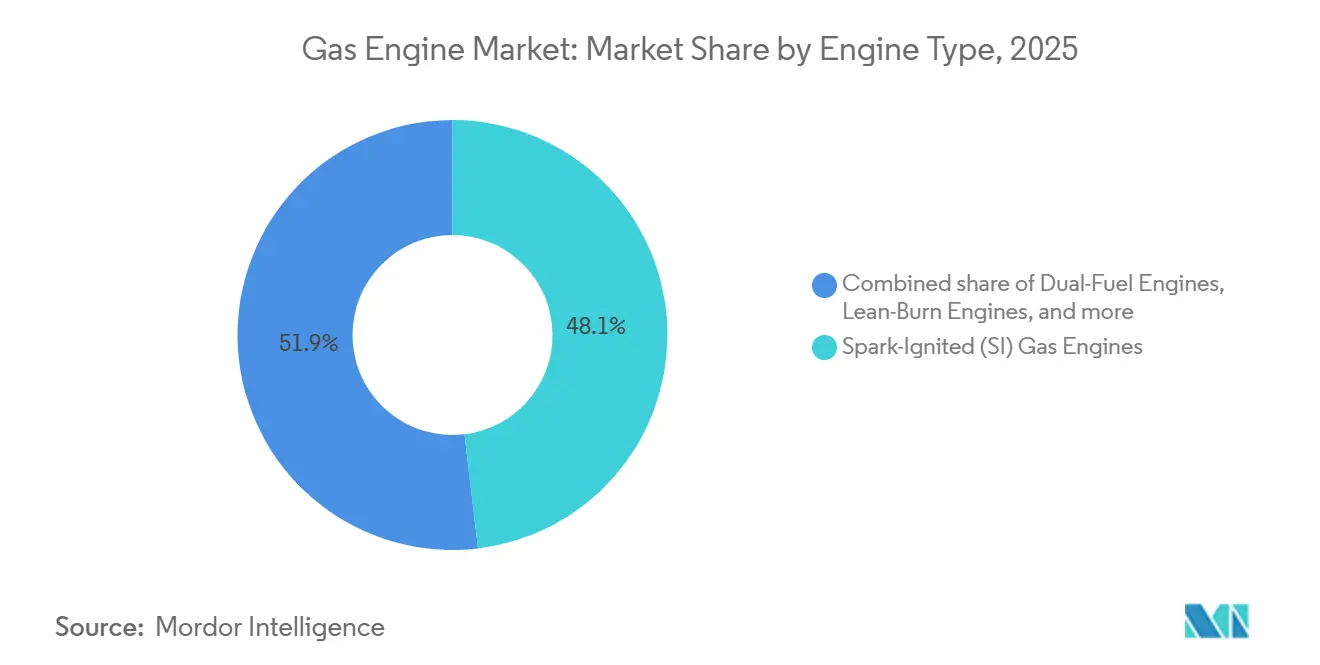
- By engine type, spark-ignited units led with 48.1% share in 2025; dual-fuel designs recorded the highest projected CAGR at 7.9% for 2026-2031.
- By power output, the 2-5 MW band captured 37.9% share of the gas engine market size in 2025, whereas above-5 MW units are forecast to expand at 7.5% CAGR.
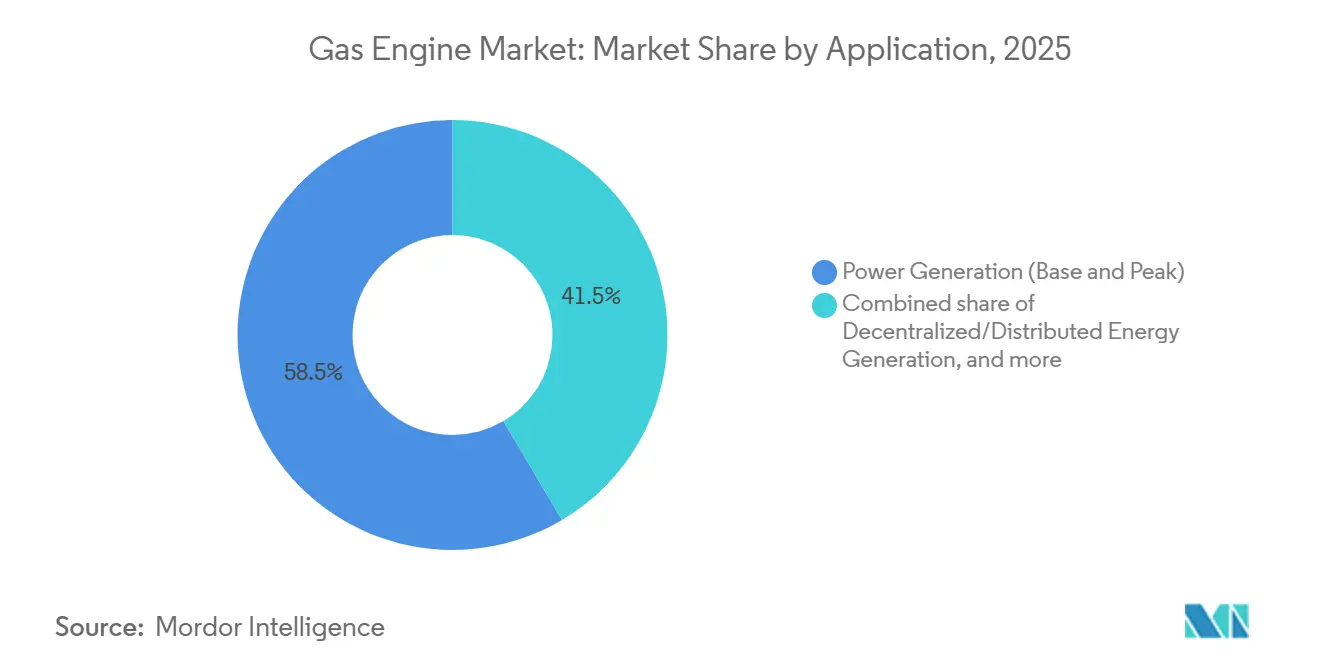
- By application, power generation commanded 58.5% of revenue in 2025; decentralized and distributed generation is projected to rise at a 7.2% CAGR through 2031.
- By end-user, utilities held a 43.7% share in 2025, while the industrial segment is advancing at a 6.8% CAGR on captive-power economics.
- By geography, Asia-Pacific accounted for 39.6% of global revenue in 2025 and is projected to grow at a 7% CAGR through 2031.
- Caterpillar, Cummins, INNIO, Wärtsilä, and Rolls-Royce MTU collectively controlled 55% of installed gas engine capacity in 2025.
Note: Market size and forecast figures in this report are generated using Mordor Intelligence’s proprietary estimation framework, updated with the latest available data and insights as of January 2026.
Global Gas Engine Market Trends and Insights
Drivers Impact Analysis*
| Driver | (~) % Impact on CAGR Forecast | Geographic Relevance | Impact Timeline |
|---|---|---|---|
| Surplus shale & LNG availability keeps fuel prices competitive | 1.20% | North America, Asia-Pacific | Medium term (2-4 years) |
| Stricter global NOx / SOx emission caps versus diesel gensets | 1.50% | Global | Short term (≤ 2 years) |
| Distributed CHP policies accelerating utility & industrial demand | 1.00% | North America, Europe, Japan | Medium term (2-4 years) |
| Hydrogen-ready engine retrofits for deep decarbonization | 0.90% | Europe, North America, Australia | Long term (≥ 4 years) |
| Micro-grid resilience projects for data-intensive facilities | 0.70% | Global | Short term (≤ 2 years) |
| AI-enabled predictive maintenance lowering lifecycle OPEX | 0.50% | Global | Medium term (2-4 years) |
| Source: Mordor Intelligence | |||
Surplus Shale & LNG Availability Keeps Fuel Prices Competitive
Delivered pipeline gas averaged below USD 4/MMBtu in U.S. industrial hubs during 2025, a 30-40% discount to diesel on an energy-equivalent basis, steering CHP projects toward gas engines for petrochemical and food-processing complexes.[2]U.S. Energy Information Administration, “Natural Gas Weekly Update,” eia.gov Long-term LNG contracts at USD 10-12/MMBtu signed by India and Thailand in 2024 further stabilized input costs for Asian buyers and de-risked multi-MW installations.[3]Bloomberg, “Asian LNG Buyers Lock Long-Term Contracts,” bloomberg.com Global LNG trade is expected to grow 4% annually to 2030, ensuring adequate supply, although geopolitical pipeline outages can generate short-run price spikes that postpone capacity additions.
Stricter Global NOx and SOx Emission Caps Versus Diesel Gensets
The EPA’s Tier 4 standards cap NOx at 0.67 g/bhp-hr, a threshold that diesel units meet only with expensive after-treatment. EU Stage V rules impose similar limits plus particulate controls, pushing operators toward lean-burn gas engines. China’s GB 20891-2024 standard tightens NOx to 1.5 g/kWh for engines above 560 kW, accelerating replacement of diesel backup sets in Hebei and Shandong. Compliance costs for diesel retrofits can exceed USD 100,000 per MW, whereas new gas engines meet the limits with lower capital outlay.
Distributed CHP Policies Accelerating Utility and Industrial Demand
The U.S. Investment Tax Credit grants a 30% incentive for CHP systems achieving 60% efficiency, slashing payback periods to 4-6 years. Germany’s KWK-G subsidy provides EUR 8 per MWh for plants below 2 MW, spurring installations at hospitals and universities. Japan’s FIT of JPY 13 per kWh for sub-2 MW gas-fired CHP has driven uptake in commercial buildings. Cold-climate regions reap additional benefits where year-round heat demand lifts overall efficiency.
Hydrogen-Ready Engine Retrofits for Deep Decarbonization of Assets
Wärtsilä and INNIO have commercial engines able to burn 25% hydrogen by volume today, with 100% hydrogen variants slated for deployment after 2027. Cummins’ 15-liter platform accepts 20% blends for transit and refuse fleets. Retrofitting an existing gas engine for hydrogen capability costs USD 50,000-100,000 per MW, a fraction of the USD 1.5-2 million per MW needed for fuel-cell systems. EU mandates requiring 42% renewable hydrogen in industry by 2030 intensify demand for hydrogen-ready units.
Restraints Impact Analysis*
| Restraint | (~) % Impact on CAGR Forecast | Geographic Relevance | Impact Timeline |
|---|---|---|---|
| Falling LCOE of renewables-plus-storage undermines baseload gas | -1.8% | High-solar regions | Medium term (2-4 years) |
| Volatile global natural-gas pricing and supply-chain disruptions | -1.2% | Europe, Asia-Pacific | Short term (≤ 2 years) |
| Prospective methane-slip taxation inflates true carbon cost | -0.6% | North America, Europe | Long term (≥ 4 years) |
| Rise of green-ammonia and methanol engines in marine segment | -0.4% | Global shipping lanes | Long term (≥ 4 years) |
| Source: Mordor Intelligence | |||
Falling LCOE of Renewables-Plus-Storage Undermines Baseload Gas
Solar-plus-battery projects achieved levelized costs below USD 50 per MWh in Texas and Australia during 2025, undercutting the USD 60-70 per MWh economics of gas baseload plants. NextEra canceled a 400 MW gas project in Florida, redirecting funds to a 600 MW solar-plus-battery site. Battery costs fell to USD 150 per kWh in 2024, enabling four-hour systems that compete with gas peakers in high-renewable grids. Gas engines retain an edge in seasonal storage or low-sun regions, but economics hinge on fuel prices and carbon policies.
Volatile Global Natural-Gas Pricing and Supply-Chain Disruptions
European Title Transfer Facility prices swung from EUR 110 per MWh in January 2025 to EUR 35 per MWh by March after LNG cargoes saturated the market. A German consortium postponed a 50 MW CHP project when lenders priced hedges that drove financing costs up 20%. Asian spot LNG fluctuated between USD 8 and USD 18 per MMBtu in 2025, deterring merchant projects. Supply-chain bottlenecks extended lead times to 18 months for turbochargers and control modules, forcing operators to raise inventory buffers.
*Our forecasts treat driver/restraint impacts as directional, not additive. The impact forecasts reflect baseline growth, mix effects, and variable interactions.
Segment Analysis
By Fuel Type: Hydrogen Blends Reshape Decarbonization Roadmaps
Natural gas contributed 61.8% of 2025 revenue, yet hydrogen and hydrogen blends are projected to expand at an 8.1% CAGR, steering the gas engine market toward lower-carbon combustion portfolios.[4]Reuters, “Hydrogen-Ready Gas Engines Gain Traction,” reuters.com The hydrogen-ready segment benefits from Germany’s 12 GW tender pipeline, guaranteeing future offtake for dual-fuel assets.
Infrastructure limitations cap blend ratios at 5-20% in legacy pipelines, but on-site electrolysis and dedicated hydrogen networks are emerging workarounds. Special gases such as biogas and landfill gas occupy resilient niches where fuel is a waste by-product, sustaining stable margins despite modest volume growth.
By Engine Type: Dual-Fuel Flexibility Commands Premium in Volatile Markets
Spark-ignited units held 48.1% gas engine market share in 2025, favored for stationary CHP where strict emissions codes apply. Dual-fuel designs are gaining share the fastest, advancing at 7.9% CAGR as marine and mining operators seek fuel-switch agility during supply shocks.
MAN Energy Solutions’ 2024 order from Maersk for 24 methanol-ready engines exemplifies commercial appetite for cross-fuel configurations. High-pressure direct-injection systems also expand the addressable heavy-duty trucking segment, though capital costs remain a hurdle for budget-sensitive buyers.


By Power Output: Utility-Scale Units Above 5 MW Lead Growth
The 2-5 MW class represented 37.9% of the gas engine market size in 2025, dominating district-heating and mid-industrial loads. However, above-5 MW modules will post 7.5% CAGR as utilities procure peaking fleets that ramp in under 10 minutes to balance high renewables penetration.
Duke Energy’s 60 MW station in North Carolina confirms the economics of multi-block installations. Smaller bands up to 800 kW face intensifying solar-plus-battery competition, pressuring margins and elongating payback periods in commercial buildings.
By Application: Distributed Energy Generation Gains Momentum
Power generation took 58.5% revenue share in 2025, yet resilience-driven distributed projects are increasing at 7.2% CAGR as data-center and pharmaceutical campuses hedge outage risk. CHP incentives and rising downtime penalties encourage on-site portfolios even when capex carries a 10-15% premium.
Industrial mechanical-drive roles, compressors, and pumps grow in step with midstream infrastructure expansion in Asia-Pacific and the Middle East. Marine and auxiliary segments maintain steady replacement demand but confront emerging green-ammonia competition.
By End-User Industry: Industrial Segment Accelerates on Captive-Power Economics
Utilities accounted for 43.7% of 2025 revenue; nonetheless, industrial users will expand at a 6.8% CAGR as cement, steel, and chemical plants internalize both electric and thermal loads. BASF’s 80 MW CHP build at Ludwigshafen underscores payback advantages where heat recovery displaces boiler fuel.
Commercial campuses in cold climates adopt sub-2 MW modules for district heating, while transit agencies continue to favor natural-gas buses for heavy-duty routes despite light-duty electrification gains.
Geography Analysis
Asia-Pacific led with 39.6% 2025 revenue and is projected to grow at a 7.0% CAGR through 2031, powered by China’s mandatory replacement of 50 GW coal-fired boilers and India’s 15 GW gas peaker program. ASEAN markets secure concessional finance from the Asian Development Bank, while Japan and South Korea leverage existing LNG chains for district-heating deployments.
Europe followed at 28% share, with growth centered on Germany’s hydrogen-ready retrofits and Nordic district-heating investments. Spain and Italy are bolstering evening-peaking fleets to integrate Mediterranean solar, commissioning fast-start reciprocating portfolios.
North America contributed roughly 22% revenue; U.S. CHP tax credits and California’s SGIP incentives sustain robust order intake for micro-grids and peaking duty. Canada’s rising carbon price accelerates diesel-to-gas displacement in oil-sands compressors, while Mexico’s CFE targets reliability gaps in Baja and Yucatán.

Regulatory Landscape
Emissions rules continue to shape gas-engine selection versus diesel, especially where permitting and criteria pollutants drive technology choices. In the United States, EPA Tier 4 NOx limits (0.67 g/bhp-hr) anchor lean-burn gas engine demand for clean, compliant operation.
In January 2026, the EPA finalized amendments to the New Source Performance Standards for stationary combustion turbines and gas turbines (40 CFR Part 60, Subpart KKKKa), tightening NOx and SO2 requirements for new, modified, or reconstructed sources and elevating compliance attention for new stationary installations. In Europe, Directive (EU) 2024/1785 (IED 2.0), which entered into force in August 2024, updates emission limits linked to Best Available Techniques and expands the scope of covered activities, increasing the importance of documented emissions performance and monitoring for engine-based CHP and onsite generation. Separately, EPA rulemaking activity in July 2026 proposed amendments to heavy-duty engine compliance, influencing OEM upgrade timing for certain engine platforms used in gas-fueled applications.
Competitive Landscape
The top five OEMs, Caterpillar, Cummins, INNIO, Wärtsilä, and Rolls-Royce MTU, held 55% installed capacity in 2025, evidencing moderate concentration. Differentiation now revolves around hydrogen-ready combustion chambers, AI-driven predictive maintenance that trims downtime 20-30%, and modular blocks scaling 800 kW to above 5 MW without bespoke balance-of-plant engineering.
Chinese challengers such as Qingdao Yuchai undercut Western peers by 20-30% on sub-2 MW capex, carving share in Southeast Asia and Africa. Niche players Bergen Engines and Tedom focus on landfill-gas and biogas projects where fuel impurities demand specialized tuning.
Patent activity highlights the innovation race: INNIO’s variable-compression-ratio cylinder head filed October 2024 optimizes mixed-hydrogen thermodynamics, while Wärtsilä advances 100% hydrogen prototypes slated for 2027 field trials.
Gas Engine Industry Leaders
Wartsila Oyj Abp
Rolls-Royce Holdings PLC
Caterpillar Inc.
Cummins Inc.
General Electric Company
- *Disclaimer: Major Players sorted in no particular order

Market Opportunities and Future Outlook
Fast-start capacity for grid balancing and behind-the-meter resilience continues to open whitespace in utility peaking and mission-critical loads. Large orders illustrate a pathway where rapid ramping, modular scaling, and service-backed availability are purchased as a package, aligning with above-5 MW modules and distributed generation growth. In 2026, Wärtsilä secured a 452 MW package for the Pecos Power Plant in Texas, including 24 Wärtsilä 1850SG engines, and disclosed a 412 MW hyperscale data center project in Ohio based on 40 Wärtsilä 34SG engines.
Hydrogen blend capability and retrofitability remain monetizable differentiators given the installed natural-gas base and policy pushes for renewable hydrogen use in industry, while OEM roadmaps already include commercial engines capable of 20-25% hydrogen by volume in certain platforms. On the utility side, continued combined-cycle buildout and LNG-to-power additions in emerging markets support complementary demand for gas power equipment ecosystems: for example, GE Vernova reported commercial operation start of the LNG-fueled Nhon Trach 3 and 4 project in Vietnam in January 2026. For gas-engine suppliers, this reinforces near-term opportunities in balancing, black-start, and onsite generation that pair with new gas infrastructure, alongside service and digital-performance offerings that reduce downtime and lifecycle OPEX for large fleets.
Recent Industry Developments
- June 2026: Wärtsilä announced a contract for 452 MW of power generation equipment and a long-term operation and maintenance agreement for the Pecos Power Plant in Texas, USA, featuring 24 Wärtsilä 1850SG reciprocating engines. The award reinforces large, multi-unit engine plants as a preferred format for flexible capacity in high-variability grids and expands OEM recurring revenue through lifecycle service scope.
- November 2025: Wärtsilä disclosed a 507 MW order in the United States for data center power, positioning engines as a reliability solution for hyperscale loads. The scale of the order signals accelerating demand from mission-critical customers that value fast-start capability and controllable onsite power alongside renewables and storage.
- August 2024: Caterpillar announced the Cat G3520 Fast Response natural-gas generator set for 50 Hz applications, designed to accept load from a cold start in 10 seconds. The launch strengthens competition in fast-response standby and peaking duty where transient performance and emissions compliance are key purchase criteria.


Research Methodology Framework and Report Scope
Market Definition and Coverage
This market covers revenues generated from gas engines used to convert gaseous fuels into mechanical power for stationary and mobile uses, where the engine itself is the core product being sold or installed. It spans key power output ranges and end-use settings across major regions.
Scope exclusions: The sizing excludes gas turbines, pure generator set packages when the engine value cannot be separated, and downstream electricity sales or fuel supply revenues.
Segmentation Overview
- By Fuel Type
- Natural Gas
- Hydrogen and Hydrogen Blends
- Special Gas
- Others
- By Engine Type
- Spark-Ignited (SI) Gas Engines
- Dual-Fuel Engines
- High-Pressure Direct Injection (HPDI) Engines
- Lean-Burn Engines
- Microturbines/Gas Turbine Engines and Others
- By Power Output
- Up to 800 kW
- 800 kW to 2 MW
- 2 MW to 5 MW
- Above 5 MW
- By Application
- Power Generation (Base and Peak)
- Decentralized/Distributed Energy Generation
- Industrial Mechanical Drive
- Transportation/Automotive Engines
- Marine and Others
- By End-User Industry
- Utilities
- Industrial
- Commercial and Residential Buildings
- Transportation/Fleet Operators
- Marine and Others
- By Geography
- North America
- United States
- Canada
- Mexico
- Europe
- Germany
- France
- United Kingdom
- Spain
- NORDIC Countries
- Russia
- Rest of Europe
- Asia-Pacific
- China
- India
- Japan
- South Korea
- ASEAN Countries
- Rest of Asia-Pacific
- South America
- Brazil
- Argentina
- Rest of South America
- Middle East and Africa
- Saudi Arabia
- United Arab Emirates
- South Africa
- Rest of Middle East and Africa
- North America
Data Sources, Market Sizing, and Validation
Desk Research
Desk work starts by building a clean view of demand and supply signals that are already public, and then mapping them to gas engine shipments and pricing logic. We mainly rely on sources such as the US Energy Information Administration for gas and power context, the International Energy Agency for distributed generation trends, the World Bank for macro indicators, and UN Comtrade for trade flows that hint at equipment movements.
To keep the market model grounded, we also review regulatory and standards material, including US EPA engine emissions rules and comparable regional bodies, plus project and capacity announcements from utility regulators and grid operators. Company filings, investor presentations, and credible trade press are used to confirm shifts in application mix and pricing direction. Where needed, paid subscriptions for company financials, patent lookups, and shipment level import-export records help cross-check the public picture. These examples are not exhaustive, and we also used other public sources for data collection, validation, and clarification.
Primary Interviews and Surveys
Primary inputs were collected through expert discussions and structured surveys across the value chain, covering OEM and component channel roles, EPC and packager viewpoints, utilities and industrial buyers, and service partners. Since this is a global market, we balanced feedback across APAC, EMEA, and the Americas so assumptions on demand triggers, lead times, and price realization could be tested and then aligned to desk indicators.
Distribution of primary research fieldwork respondents
| Company type | Respondent position | Region |
|---|---|---|
| Top tier: 32% | CXOs: 15% | APAC: 44% |
| Mid tier: 53% | Functional/Unit leaders: 33% | EMEA: 34% |
| Smaller Players: 15% | Managers: 52% | Americas: 22% |
Market-Sizing & Forecasting
Sizing is built using top-down logic where power and industrial demand signals are translated into an addressable engine demand pool, then filtered by gas availability and adoption of gas based onsite generation. We then cross-check totals with selective bottom-up approximations, including sampled supplier roll-ups by power class and application, and ASP x volume checks from channel conversations, which helps adjust totals when a single data series looks too high or too low.
Key inputs used in the model include installed base additions in distributed generation, engine power output mix (up to 800 kW, 800 kW to 2 MW, 2 MW to 5 MW, and above 5 MW), fuel type mix shifts (natural gas, special gas, and hydrogen blending where relevant), and application split between power generation, CHP or distributed energy, and industrial drive. We also track macro factors such as industrial output, gas price spreads versus diesel, and grid reliability indicators, since they affect genset substitution and backup power ordering.
For forecasting, scenario analysis is used around gas availability, emissions compliance timelines, and data center and industrial capex cycles. Those scenarios are anchored to expert consensus collected through primary work. Where bottom-up signals are incomplete, for example when regional packagers do not disclose volumes, we use trade proxies, project pipelines, and calibrated penetration assumptions, and then recheck them during interviews.
Data Validation & Update Cycle
Validation is done through triangulation across multiple independent checks, so model outputs are compared against trade flows, capacity additions, and observed pricing movements before figures are finalized. If a region shows an unusual jump, we trace it back to the specific variable driving the change, then re-verify through follow-up calls or additional desk checks.
Before sign-off, the work goes through multi-step analyst review so unit assumptions, currency conversions, and year alignment are consistent across tables. The report is refreshed annually, and interim updates are made when there are material events such as policy changes, major supply disruptions, or large project swings. Right before delivery, a final pass is completed so the numbers reflect the latest available public signals.
Mordor Intelligence's Gas Engine Market Size Compared Against Other Published Estimates
Published market sizes for gas engines can vary even when studies cover similar end uses, since the math changes with what is counted as the product, which year is treated as the base, and how pricing is carried forward into the forecast.
Packaged generator set revenues and long-term service contracts are common add-ons in some estimates, and those inclusions can shift the total more than expected. The main spread also comes from how special gas engines, hydrogen blending readiness, and power output splits are mapped to demand indicators, along with currency timing and how often assumptions are refreshed. Packaged generator set value is kept outside Mordor Intelligence's scope when the engine revenue cannot be cleanly separated, which pulls the total away from studies that count the full genset package.
Benchmark comparison
| Source | Market Size | Gaps in Research Methodology |
|---|---|---|
| Mordor Intelligence | USD 6.25 B (2026) | |
| Global Consultancy A | USD 5.29 B (2026) | Uses a different base-year setup and tends to keep the scope tighter around core engine categories, which can reduce totals when special-gas and certain mobile or marine uses are not fully captured, and when pricing updates are carried forward with fewer channel checks. |
| Industry Publisher B | USD 5.84 B (2025) | Year mismatch drives part of the gap, and the published scope description is broader on end users, which can blend adjacent equipment and project spending into the engine value, making like-for-like reconciliation harder without a clear separation rule. |
Across the three figures, the biggest drivers are year alignment and whether packaged systems or adjacent value streams are mixed into engine revenues. By keeping inputs tied to visible demand signals such as distributed capacity additions, power output mix, and fuel availability, the model stays repeatable and easier to validate during updates.


Key Questions Answered in the Report
What is the current size and CAGR forecast for the global gas engine market?
The gas engine market size was USD 6.25 billion in 2026 and is projected to reach USD 8.26 billion by 2031, growing at a 5.74% CAGR.
Which fuel segment is growing fastest in gas-fired reciprocating engines?
Hydrogen and hydrogen blends lead growth, expanding at an 8.1% CAGR as operators retrofit assets for low-carbon compliance.
Why are above-5 MW gas engines gaining popularity with utilities?
Utilities value their ability to ramp to full load within 10 minutes, providing flexible peaking support for high renewable grids while keeping capex competitive.
How are data-center operators using gas engines for resilience?
Major campuses pair multi-MW gas engines with batteries and solar to secure 99.999% uptime against grid disturbances, avoiding outage penalties that can top USD 10 million per event.
What technological features differentiate leading OEMs today?
Hydrogen-ready combustion chambers, AI-driven predictive maintenance that cuts downtime 20-30%, and modular block design enabling 800 kW-plus scalability are key differentiators.
Page last updated on:


