Market Overview
| Study Period | 2021 - 2031 |
|---|---|
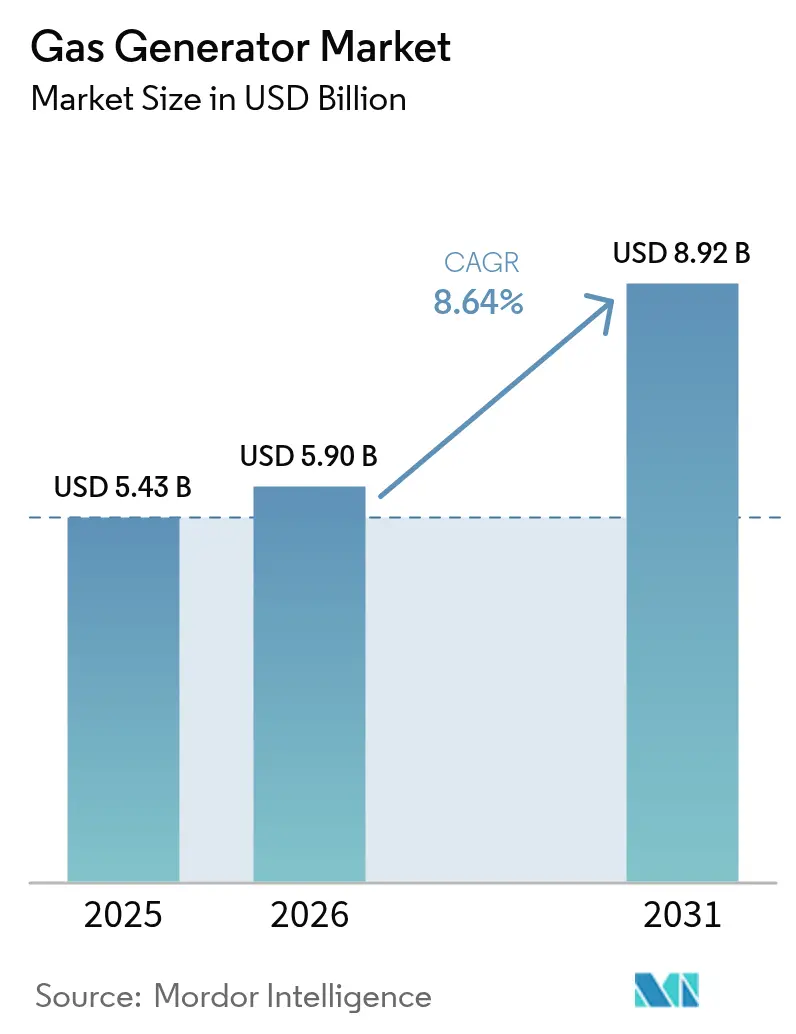
| Market Size (2026) | USD 5.9 Billion |
| Market Size (2031) | USD 8.92 Billion |
| Growth Rate (2026 - 2031) | 8.64% CAGR |
| Fastest Growing Market | Asia Pacific |
| Largest Market | North America |
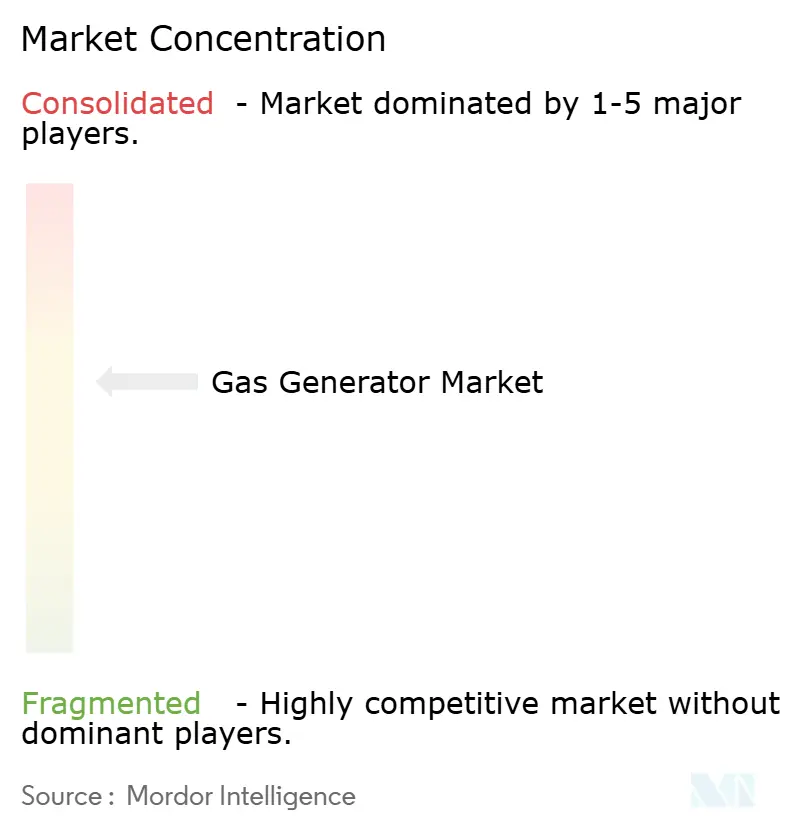
| Market Concentration | Medium |
Major Players
*Disclaimer: Major Players sorted in no particular order Image © Mordor Intelligence. Reuse requires attribution under CC BY 4.0. |
|
Gas Generator Market Analysis by Mordor Intelligence
Gas Generator Market size in 2026 is estimated at USD 5.9 billion, growing from 2025 value of USD 5.43 billion with 2031 projections showing USD 8.92 billion, growing at 8.64% CAGR over 2026-2031.
Robust expansion relies on data-center buildouts, resilience investments for extreme-weather events, and widening pipeline access that anchor natural-gas sets in distributed power strategies. Buyers view gas machines as an efficient bridge technology because operating costs are 20-30% lower than those of diesel, coinciding with sharply lower NOx and CO₂ emissions.[1] Commercial facilities, industrial campuses, and residential neighborhoods, therefore, specify gaseous units to meet uptime and sustainability targets, while regulators tighten particulate and noise limits that restrict the deployment of diesel engines.[2] Service providers reinforce this demand by bundling remote monitoring, predictive maintenance, and fuel-flex options that future-proof capital outlays. Meanwhile, data-center developers turn to on-site natural-gas generation for both standby and peak-shaving roles, creating a high-growth outlet for the gas generator market and accelerating adoption across all kVA classes.
Key Report Takeaways
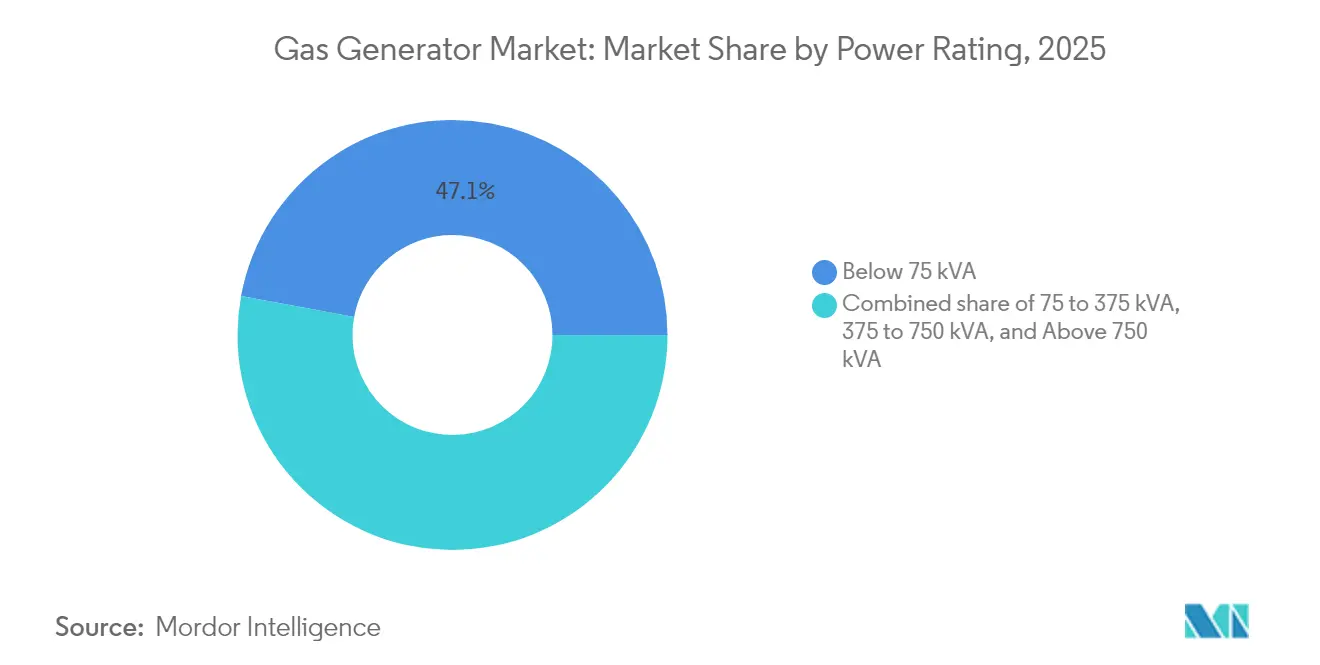
- By power rating, the below 75 kVA segment held 47.10% of the gas generator market share in 2025, and the 75–375 kVA class is projected to expand at a 9.62% CAGR through 2031.
- By application, standby power commanded 50.75% of the gas generator market size in 2025, while peak-shaving is advancing at a 10.19% CAGR through 2031.
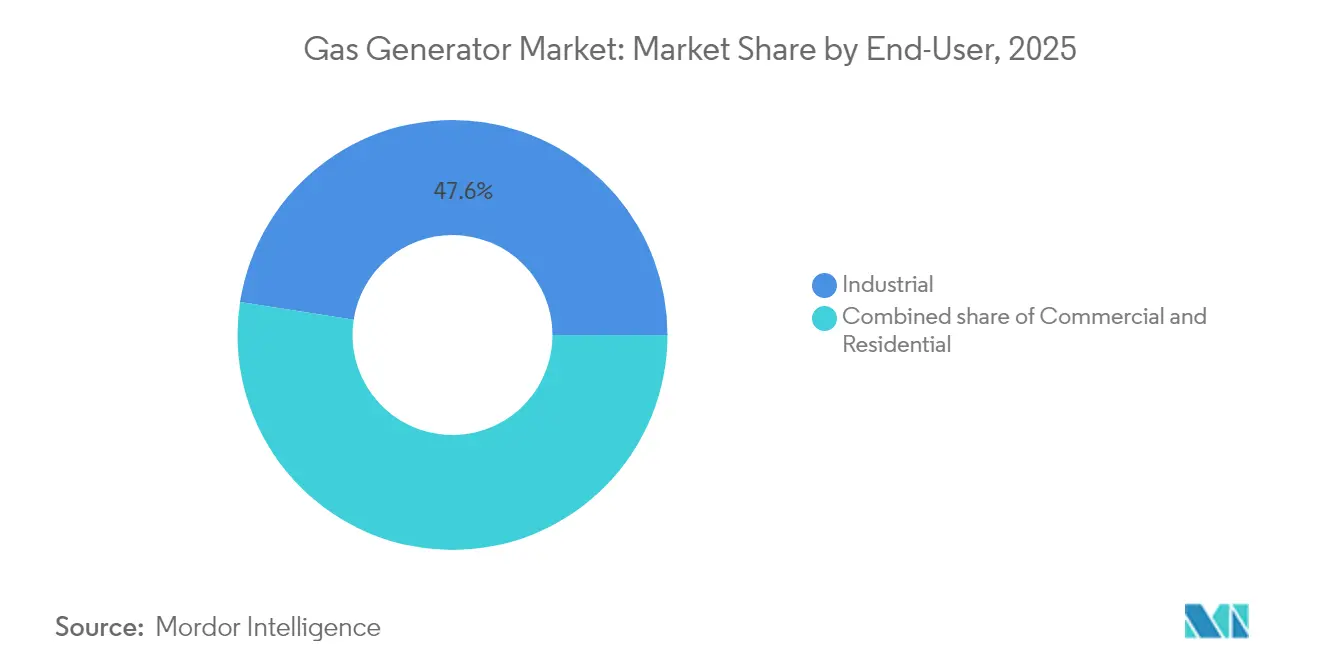
- By end-user, industrial facilities captured a 47.55% share of the gas generator market size in 2025 and are projected to grow at a 9.03% CAGR between 2026 and 2031.
- By geography, North America accounted for 35.05% of the revenue in 2025, whereas the Asia Pacific registered the fastest 9.31% CAGR during the forecast period.
Note: Market size and forecast figures in this report are generated using Mordor Intelligence’s proprietary estimation framework, updated with the latest available data and insights as of 2026.
Global Gas Generator Market Trends and Insights
Drivers Impact Analysis*
| Driver | (~) % Impact on CAGR Forecast | Geographic Relevance | Impact Timeline |
|---|---|---|---|
| Rapid expansion of natural-gas pipeline infrastructure | 1.8% | North America & APAC core, spill-over to Europe | Medium term (2-4 years) |
| Lower OPEX & emissions versus diesel gensets | 1.5% | Global | Short term (≤ 2 years) |
| Backup-power boom in data-centers & hospitals | 1.2% | North America & EU, expanding to APAC | Medium term (2-4 years) |
| Extreme-weather events driving standby installations | 0.9% | North America, Europe, APAC coastal regions | Short term (≤ 2 years) |
| Growth of CHP-ready micro-gas generators | 0.7% | Europe & North America, emerging in APAC | Long term (≥ 4 years) |
| Diesel-genset phase-outs in air-quality non-attainment zones | 0.6% | California, European urban centers | Medium term (2-4 years) |
| Source: Mordor Intelligence | |||
Rapid Expansion of Natural-Gas Pipeline Infrastructure
Widening pipeline networks cuts delivered fuel costs and expands siting flexibility for the gas generator market. The United States alone added 17.8 Bcf/d of new capacity in 2024 through projects such as Mountain Valley Pipeline and Permian takeaway lines, reinforcing supply security for distributed assets. India mirrors this trend as city-gas distribution grids expand to underserved districts, supporting a 60% rise in national demand by 2030.[3]International Energy Agency analysts, “India’s Natural Gas Demand Set for 60 % Rise by 2030,” International Energy Agency, iea.org Consistent fuel availability, particularly for the 75–375 kVA class, benefits commercial and light-industrial loads, while also underpinning the economics of peak-shaving schemes that rely on predictable gas pricing. Continued investment—another 7.3 Bcf/d set to enter service from the Permian Basin—locks in a structural tailwind for the gas generator market across both mature and emerging economies.
Lower OPEX & Emissions Versus Diesel Gensets
Natural-gas units slash running costs by capitalizing on the global fuel-price gap and by minimizing oil changes, filter swaps, and after-treatment upkeep. Operators typically realize a 20-30% lower annual expenditure compared to comparable diesel sets, a saving that is amplified wherever carbon fees apply. California’s Tier 5 off-road rules illustrate the regulatory swing: tougher NOx ceilings push buyers toward gas models that comply without urea injection or particulate filters. The cost-emissions advantage therefore accelerates adoption in industrial parks, shopping malls, and municipal facilities—settings where life-cycle economics and environmental scorecards now matter as much as initial purchase price.
Backup-Power Boom in Data-Centers & Hospitals
Cloud hyperscalers and hospital systems demand 99.999% availability, pushing orders for more than 375 kVA higher. Goldman Sachs expects an additional 47 GW of U.S. data-center load by 2030, with natural gas accounting for 60% of that requirement. GE Vernova is already designing city-scale solutions that bundle multiple multi-megawatt gas blocks to meet AI-driven power density requirements. Hospitals follow suit after outage-related care disruptions, adopting dual-fuel engines that prioritize gas for lower emissions while retaining diesel for contingency. This mission-critical surge ensures sustained demand across the 375–750 kVA and over 750 kVA classes, stabilizing aftermarket service revenue streams for OEMs.
Extreme-Weather Events Driving Standby Installations
More intense hurricanes, heatwaves, and ice storms translate directly into higher residential and commercial generator sales. Hurricane Milton’s 2024 landfall lifted Generac’s share price by 8% as order volume spiked for <75 kVA sets. Texas supermarkets and fuel stations installed microgrids powered mainly by natural gas after grid failures underscored business-interruption risk.[4]California Air Resources Board staff, “Tier 5 Off-Road Engine Standards,” California Air Resources Board, arb.ca.gov Above-average Atlantic storm activity further disrupted Gulf Coast energy hubs, reinforcing the standby value proposition. Insurance carriers now factor backup generation into premium calculations, nudging property owners toward permanent solutions. The pattern reclassifies generators from optional amenities to essential infrastructure across coastlines and wildfire-prone regions.
Restraints Impact Analysis*
| Restraint | (~) % Impact on CAGR Forecast | Geographic Relevance | Impact Timeline |
|---|---|---|---|
| Sparse gas-grid access in remote areas | -1.2% | Rural regions globally, particularly developing markets | Long term (≥ 4 years) |
| Volatile natural-gas pricing | -0.8% | Global, with regional variations | Short term (≤ 2 years) |
| Competition from hydrogen & fuel-cell solutions | -0.6% | Europe & Japan leading, expanding globally | Long term (≥ 4 years) |
| Tightening urban noise & methane-slip rules | -0.4% | Urban centers in developed markets | Medium term (2-4 years) |
| Source: Mordor Intelligence | |||
Sparse Gas-Grid Access in Remote Areas
Extending pipelines to low-density territories remains uneconomical, limiting gas generator penetration in areas where mines, farms, or islands rely on diesel or LPG. A comprehensive Energies review shows that remote microgrid planners still prefer transportable fuels because the capital expenditure for pipe extensions cannot be recouped at modest load factors. Arctic operations face reliability challenges that favor on-site fuel storage over reliance on pipelines.[5]International Energy Agency analysts, “India’s Natural Gas Demand Set for 60 % Rise by 2030,” International Energy Agency, iea.org Without virtual-pipeline or small-scale LNG logistics, adoption of below-75 kVA and 75–375 kVA stalls in these regions. Consequently, gas-set suppliers must pair offerings with LPG kits or hybrid PV-battery packages to stay relevant off-grid.
Volatile Natural-Gas Pricing
Henry Hub averaged USD 2.21/MMBtu in 2024 but could double to USD 4.00 by 2026, squeezing peak-shaving economics. European TTF prices linger near USD 11/MCF amid LNG competition and constrained Russian flows. Commodity swings complicate life-cycle cost calculations and can reopen the door for diesel or battery storage in price-sensitive sectors. Industrial buyers hedge exposure with fixed-price supply contracts, yet volatility still curbs uptake in emerging markets. Stabilizing policies or index-linked service packages will be vital to sustain long-term growth.
*Our forecasts treat driver/restraint impacts as directional, not additive. The impact forecasts reflect baseline growth, mix effects, and variable interactions.
Segment Analysis
By Power Rating: Mid-range sets accelerate while small units retain the lead
The <75 kVA class claimed 47.10% of the gas generator market share in 2025, confirming its dominance in homes and small businesses, where modest loads and quick installation are most important. In contrast, the 75–375 kVA band is projected to post a 9.62% CAGR, the fastest pace among all ratings, as commercial buildings and light-industrial plants enhance resilience after recent outage spikes. The gas generator market size for units above 375 kVA is expanding as data center and hospital projects specify multi-megawatt blocks; however, those tiers together still trail the entry and mid-range segments in total value.
Manufacturers strengthen the 75–375 kVA offering through modular frames that parallel easily and through digital controllers that support peak-shaving cycles. Remote monitoring reduces service visits, improving lifetime economics compared to diesel sets. Meanwhile, models below 75 kVA are gaining traction in new-home construction programs that pre-wire for permanent backup, such as Generac’s partnership with Texas builders. Across all ratings, fuel-flexible designs that can accept future hydrogen blends help protect asset life as decarbonization targets become tighter.


By Application: Peak-shaving rises even as standby power stays dominant
Standby duty held 50.75% of the gas generator market size in 2025, reflecting the fundamental need for uninterrupted electricity in safety-critical uses. Healthcare campuses, telecom hubs, and municipal facilities continue to view on-site gas units as the surest hedge against grid failures. Peak-shaving records a 10.19% CAGR to 2031 as demand-charge tariffs rise and utilities reward fast-response capacity that alleviates network stress.
Growth in peak shaving stems from commercial customers that run generators for a few hours each month to flatten their load profiles and from industrial sites that dispatch units during price spikes. Modern engines tolerate frequent start-stop cycles and integrate with building-energy management systems, allowing one asset to switch between standby, peak-shave, and limited prime roles. Prime or continuous duty remains a niche for off-grid mines, construction camps, and remote oil and gas pads where pipeline access exists but the bulk grid does not.
By End-User: Industrial plants anchor volume while homes show the quickest lift
Industrial facilities captured 47.55% of 2025 revenue, the highest share among end users, and are projected to expand at a healthy 9.03% CAGR as process electrification advances. Fertilizer, refining, and chemicals operations in India and the United States utilize gas sets for both backup and combined heat and power, leveraging fuel availability and waste heat recovery to reduce overall energy costs. Commercial buildings follow, installing mid-range ratings that balance space constraints with the rising need for power quality.
Residential demand grows the fastest due to heightened awareness of outage risk and the spread of neighborhood gas mains. Builder programs fold small generators into mortgage packages, easing upfront cost barriers. Remote diagnostics and subscription maintenance make ownership simpler, encouraging adoption beyond traditional storm-prone states. Together, these patterns confirm that every customer tier now views gas technology as a flexible tool for enhancing reliability, controlling costs, and reducing carbon footprints.
Geography Analysis
North America accounted for 35.05% of the gas generator market share in 2025, driven by the world’s largest pipeline grid and a policy shift away from diesel engines. The United States alone placed 17.8 Bcf per day of new pipe in service during 2024, ensuring ample fuel for behind-the-meter assets across the Gulf Coast and Appalachia. Data-center clusters in Virginia and Texas utilize multi-megawatt gas blocks that serve both standby and peak-shaving roles, while supermarkets and municipal pumps employ 150 kVA to 300 kVA frames for storm resilience. California regulations that phase out diesel gensets in non-attainment counties further channel spending toward cleaner spark-ignition models, cementing regional leadership.
The Asia Pacific is projected to post the fastest 9.31% CAGR through 2031, as pipeline build-out, LNG imports, and industrial modernization converge. India’s natural-gas demand is set to climb 60% by 2030, and city-gas distribution schemes now reach secondary towns, unlocking a broad base for <375 kVA equipment. In China, factory automation drives tighter power-quality specs that favor on-site gas generation, while provincial incentive programs reimburse up to 20% of capital cost for high-efficiency CHP units. Japan and South Korea pair pilot hydrogen-ready engines, yet natural gas remains the primary fuel for backup and grid-support duties until the costs of reen hydrogen call.
Europe maintains gradual expansion despite high TTF prices that squeeze fuel-cost advantages. Energy-security policies in Germany and the Netherlands are driving combined heat and power retrofits, while silent enclosures that meet 65 dB(A) city limits open up opportunities in densely populated urban districts. Hybrid systems that combine gas engines with battery storage enable facilities to pass stringent grid-interconnection tests, sustaining demand in both the 75–375 kVA and 375–750 kVA ranges. South America and the Middle East & Africa register accelerating orders as new cross-border pipelines and LNG terminals unlock supply, though sparse rural grids still cap penetration in remote provinces.


Competitive Landscape
Established vendors shape a moderately concentrated field by combining engine manufacture, electronics, and digital service into unified offerings that span every kVA class. Generac deepened vertical control with the April 2025 purchase of MOTORTECH, gaining ignition, mixer, and knock-detection subsystems that raise efficiency across the 75–375 kVA tier. Caterpillar invests in its Active Management Platform, enabling fleet-wide dispatch and predictive maintenance that enhances peak shaving and prime applications for commercial and industrial users. Deutz broadened its scope from engines to full generator sets through the June 2024 acquisition of Blue Star Power Systems, positioning for growth in U.S. municipal and telecom projects.[6]Deutz Communications, “Deutz Acquires Blue Star Power Systems,” RER Magazine, rermag.com
Fuel flexibility becomes a core differentiator as Cummins launches HELM™ platforms that share blocks yet accept natural gas today and hydrogen blends tomorrow, protecting customer capital during the energy transition. Mitsubishi Heavy Industries leads hydrogen-engine pilots, targeting a 500 kW package for release in fiscal 2026 that will serve data-center and industrial loads while maintaining compatibility with natural gas. HD Hyundai Infracore secured state backing to develop 500 kWe hydrogen generators, intensifying future competitive pressure on legacy gas sets.
Digital support services reinforce stickiness. Caterpillar and Generac offer cloud dashboards that track run hours, fuel flow, and emissions, thereby reducing downtime and revealing potential upsell paths for analytics subscriptions. Smaller disruptors focus on micro-CHP units that hit 35.2% AC electrical efficiency and operate on natural gas, biogas, or hydrogen, appealing to European apartment blocks and U.S. universities. Collectively, players that integrate remote monitoring, fuel agility, and hybrid-system readiness are best positioned to capture the next wave of demand in the gas generator market.
Gas Generator Industry Leaders
-
Generac Holdings Inc.
-
Caterpillar Inc.
-
General Electric Company
-
Cummins Inc.
-
Kohler Co.
- *Disclaimer: Major Players sorted in no particular order

Recent Industry Developments
- July 2025: Generac Holdings announced a USD 8 million expansion for a 75,000 ft² customer-contact center in Waukesha County, adding 300 staff to support rising backup-power demand.
- July 2025: Generac partnered with Highland Homes to pre-install gas backup units in new houses across major Texas metros, strengthening its over 75 kVA pipeline.
- April 2025: Caterpillar unveiled the C13D flexible-fuel engine at Bauma 2025, featuring eight ratings ranging from 340 kW to 515 kW, as well as future capabilities for natural gas and hydrogen.
- April 2025: Generac finalized the acquisition of MOTORTECH, adding gaseous-engine control components to its portfolio.


Global Gas Generator Market Report Scope
A gas generator runs on gas instead of the traditional choices of fuel, such as gasoline or diesel, and produces the required electricity. As one of the most economical and efficient fuels among non-renewable resources for power generation, natural gas can power emergency and portable generators.
The gas generator market is segmented by capacity, end-user, and geography. The market is segmented by capacity into less than 75 kVA, 75-375 kVA, and above 375 kVA. By end user, the market is segmented into industrial, commercial, and residential. The report also covers the market size and forecasts for the gas generator market across the major region. The market sizing and forecasts are based on each segment's revenue (USD).
By Power Rating
| Below 75 kVA |
| 75 to 375 kVA |
| 375 to 750 kVA |
| Above 750 kVA |
By Application
| Standby |
| Peak Shaving |
| Prime/Continuous |
By End-User
| Industrial |
| Commercial |
| Residential |
By Geography
| North America | United States |
| Canada | |
| Mexico | |
| Europe | Germany |
| United Kingdom | |
| France | |
| Italy | |
| NORDIC Countries | |
| Russia | |
| Rest of Europe | |
| Asia Pacific | China |
| India | |
| Japan | |
| South Korea | |
| ASEAN Countries | |
| Rest of Asia-Pacific | |
| South America | Brazil |
| Argentina | |
| Rest of South America | |
| Middle East and Africa | Saudi Arabia |
| United Arab Emirates | |
| South Africa | |
| Egypt | |
| Rest of Middle East and Africa |
| By Power Rating | Below 75 kVA | |
| 75 to 375 kVA | ||
| 375 to 750 kVA | ||
| Above 750 kVA | ||
| By Application | Standby | |
| Peak Shaving | ||
| Prime/Continuous | ||
| By End-User | Industrial | |
| Commercial | ||
| Residential | ||
| By Geography | North America | United States |
| Canada | ||
| Mexico | ||
| Europe | Germany | |
| United Kingdom | ||
| France | ||
| Italy | ||
| NORDIC Countries | ||
| Russia | ||
| Rest of Europe | ||
| Asia Pacific | China | |
| India | ||
| Japan | ||
| South Korea | ||
| ASEAN Countries | ||
| Rest of Asia-Pacific | ||
| South America | Brazil | |
| Argentina | ||
| Rest of South America | ||
| Middle East and Africa | Saudi Arabia | |
| United Arab Emirates | ||
| South Africa | ||
| Egypt | ||
| Rest of Middle East and Africa | ||


Key Questions Answered in the Report
What CAGR does the global gas generator market expect between 2026 and 2031?
The market is forecast to advance at an 8.64% CAGR, growing from USD 5.9 billion in 2026 to USD 8.92 billion by 2031.
Which power-rating segment grows fastest through 2031?
Units rated 75–375 kVA show the quickest 9.62% CAGR as commercial and light-industrial sites expand backup and peak-shaving capacity.
Why are natural-gas generators replacing diesel units?
Operators gain 20-30% lower operating costs and easier compliance with stricter NOx standards, especially in California and Europe.
Why are companies replacing diesel with gas generators?
Operators gain 20-30% lower operating costs and easier compliance with strict NOx rules, especially in California and European cities.
Which region leads overall revenue today?
North America holds about 35.05% of 2025 revenue thanks to its extensive pipeline network and emissions policies that discourage diesel.
Where is demand expanding the most rapidly?
Asia Pacific posts the highest 9.31% CAGR, driven by India’s pipeline build-out and China’s industrial modernization.
How are vendors preparing for hydrogen adoption?
Leading manufacturers launch engines that run on natural gas now yet can accept hydrogen blends or 100% hydrogen in future upgrades.
Page last updated on:


