Game Development Market Size and Share
Market Overview
| Study Period | 2020 - 2031 |
|---|---|
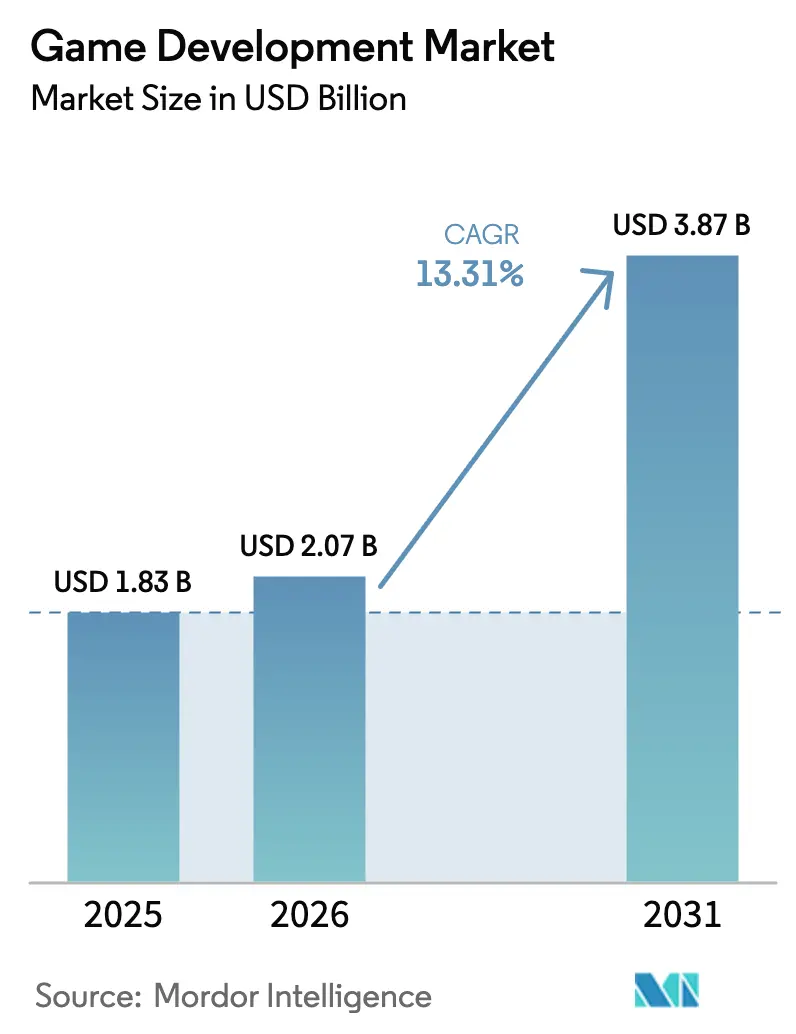
| Market Size (2026) | USD 2.07 Billion |
| Market Size (2031) | USD 3.87 Billion |
| Growth Rate (2026 - 2031) | 13.31% CAGR |
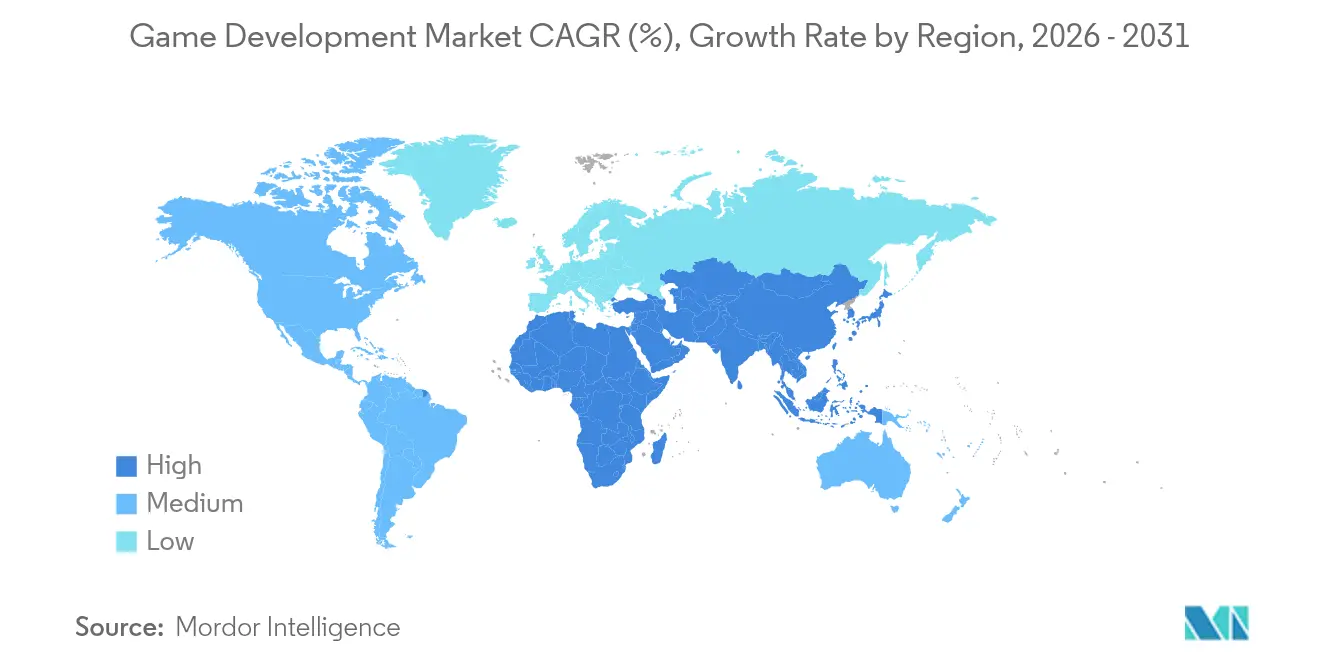
| Fastest Growing Market | Middle East |
| Largest Market | Asia Pacific |
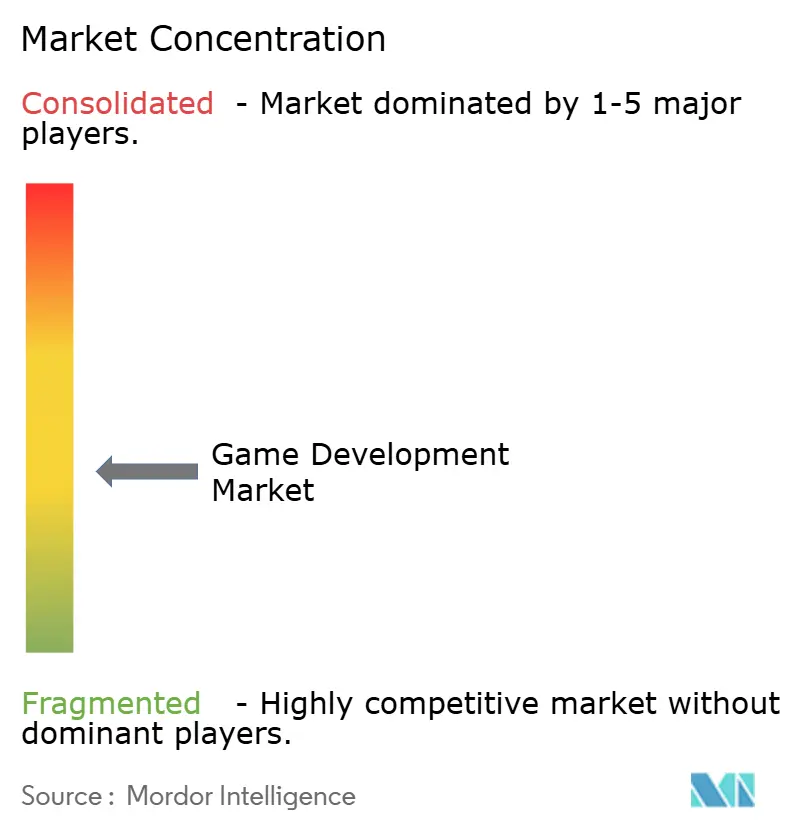
| Market Concentration | Medium |
Major Players *Disclaimer: Major Players sorted in no particular order Image © Mordor Intelligence. Reuse requires attribution under CC BY 4.0. | |
Game Development Market Analysis by Mordor Intelligence
The game development market size is expected to grow from USD 1.83 billion in 2025 to USD 2.07 billion in 2026 and is forecast to reach USD 3.87 billion by 2031 at 13.31% CAGR over 2026-2031. Momentum stems from 5G-enabled cloud gaming, rapid mobile adoption across emerging economies, and the spill-over of real-time engines into automotive and film production. Rising live-service monetization, procedural-AI asset creation, and enterprise licensing of game engines further widen revenue streams. Outsourcing of specialized services mitigates talent scarcity, while Saudi Arabia’s USD 37.7 billion investment blueprint and the UAE’s infrastructure push elevate Middle-East growth prospects. At the same time, regulatory scrutiny of loot boxes and escalating senior-engineer salaries temper expansion. Competitive dynamics intensify as Unity’s pricing backlash fuels developer migration to Epic’s Unreal Engine, prompting platform providers to sweeten revenue-share terms.
Key Report Takeaways
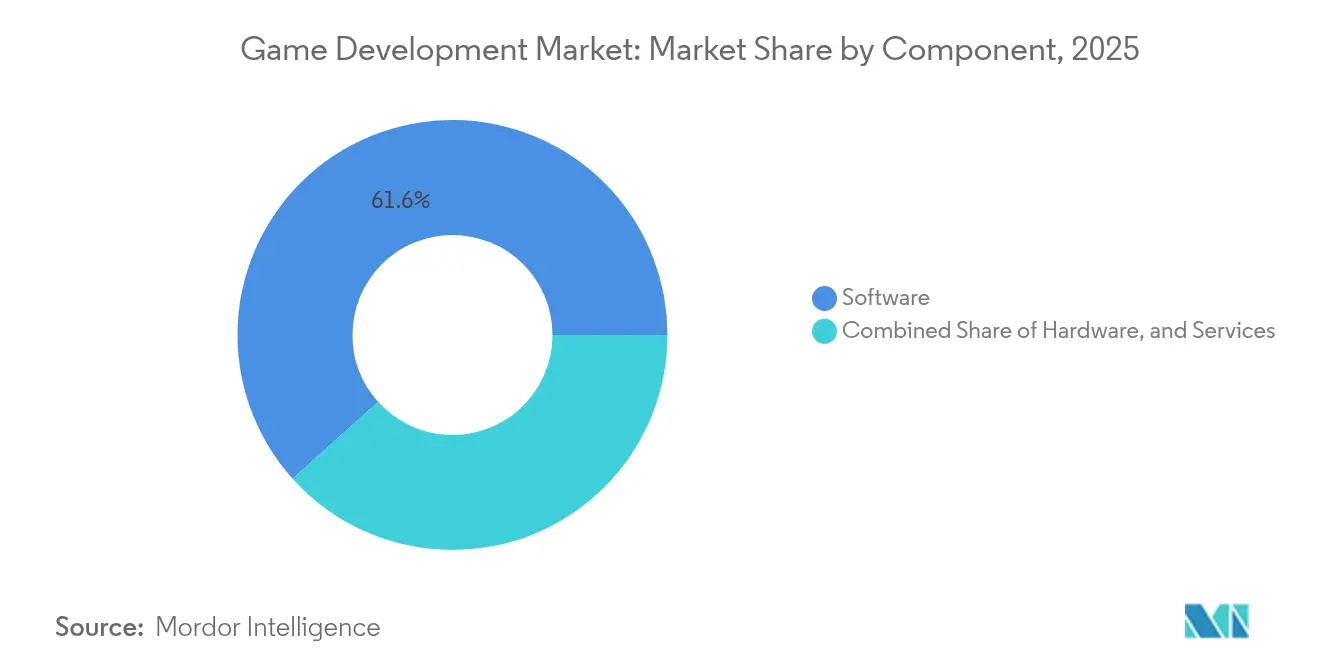
- By component, Software retained 61.65% of the game development market share in 2025, while Services is projected to expand at an 17.95% CAGR through 2031.
- By platform, Mobile led with 52.35% of 2025 revenue, whereas Cloud Gaming is forecast to rise at a 43.20% CAGR to 2031.
- By game genre, Action/Adventure commanded 30.25% share of the game development market size in 2025; Role-Playing Games are set to grow at a 14.05% CAGR.
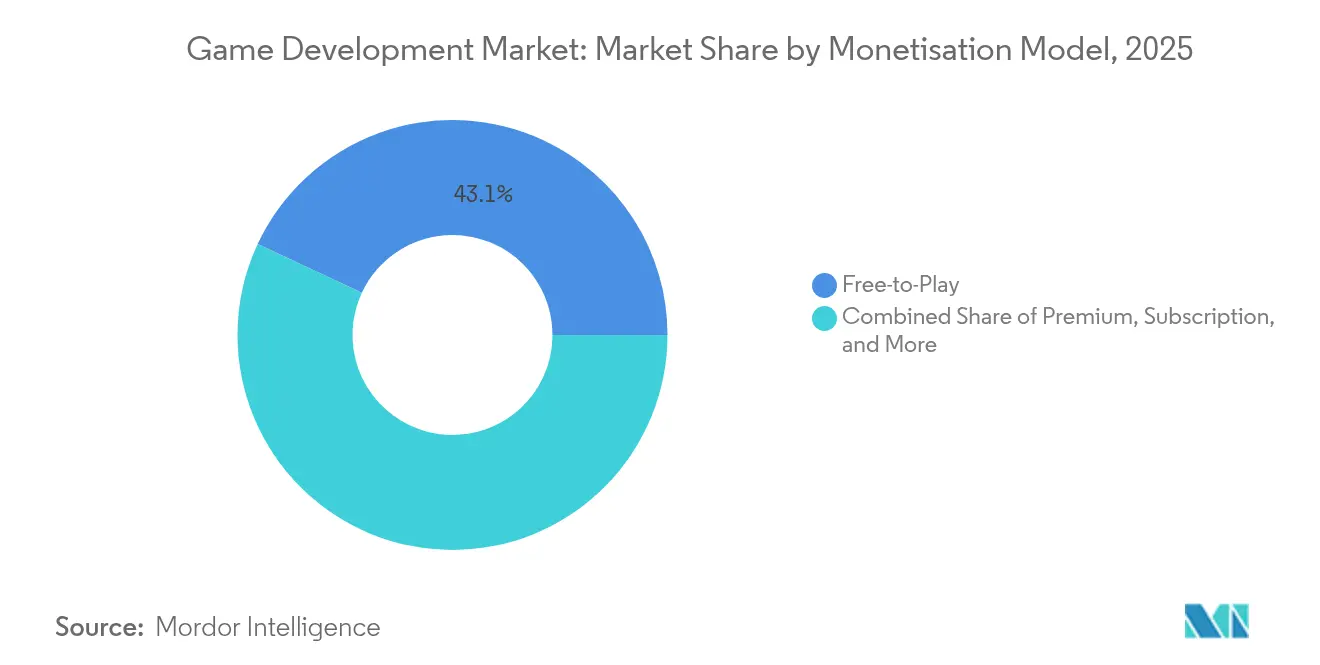
- By monetisation model, Free-to-Play held 43.05% adoption in 2025; Subscription models are advancing at a 22.85% CAGR.
- By end-user, Individual Gamers represented 68.75% demand in 2025, while Esports Organizations are expanding at a 19.15% CAGR.
- By geography, Asia-Pacific accounted for 44.85% of global revenue in 2025, whereas the Middle East is on track for a 17.35% CAGR to 2031.
Note: Market size and forecast figures in this report are generated using Mordor Intelligence’s proprietary estimation framework, updated with the latest available data and insights as of 2026.
Global Game Development Market Trends and Insights
Driver Impact Analysis*
| Driver | (~) % Impact on CAGR Forecast | Geographic Relevance | Impact Timeline |
|---|---|---|---|
| Widespread 5G rollout expands cloud-gaming addressable base | +2.1% | Global, with early gains in South Korea, China, UAE | Medium term (2-4 years) |
| Mobile-first emerging-market user surge | +1.8% | Asia-Pacific core, spill-over to MEA and Latin America | Short term (≤ 2 years) |
| AAA studios' pivot to live-service monetisation | +1.5% | North America and EU, expanding to Asia-Pacific | Medium term (2-4 years) |
| Mainstream adoption of real-time game engines in film/automotive | +1.2% | North America and EU, selective Asia-Pacific markets | Long term (≥ 4 years) |
| Procedural and generative-AI tools slash asset-creation time | +1.7% | Global | Short term (≤ 2 years) |
| Blockchain-powered user-generated economies | +0.9% | Global, with regulatory variations | Long term (≥ 4 years) |
| Source: Mordor Intelligence | |||
Widespread 5G Rollout Expands Cloud-Gaming Addressable Base
5G removes hardware bottlenecks by shifting rendering to the edge, letting developers target mid-tier devices with AAA visuals. Samsung’s 2024 launch of a mobile cloud gaming hub delivered a 25% higher return on ad spend for first movers. Telecommunications carriers in Southeast Asia now position themselves as distribution partners, bundling zero-rating data and local payments that bypass app-store commissions. Development roadmaps have therefore pivoted to cloud-native architectures, with server-authoritative code and latency-aware design becoming baseline requirements.
Mobile-First Emerging-Market User Surge
Emerging economies leapfrog consoles, leading studios to craft mobile-native titles that embed regional payment options and culturally resonant themes. KRAFTON’s USD 200 million India fund illustrates the scale of localized investment needed to capture these audiences. Back-end systems increasingly support live chat, clan management and user-generated content to foster social stickiness. The dynamic shifts revenue focus from unit sales to lifetime value, elevating analytics and A/B testing in the production pipeline.
AAA Studios’ Pivot to Live-Service Monetisation
Electronic Arts derived 73% of 2025 revenue from live services while 95% of studios now plan live-service releases [1]Metavert, “Live-Service Economics in AAA Publishing,” metavert.com. Continuous content drops, telemetry-driven balancing and influencer-led community management redefine post-launch workflows. Average budgets allocate USD 22 million toward third-party live-operations infrastructure, reducing build-time but raising the bar on sustained engagement. Success hinges on aligning content cadence with player retention metrics rather than shipping sequels.
Mainstream Adoption of Real-Time Game Engines in Film/Automotive
Epic’s Detroit expansion and Audi’s interactive showrooms underscore the enterprise pull for real-time visualization. Unreal Engine shortens design cycles by letting stakeholders iterate on photoreal scenes in-session, cutting prototype costs. Unity’s collaborations with Toyota and Raytheon further validate industrial appetite, presenting game-engine vendors with higher-margin licensing beyond entertainment.
Restraint Impact Analysis*
| Restraint | (~) % Impact on CAGR Forecast | Geographic Relevance | Impact Timeline |
|---|---|---|---|
| Escalating talent costs and shortage of senior engineers | -1.9% | North America and EU, spreading to Asia-Pacific | Short term (≤ 2 years) |
| App-store policy volatility on IAP and commissions | -1.4% | Global, with regulatory variations | Medium term (2-4 years) |
| Hardware-driven QA fragmentation for XR titles | -0.8% | Global, concentrated in early XR markets | Medium term (2-4 years) |
| Regulatory scrutiny on loot-box monetisation models | -1.1% | EU and North America, expanding globally | Long term (≥ 4 years) |
| Source: Mordor Intelligence | |||
Escalating Talent Costs and Shortage of Senior Engineers
Half of UK studios reported recruitment difficulties in 2024, and salary inflation now threatens project timelines. Studios counter by opening hubs in Poland and the Philippines and by outsourcing specialized tasks to manage cost peaks. Middleware vendors gain relevance as in-house tool building becomes less economical at current wage levels.
Regulatory Scrutiny on Loot-Box Monetisation Models
The FTC fined HoYoverse USD 20 million in 2025 over minors’ data, signaling tougher enforcement [2]k-id, “FTC Fines HoYoverse Over Loot Box Practices,” kidsafetysandbox.com. Belgium’s outright ban contrasts with softer disclosure rules elsewhere, forcing region-specific code forks that inflate QA and compliance budgets. Subscription passes and transparent cosmetics are rising as safer alternatives, albeit at the expense of short-term spending spikes.
*Our forecasts treat driver/restraint impacts as directional, not additive. The impact forecasts reflect baseline growth, mix effects, and variable interactions.
Segment Analysis
By Component: Services Accelerate Amid Outsourcing Wave
Software represented 61.65% of 2025 revenue, yet Services is projected to grow 17.95% annually as studios externalize live-operations, analytics and art pipelines. Publishers facing 15% wage inflation now favor variable-cost engagements that scale with user peaks. The game development market size for Services is therefore expected to widen its contribution steadily through 2031.
Keywords Studios’ acquisition of Certain Affinity illustrates a land-grab for elite co-development talent. Survey data showing 77% of studios distressed by rising production costs and 94% exploring cloud pipelines explain the surge in demand for specialized providers . Over the forecast, the game development market will see service vendors evolve into strategic partners who shoulder live-service KPIs rather than merely deliver assets.


By Platform: Cloud Gaming Disrupts Traditional Development
Cloud Gaming’s 43.20% CAGR dwarfs growth on incumbent hardware, despite Mobile holding 52.35% of 2025 spending. The shift reflects 5G ubiquity and operator-level distribution deals that reduce acquisition friction. Studios now treat server churn and latency budgets as core metrics, inserting cloud orchestration engineers into sprint teams.
Multiplatform roadmaps rose 40% since 2021, confirming that hedging against platform risk is vital. As the game development market size for cloud deployments expands, tooling vendors race to integrate edge diagnostic dashboards and cross-save APIs. PC and console titles still anchor monetization in high-ARPU territories but increasingly serve as prestige showcases for IP that monetizes at scale on cloud nodes.
By Game Genre: RPG Innovation Drives Engagement
Action/Adventure retained 30.25% revenue share in 2025, yet Role-Playing Games are tracking a 14.05% CAGR as procedural generation slashes content costs. Deeper progression arcs and social guild systems align seamlessly with live-service retention loops. Smaller studios leverage AI quest generators to keep pace, narrowing the content gap with AAA rivals.
Strategy and Simulation developers now embed idle mechanics borrowed from mobile to raise daily active users, while racing franchises partner with automakers for photogrammetry assets that heighten realism without ballooning budgets. The game development market benefits as genre hybridity encourages cross-demographic appeal, blurring lines between traditional categories.
By Monetisation Model: Subscription Growth Signals Maturity
Free-to-Play dominated 43.05% of 2025 titles, but Subscription passes are expanding at 22.85% CAGR as studios seek steadier cash flows. Regulatory headwinds on loot boxes accelerate this pivot, while platform holders bundle cloud access and libraries to encourage retention. The game development market share attributable to subscriptions will therefore climb, particularly in high-income regions subject to tighter gambling rules.
Unity reported a 26.7% jump in in-app advertising revenue, showing that hybrid models still thrive when ads complement cosmetic micro-transactions. Premium one-off pricing now succeeds mainly for niche, story-driven projects with loyal fanbases, reinforcing diversification rather than displacement among monetisation frameworks.
By End-User: Esports Professionalization Accelerates
Individual Gamers drove 68.75% of 2025 spend, yet Esports Organizations are scaling at 19.15% CAGR on the back of new arenas and league investments across the Gulf. Saudi Arabia alone plans 150 dedicated venues by 2030, while the UAE’s True Gamers allocated USD 45 million for regional roll-out.
Developers integrate observer modes, API-based stat feeds and anti-cheat layers from day one, recognizing that competitive viability extends a title’s lifecycle. Enterprise and education segments adopt game tech for simulations, nudging engine vendors toward compliance and data-privacy toolkits. The broader game development market accordingly diversifies its customer base beyond entertainment.
Geography Analysis
Asia-Pacific commanded 44.85% of 2025 revenue owing to China’s mobile powerhouse studios, South Korea’s 5G leadership and Japan’s console heritage. Regional publishers optimize launch cadences around public holidays and weave local payment methods such as QR-code wallets into game clients. Cross-border collaboration hubs in Singapore and Malaysia funnel art and localization tasks, reinforcing cost-efficiency while meeting rising quality standards.
The Middle East posts the fastest 17.35% CAGR on the back of sovereign investment funds, tax incentives and esports infrastructure. Saudi Arabia’s USD 37.7 billion commitment and Dubai’s free-zone benefits lure global studios into joint ventures, shortening market-entry lead times. Cultural content guidelines necessitate region-specific narrative adjustments, but high disposable incomes offset localization expense.
North America and Europe remain innovation laboratories. Cloud-native tooling, AI middleware and live-service analytics often debut in San Francisco, Montreal and Helsinki before global rollout. Yet 50% of UK studios cited hiring challenges in 2024, prompting near-shore outsourcing to Poland, Spain and Ireland. Africa and Latin America gain traction as connectivity improves, with Brazil’s console-centric audience now embracing cloud delivery and Nigeria experimenting with telecom-bundled gaming passes.

Competitive Landscape
The game development market exhibits moderate fragmentation. Unity’s 2024 pricing overhaul triggered a notable migration toward Unreal Engine, while open-source options such as Godot received newfound attention. Engine vendors now compete on revenue-share thresholds and cloud build minutes rather than feature tick-lists.
Major publishers pursue vertical integration. Epic leverages Fortnite’s ecosystem to cross-promote assets, advertising and payment services, whereas Tencent acquires stakes in content studios to secure evergreen IP pipelines. Middleware specialists focusing on live-operations dashboards, AI asset upscaling and compliance automation attract venture funding as developers outsource niche pain points.
Strategic differentiation centers on AI. With 96% of developers deploying AI-driven asset workflows and 94% evaluating cloud infrastructure, tooling ecosystems that bundle machine-learning inference, edge orchestration and data-privacy safeguards enjoy growing stickiness. Emerging disruptors include decentralized compute providers that pay users for idle GPU cycles, potentially eroding hyperscaler dominance over cloud gaming.
Game Development Industry Leaders
Unity Technologies Inc.
Epic Games Inc.
Adobe Inc.
Autodesk Inc.
NVIDIA Corporation
- *Disclaimer: Major Players sorted in no particular order

Recent Industry Developments
- April 2025: Unity reveals development of Nintendo Switch 2 launch title Survival Kids with Konami.
- January 2025: Scopely completes its USD 3.5 billion acquisition of Niantic’s games business, including Pokémon GO and Monster Hunter Now
- January 2025: Tencent reportedly considers acquiring Nexon for USD 15 billion, eyeing evergreen franchises with robust communities.
- December 2024: Tencent raises its stake in Kuro Games to 51.4%, becoming the sole external shareholder.


Research Methodology Framework and Report Scope
Market Definitions and Key Coverage
Our study defines the game development market as all fee-based software platforms, middleware, and contract services that enable the design, coding, art creation, testing, and deployment of interactive entertainment titles for mobile, console, PC, cloud, and XR endpoints. The measurement is expressed in constant-2024 US dollars at the point where development tools or specialist hours are billed to studios or publishers.
Scope exclusion: publishing revenues, in-game monetization, gaming hardware, and consumer subscription fees fall outside this boundary.
Segmentation Overview
- By Component
- Software
- Hardware
- Services
- By Platform
- Mobile
- PC
- Console
- Cloud Gaming
- By Game Genre
- Action/Adventure
- Role-Playing (RPG)
- Sports/Racing
- Strategy/Simulation
- Casual/Puzzle
- Others
- By Monetisation Model
- Free-to-Play
- Premium
- Subscription
- Ad-Based/Hybrid
- By End-user
- Individual Gamers
- Enterprises and Educational
- Esports Organisations
- By Geography
- North America
- United States
- Canada
- Mexico
- South America
- Brazil
- Argentina
- Rest of South America
- Europe
- Germany
- United Kingdom
- France
- Italy
- Spain
- Russia
- Rest of Europe
- Asia-Pacific
- China
- Japan
- India
- South Korea
- Australia and New Zealand
- Rest of Asia-Pacific
- Middle East and Africa
- Middle East
- Saudi Arabia
- United Arab Emirates
- Turkey
- Rest of Middle East
- Africa
- South Africa
- Nigeria
- Egypt
- Rest of Africa
- Middle East
- North America
Detailed Research Methodology and Data Validation
Primary Research
Mordor analysts interviewed engine licensors, art-outsourcing executives, live-ops consultants, and indie studio founders across North America, Europe, East Asia, and emerging hubs such as Brazil and India. These discussions validated price bands for hourly services, clarified license-mix assumptions, and revealed regional tooling preferences that secondary data could not surface.
Desk Research
We extracted foundational numbers from public sources such as the US Bureau of Labor Statistics, the European Games Developer Federation salary census, China's Game Industry Report, UN Comtrade lookup of software export codes, and WIPO patent filings for real-time engines. Company filings, press releases, and investor decks were screened through D&B Hoovers and Dow Jones Factiva to benchmark vendor revenues. Developer headcount estimates were cross-checked against SteamDB studio listings and GitHub repository analytics, providing an open proxy for active tool users. These named sources illustrate the range consulted; many additional open datasets and regulatory disclosures informed the evidence base.
A final pass through Questel's patent database and regional trade-association white papers helped us map emerging tech (e.g., generative-AI pipelines) and spot volume inflection points for our forecast horizon. The desk-research references listed are indicative, not exhaustive, and other materials fed into data collection, validation, and clarification.
Market-Sizing & Forecasting
A top-down model begins with the global pool of professional developers, reconstructed from national employment statistics and adjusted for part-time contractors, which is then multiplied by average spend on tool licenses and outsourced hours. Supplier roll-ups of fifteen publicly reported vendors and channel checks on bundled cloud-build packages provide bottom-up reference points, allowing us to reconcile and fine-tune the totals. Key variables like game-studio formation rates, median team size by platform, penetration of paid engine tiers, hourly outsource rates, and venture funding into indie projects drive the baseline. Multivariate regression links these inputs to macro indicators such as smartphone installed base and 5G subscriptions to project demand through 2030, with scenario tweaks applied where regulatory changes or exchange-rate shocks are plausible.
Data Validation & Update Cycle
Outputs pass a two-step analyst review, anomaly checks against independent salary and revenue series, and variance reconciliation with prior editions. The model refreshes annually; interim updates are triggered by material events like a new console generation, major engine pricing shifts, or large-scale studio consolidations. Before publication, a fresh data sweep ensures clients receive the latest view.
Why Mordor's Game Development Baseline Stands Firm
Published estimates differ because firms frame 'development' in unique ways, choose different cost baskets, and refresh at uneven cadences.
Key gap drivers span scope (some studies track only outsourcing, others fold in internal R&D), geographic reach, treatment of free community editions, and currency translation dates, which together create wide swings in dollar values.
Benchmark comparison
| Market Size | Anonymized source | Primary gap driver |
|---|---|---|
| USD 1.83 B (2025) | Mordor Intelligence | |
| USD 0.53 B (2024) | Regional Consultancy A | Limited to five outsourcing hubs; excludes engine license revenue and cloud build fees |
| USD 0.44 B (2024) | Trade Journal B | Tracks indie studios only; omits contractor spend and converts at spot rates without PPP adjustment |
| USD 41.7 B (2023) | Global Consultancy A | Blends full game-studio operating budgets with dev services and includes hardware engineering costs |
This comparison shows that, by selecting a clear value-chain boundary, updating every twelve months, and balancing top-down modeling with supplier roll-ups, Mordor Intelligence delivers a dependable, decision-ready baseline for stakeholders.


Key Questions Answered in the Report
What is the current size of the game development market?
The game development market size stands at USD 2.07 billion in 2026.
How fast is the game development market expected to grow?
It is projected to reach USD 3.87 billion by 2031, posting a 13.31% CAGR over the 2026-2031 forecast period.
Which region is growing the quickest for game development?
The Middle East is the fastest-growing region, advancing at a 17.35% CAGR through 2031 due to sizable sovereign investments.
Why are services outpacing software in growth?
Studios outsource live-operations, analytics and art pipelines to manage rising wage costs, driving the Services segment at an 17.95% CAGR.
What is driving cloud gaming adoption?
5G networks enable server-side rendering, letting developers deliver console-grade experiences on mid-tier devices and spurring a 43.20% CAGR for cloud platforms.
How are regulatory actions affecting monetisation?
Tightening oversight of loot boxes encourages a shift toward subscription passes and cosmetic micro-transactions that carry lower compliance risks.
Page last updated on:


