Fructose Market Size and Share
Market Overview
| Study Period | 2021 - 2031 |
|---|---|
| Market Size (2026) | USD 5.82 Billion |
| Market Size (2031) | USD 8.20 Billion |
| Growth Rate (2026 - 2031) | 7.07% CAGR |
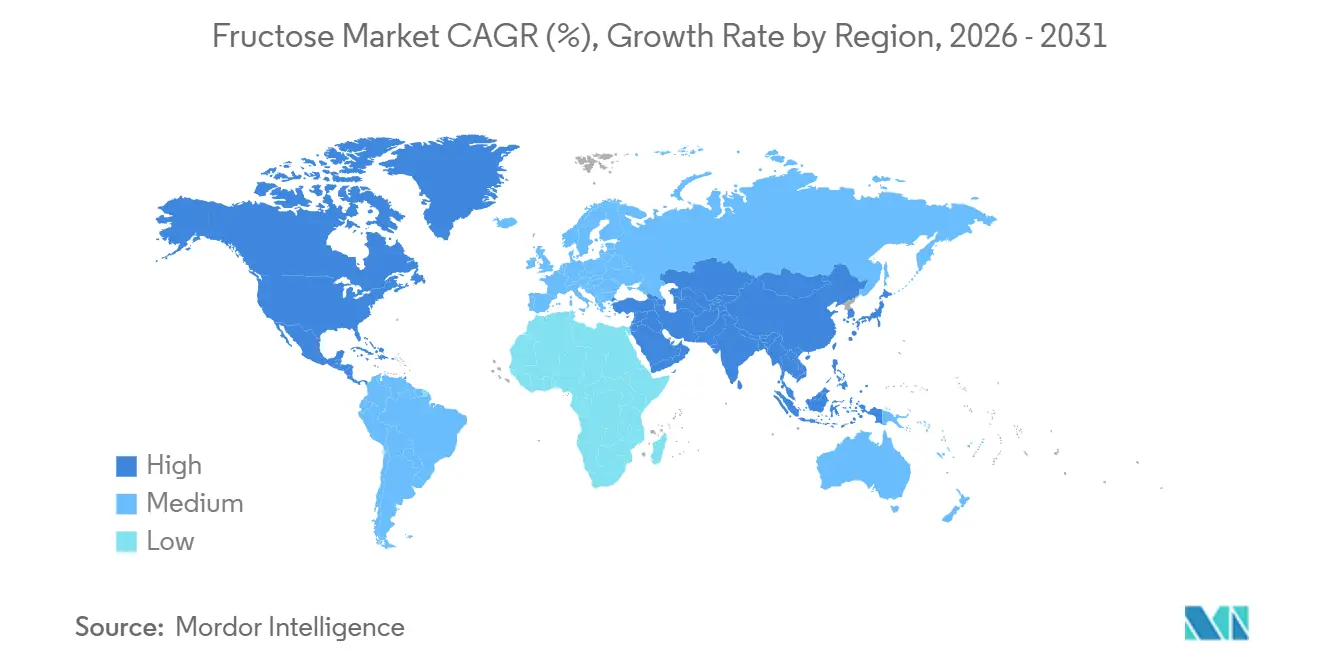
| Fastest Growing Market | Asia Pacific |
| Largest Market | North America |
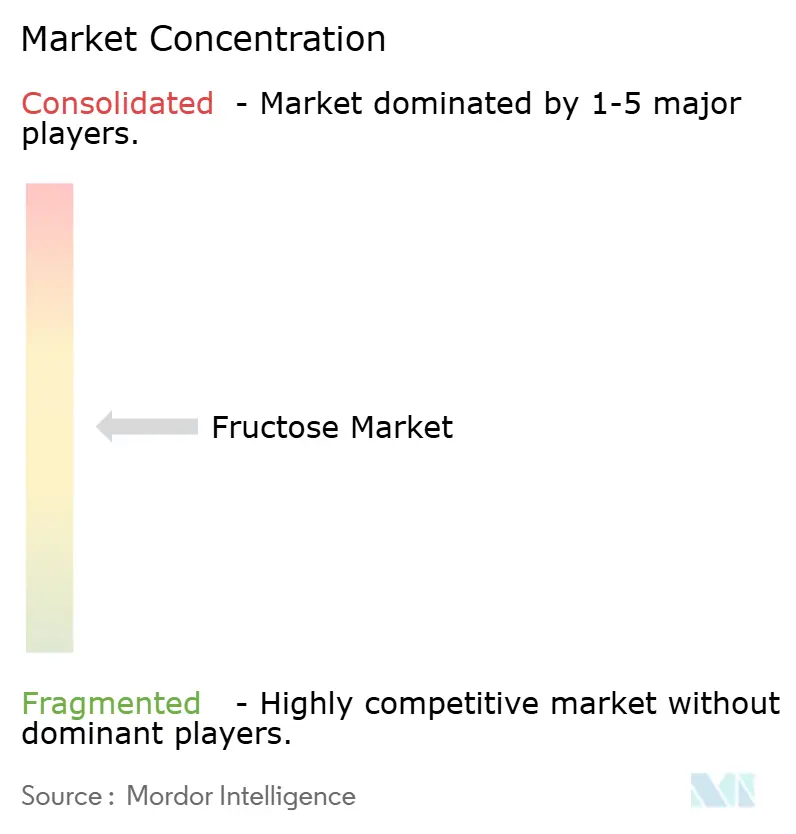
| Market Concentration | Medium |
Major Players
*Disclaimer: Major Players sorted in no particular order Image © Mordor Intelligence. Reuse requires attribution under CC BY 4.0. |
|
Fructose Market Analysis by Mordor Intelligence
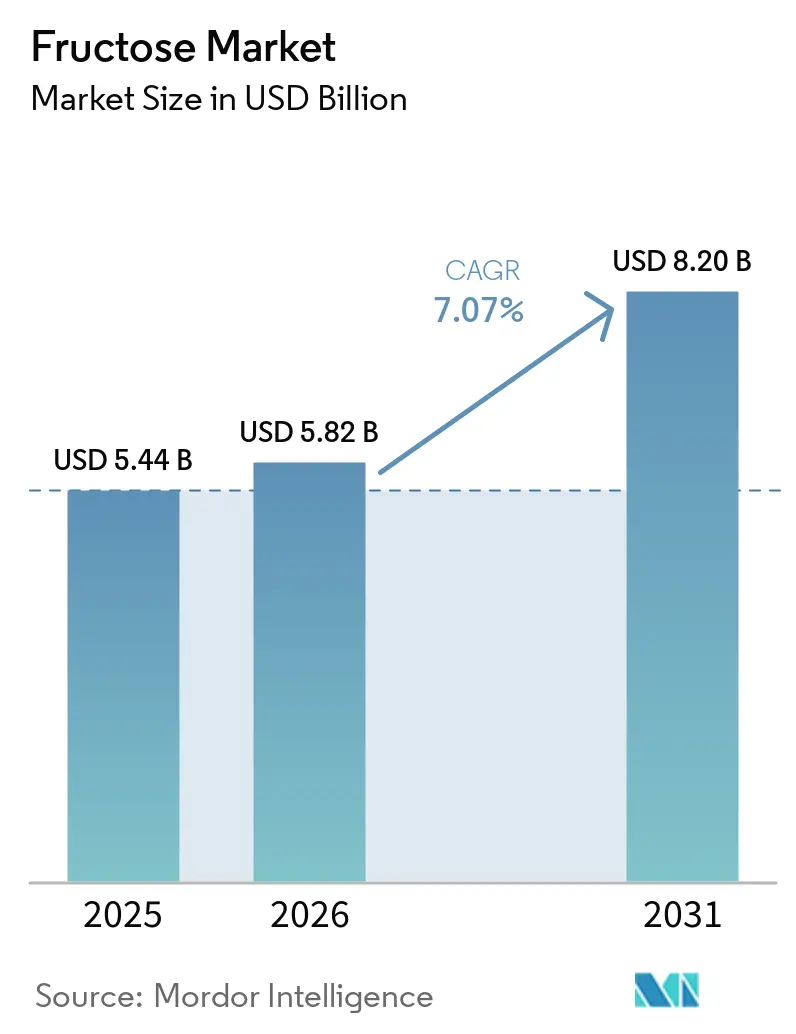
The global fructose market size is expected to grow from USD 5.44 billion in 2025 to USD 5.82 billion in 2026 and is forecast to reach USD 8.20 billion by 2031 at 7.07% CAGR over 2026-2031. The global fructose market is undergoing a significant transformation driven by cost advantages, evolving consumer preferences, and strategic shifts by ingredient manufacturers. Food producers are increasingly adopting fructose due to its higher sweetness efficiency, while the growing penetration of processed foods in emerging markets continues to fuel demand. Corn-derived fructose, particularly High Fructose Corn Syrup (HFCS), remains a cornerstone of supply chains, supported by established infrastructure and trade networks. However, leading companies are restructuring their portfolios, divesting commodity-based units, and prioritizing specialty ingredients with higher value potential. Crystalline fructose is emerging as a premium product, supported by advancements in production technologies. Despite these opportunities, the market faces challenges from regulatory measures, such as sugar taxes, and health concerns linking high fructose consumption to metabolic disorders. Nevertheless, substitution risks are mitigated by barriers to alternatives like D-allulose. Overall, the fructose market reflects a dynamic interplay of cost efficiency, expanding applications, and regulatory pressures, positioning it as a resilient yet contested ingredient within the global food industry.
Key Report Takeaways
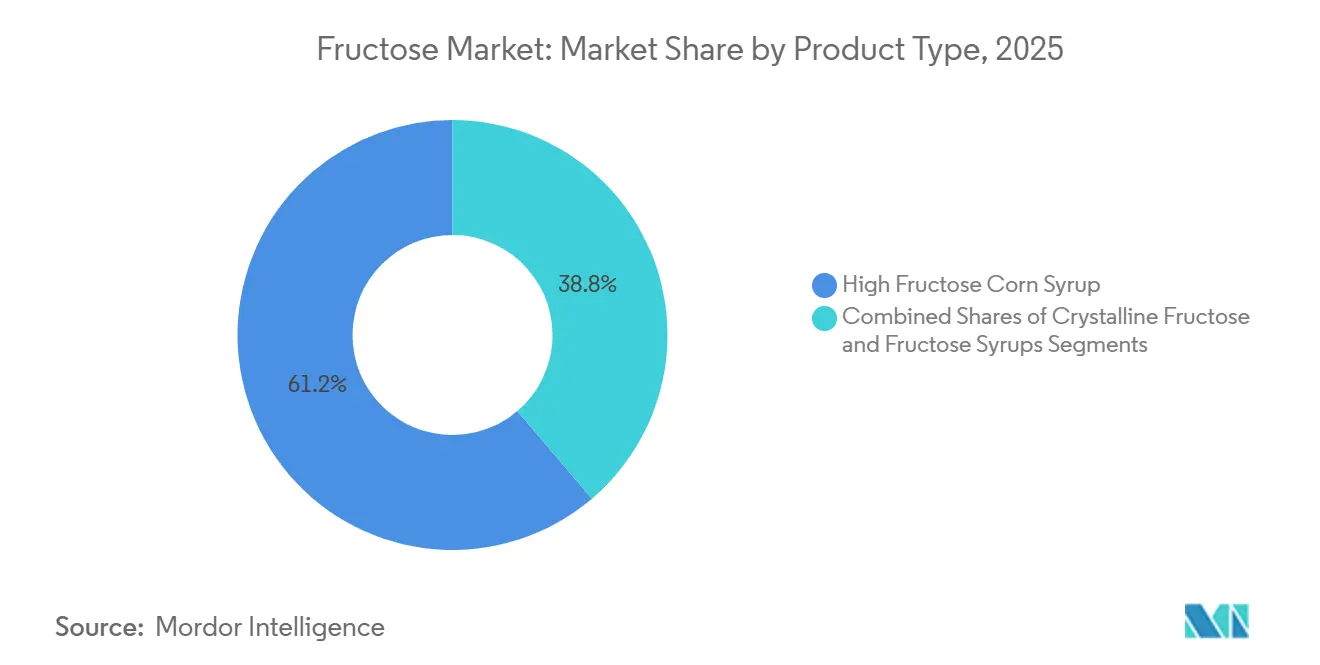
- By product type, high fructose corn syrup controlled 61.23% of the fructose market share in 2025, whereas crystalline fructose is projected to expand at a 6.56% CAGR through 2031.
- By source, corn starch contributed 68.45% of the 2025 share; sugarcane and sugar beet derivatives are expected to grow at a 7.11% CAGR during 2026-2031.
- By application, beverages accounted for 72.14% of the 2025 share; dairy and frozen desserts are forecast to record a 7.67% CAGR to 2031.
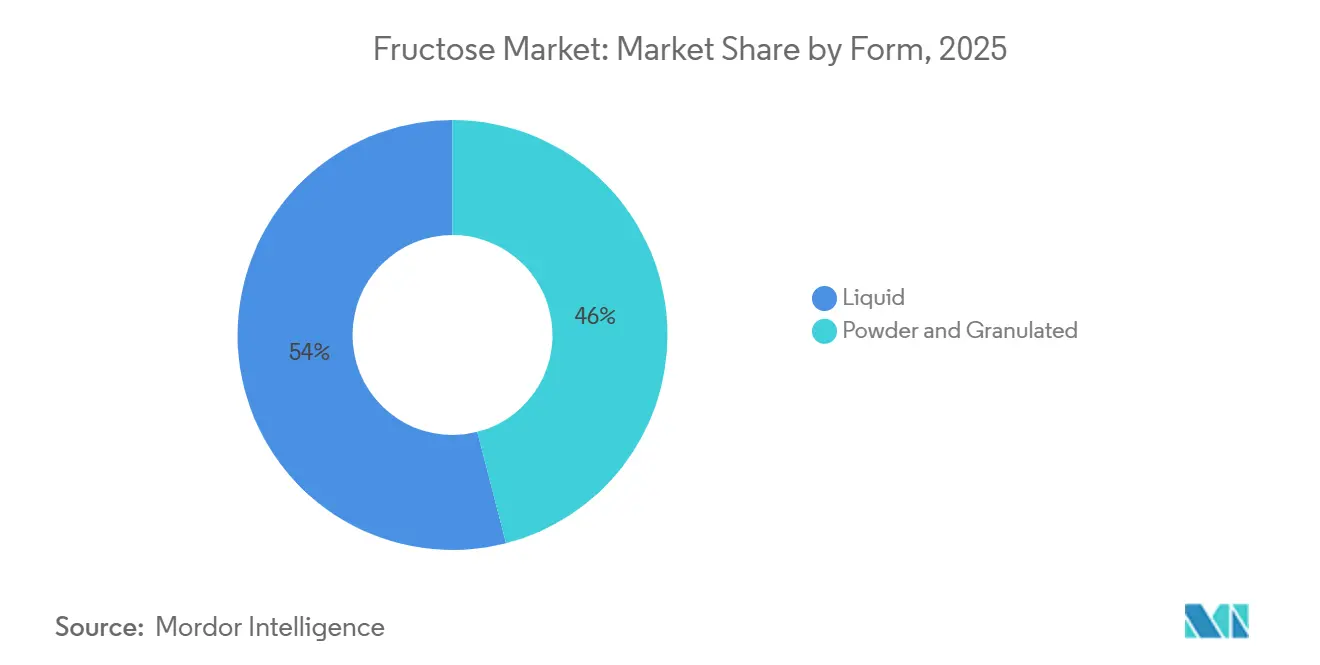
- By form, liquid fructose held 54.00% of share in 2025, while powder/granulated formats should post a 6.78% CAGR over the outlook period.
- By geography, North America led with 41.56% share in 2025; Asia-Pacific is advancing at a 6.88% CAGR to 2031.
Note: Market size and forecast figures in this report are generated using Mordor Intelligence’s proprietary estimation framework, updated with the latest available data and insights as of January 2026.
Global Fructose Market Trends and Insights
Drivers Impact Analysis*
| Drivers | (~) % Impact on CAGR Forecasts | Geographic Relevance | Impact Timeline |
|---|---|---|---|
| Low-calorie sweetener demand surge | +2.8% | Global, strongest in North America and Western Europe | Short term (≤ 2 years) |
| Favorable corn economics for HFCS | +1.9% | North America, spill-over to Mexico and Asia-Pacific | Medium term (2–4 years) |
| Functional beverage proliferation | +2.0% | North America, Asia-Pacific core, spill-over to Middle East & Africa | Short term (≤ 2 years) |
| Emerging-market processed-food boom | +2.3% | Asia-Pacific core, Latin America | Medium term (2–4 years) |
| Inulin-to-fructose biorefinery scale-up | +0.7% | Europe, Latin America, Russia | Medium term (2–4 years) |
| Continuous crystallization cost breakthrough | +0.6% | Global, concentrated in North America and Asia-Pacific | Long term (≥ 4 years) |
| Source: Mordor Intelligence | |||
Low-calorie sweetener demand surge: reformulation tailwinds benefit fructose selectively
The global fructose market is being driven by the increasing demand for low-calorie sweeteners, as health-conscious consumers prioritize reducing sugar intake. This shift is compelling brands to reformulate their products to meet evolving preferences. In January 2026, ADM demonstrated its commitment to this trend by investing USD 26 million in an Erlanger reformulation facility. According to a 2024 ADM survey, 83% of global consumers are actively avoiding or reducing sugar consumption. This consumer behavior is pressuring companies to deliver sweetness with fewer calories, positioning fructose as a critical ingredient. Crystalline fructose, with its higher sweetness intensity than sucrose, enables manufacturers to reduce sugar content while maintaining flavor, making it particularly appealing for premium food products. Concurrently, liquid fructose is gaining traction in pharmaceutical and nutraceutical applications due to its lower glycaemic index, which supports controlled-carbohydrate formulations. In addition, the implementation of sugar limits in child nutrition programs, which will restrict breakfast cereals to 6 grams of added sugar per dry ounce by the 2025-2026 school year, is creating additional demand for alternative sweeteners, according to Federal Register data [1]Source: Federal Register, "Child Nutrition Programs: Meal Patterns Consistent With the 2020-2025 Dietary Guidelines for Americans", www.federalregister.gov. This market dynamic has created a divergence in demand: commodity HFCS is facing increased scrutiny and declining popularity, while specialty fructose formats, such as crystalline fructose and customized syrups, are emerging as essential components in the development of healthier, reformulated products. The focus extends beyond sugar reduction to leveraging fructose’s functional versatility to align with changing consumer expectations, regulatory requirements, and the broader industry shift toward health-focused product innovation.
Favorable corn economics for HFCS: supply-chain depth anchors cost position
The global fructose market is driven by the cost advantages of corn-derived HFCS, which positions it as a more economical sweetener compared to refined cane sugar. This cost efficiency is further supported by a well-integrated supply chain, where HFCS production is closely tied to domestic corn utilization and benefits from subsidies that stabilize input costs. Additionally, HFCS offers logistical advantages due to its liquid form, enabling direct delivery to production lines and reducing operational complexities for food and beverage manufacturers. The resilience of this supply chain is evident in markets such as Mexico, where HFCS acts as a dependable substitute during sugar production shortages, and in the United States, where established infrastructure reinforces its role as a leading producer and exporter. According to the OECD-FAO Agricultural Outlook 2025–2034, global HFCS consumption will remain concentrated in a few high-volume markets, with the United States maintaining its dominant position as a producer and exporter[3]Source: Organisation for Economic Co-operation and Development, "OECD‑FAO Agricultural Outlook 2025‑2034", oecd.org. These structural advantages ensure HFCS remains competitive, driving demand across high-volume applications despite shifting consumer preferences.
Functional beverage proliferation: sports and energy drinks create a technical-grade demand layer
The functional beverage market is driving a shift in fructose demand by introducing a technical-grade application that extends beyond traditional sweetening purposes. Sports and energy drink manufacturers are increasingly adopting precisely balanced glucose-fructose formulations to enhance energy absorption and release during physical activity. This approach highlights the growing importance of crystalline fructose and specialty syrups over standard sweeteners. Fructose's ability to enhance both taste and energy delivery provides it with a competitive advantage in the sports nutrition market, distinguishing it from pure glucose. Additionally, electrolyte drinks showcase fructose's versatility by integrating it into complex formulations that meet both functional and sensory requirements. As functional beverages continue to outperform traditional carbonated drinks, they are expanding fructose's application scope and driving higher-value demand, thereby improving overall market revenue quality. The growth of performance-focused beverages positions fructose as a key enabler of innovation in modern nutrition, reinforcing its relevance in a market defined by health, endurance, and premium product formulations.
Emerging-market processed-food boom: Asia-Pacific and Latin America drive multi-year volume
Urbanization and a growing middle class in Asia-Pacific and Latin America are driving a surge in demand for processed and packaged foods. This trend is directly increasing the demand for fructose, a key sweetening ingredient. In China, favorable corn economics are supporting the adoption of High Fructose Corn Syrup (HFCS). China's production of starch-based sugar, including fructose syrup, reached 17 million metric tons in 2024, indicating significant demand for sweetening ingredients, according to the United States Department of Agriculture[2]Source: United States Department of Agriculture, "Sugar Annual", www.fas.usda.gov. At the same time, India's expanding maize processing capacity reflects significant upstream investment to meet the rising demand for sweeteners. In Latin America, tighter sugar availability due to crop allocations toward non-food uses has enhanced HFCS's competitiveness within the region's food manufacturing sector. These developments highlight the dietary transitions in emerging markets and the evolving dynamics of supply chains, creating a sustained growth trajectory for fructose. This trend not only strengthens fructose's integration into the changing processed-food landscape but also drives global producers to expand their presence in these rapidly transforming regions. This momentum underscores fructose's dual role as a cost-effective ingredient and a strategically important component in the modernization of food systems across developing economies.
Restraint Impact Analysis*
| Restraints | (~) % Impact on CAGR Forecasts | Geographic Relevance | Impact Timeline |
|---|---|---|---|
| Sugar taxes and labeling pressures | -1.5% | North America, Western Europe; early gains in specific United States and United Kingdom | Short term (≤ 2 years) |
| Health-risk perception (metabolic disorders) | -1.8% | Global, strongest in North America & Northwest Europe | Medium term (2–4 years) |
| Regulatory HFCS blend-ratio caps | -0.9% | European Union; compliance influence extending to export-oriented processors | Long term (≥ 4 years) |
| Rise of rare-sugar alternatives (e.g., allulose) | -1.1% | North America (Food and Drug Administration-cleared); European Union blocked near-term | Medium term (2–4 years) |
| Source: Mordor Intelligence | |||
Sugar taxes and labeling pressures: fragmented regulation creates asymmetric market impact
Global fructose markets are experiencing significant challenges due to increasing sugar taxes and stricter labeling mandates, with impacts varying across products and regions. In the United States, new excise tax proposals specifically target sugary beverages, while European regulations are intensifying labeling requirements for juice formulations. Indiana's proposed legislation to prohibit high fructose corn syrup (HFCS) in food and beverages by July 2025 indicates a growing trend of restrictive state-level regulations. The Philippines has increased HFCS import clearance fees from PHP 1.50 to PHP 30 per 50-kilogram bag, demonstrating how regulatory changes can impact market access. These regulatory changes are particularly burdensome for beverage manufacturers heavily reliant on High Fructose Corn Syrup (HFCS). The updated rules not only drive up reformulation costs but also complicate operations for companies managing diverse regional regulations. While businesses focused on domestic markets may face fewer immediate effects, export-oriented companies encounter greater risks. This fragmented regulatory environment is disrupting HFCS-dependent sectors and reshaping the global fructose market's economic dynamics. As these policies continue to evolve, they are driving reformulation trends and encouraging producers to adopt more diversified sweetener strategies.
Health-risk perception: metabolic evidence creates durable demand headwinds
Studies have consistently linked excessive fructose intake to various health issues, including hepatic fat accumulation, insulin resistance, and features of metabolic syndrome. Concerns are also emerging about its potential connections to cancer and dementia. Research indicates that even moderate consumption of beverages high in high-fructose corn syrup (HFCS) can lead to rapid metabolic changes. This has intensified scrutiny on fructose's role in modern diets. Additionally, the increasing adoption of GLP-1 weight-loss medications introduces another layer of complexity. As these medications impact appetite regulation, they could drive a broader decline in the consumption of fructose-containing products. Collectively, these scientific findings and therapeutic trends are reshaping consumer behavior and altering the long-term demand forecast for fructose. This alignment of clinical research and pharmaceutical trends highlights the growing influence of health science on the future trajectory of the fructose industry.
*Our forecasts treat driver/restraint impacts as directional, not additive. The impact forecasts reflect baseline growth, mix effects, and variable interactions.
Segment Analysis
By Product Type: Crystalline Fructose Reshaping the Premium Tier
In 2025, High-Fructose Corn Syrup (HFCS) commanded a dominant 61.23% share of the global fructose market. This stronghold is rooted in the United States long-established wet-milling infrastructure and the widespread adoption of HFCS-55 in mainstream carbonated drinks, bolstered by its cost efficiency and robust supply chain. Major producers, capitalizing on economies of scale, are consolidating the segment, ensuring HFCS's continued prominence in high-volume applications, even amidst rising regulatory and health scrutiny. This deep-seated position cements HFCS's status as the cornerstone of the fructose market, allowing it to maintain its leading share despite shifting consumer preferences.
In contrast, crystalline fructose is on a rapid ascent, projected to grow at a 6.56% CAGR through 2031, carving out a niche in the market's premium segment. Its swift uptake in pharmaceutical excipients, controlled-carbohydrate sports nutrition, and high-end confectionery highlights a preference for its precise sweetness and solubility, often overshadowing cost concerns. Innovations like high-purity separation systems are not only reducing production hurdles but also enhancing profit margins. Meanwhile, specialty syrups and solids are finding their place as intermediates in bakery and dairy uses. This momentum positions crystalline fructose at the forefront of market innovation, drawing significant investment and shifting the market's value dynamics towards more lucrative, specialized applications.


By Source: Corn Starch Dominance Tested by Inulin and Sugarcane Alternatives
In 2025, corn starch dominated global fructose production, accounting for 68.45% of the total output. This dominance is anchored in the United States and China, where a well-established wet-milling infrastructure has bolstered supply chains and ensured cost efficiency. While corn starch's lead in the market appears structurally sound, it is increasingly facing challenges. Food companies are diversifying their feedstocks, driven by reformulation trends and a consumer push for alternative labeling. Thus, even as corn starch remains the backbone of fructose supply, shifting market dynamics are putting its exclusive position to the test.
On the other hand, sugarcane and sugar beet are emerging as the fastest-growing sources, boasting a 7.11% CAGR through 2031. Producers in Latin America are capitalizing on cane-derived sucrose inversion, marketing fructose as a natural label alternative. This move is particularly appealing to brands eager to distance themselves from corn-derived inputs. Simultaneously, inulin and chicory root are carving out a niche, bolstered by enzyme efficiency gains that enhance the commercial viability of biorefineries. These advancements are producing syrups with high fructose content, qualifying them as natural sweeteners. While fruit and honey play a smaller role, they command a premium in health-centric markets where the source's provenance is paramount. Together, these trends underscore a significant shift: alternative sources are not just growing but are becoming pivotal in driving innovation within the global fructose market.
By Application: Beverages Dominant, but Dairy and Frozen Desserts Signal Mix Shift
In 2025, beverages dominated the global fructose market, accounting for 72.14% of demand. This stronghold underscores the deep-rooted incorporation of High-Fructose Corn Syrup (HFCS) in a range of drinks, from carbonated soft drinks and juices to functional beverages like sports and energy drinks. Despite beverages being the cornerstone of fructose consumption, signs of a slowdown are emerging, especially in mature markets where per-capita HFCS consumption is on the decline. Yet, with a diverse array of beverage categories and a foundational reliance on fructose for both sweetness and formulation stability, this segment remains pivotal to the overall market demand.
On the other hand, dairy and frozen desserts are witnessing the fastest growth, projected to expand at a 7.67% Compound Annual Growth Rate (CAGR) from 2026 to 2031. Fructose offers distinct technical advantages: it lowers the freezing point in ice cream mixes, enhances moisture retention, and provides a sweeter taste at reduced quantities. These benefits position fructose as a preferred choice over sucrose in frozen products. This advantage is fueling its adoption in premium dessert lines and innovative dairy offerings. Meanwhile, while the bakery and confectionery sectors maintain steady contributions, pharmaceutical applications command higher unit-price premiums. Together, these trends indicate a market shift, with growth gravitating towards sectors where fructose's functional advantages offer added value beyond mere cost savings.
By Form: Liquid Form Ubiquitous, Powder Premiumization Accelerating
In 2025, liquid fructose dominated the global market, capturing 54% of the market share. This stronghold is largely due to the operational ease it provides to major beverage and food processors. The direct delivery via tankers not only simplifies logistics but also underscores High Fructose Corn Syrup's advantage over granular sucrose. Such widespread use solidifies liquid fructose's position as the primary industrial sweetener, especially in mainstream beverages, even as the market starts to pivot towards more premium formats.
On the other hand, powdered and granulated fructose are emerging as the market's fastest-growing segments, boasting a 6.78% CAGR projected through 2031. This surge is fueled by the needs of the pharmaceutical and nutraceutical sectors, which prioritize precise dosages, dry blending, and ambient storage. Additionally, retail health food channels are witnessing crystalline fructose fetching premium prices in specialty stores. Backed by peer-reviewed studies highlighting its benefits in sports and electrolyte nutrition, the demand for powdered fructose is on the rise. This positions it as a premium choice, aligning with the industry's shift towards higher-margin, specialized applications. Such trends indicate a market rebalancing, with powdered forms driving premiumization and enhancing the overall value of the fructose sector.
Geography Analysis
In 2025, North America dominated the global fructose market, capturing a 41.56% share of worldwide demand. The United States solidifies this lead with its robust Corn Belt wet-milling cluster, where High Fructose Corn Syrup (HFCS) is seamlessly woven into the corn supply chain, bolstering its defense against input price fluctuations. Mexico plays a pivotal role as a secondary demand hub, leveraging HFCS's cost advantages, especially during sugar harvest shortages. Canada, alongside other North American territories, ensures consistent demand in the bakery, confectionery, and dairy sectors.
In contrast, the Asia-Pacific region is on a rapid ascent, forecasted to grow at a 6.88% CAGR until 2031. This surge is fueled by an expanding food-processing sector and swift urban dietary shifts, with China poised to lead in global HFCS consumption growth. India emerges as a vibrant market, bolstered by aggressive maize processing expansions that fortify its sweetener supply chains. While Japan and South Korea, as mature markets, see stable per-capita HFCS consumption, they also witness a sustained demand for specialty fructose, driven by functional beverages and premium dairy. As packaged food becomes more entrenched, Australia and the wider Asia-Pacific region bolster this growth narrative, establishing the area as a pivotal player in the future of fructose demand.
Beyond these primary players, Europe, South America, and the Middle East and Africa weave their own distinct tales in the fructose landscape. Europe grapples with regulatory constraints that hinder HFCS's competitiveness against sugar, resulting in subdued consumption. In South America, Brazil and Argentina capitalize on limited sugar supplies, boosting fructose's appeal in food production. The Middle East and Africa, predominantly reliant on imports, spotlight Saudi Arabia, the United Arab Emirates (UAE), and South Africa as central demand centers, bolstered by nascent local processing ventures aligned with food diversification initiatives. Collectively, these regions underscore the intricate dance of regulatory, agricultural, and supply-chain factors shaping the global fructose market, with North America setting the stage, Asia-Pacific leading the charge, and other regions carving out specialized niches.

Competitive Landscape
In the global fructose market, a moderately concentrated competitive landscape has emerged. The leading players, namely Archer Daniels Midland (ADM), Cargill, Ingredion, Roquette Frères, and Primient, among others, command the majority of the high-fructose corn syrup (HFCS) volumes. A notable trend is the bifurcation of strategies: major integrated ingredient firms are stepping back from commodity HFCS, redirecting their investments towards specialty sweeteners, clean-label alternatives, and bioconversion technologies. For instance, Tate and Lyle's divestiture of Primient, followed by its launch of bioconverted stevia, underscores a shift from volume-centric HFCS to margin-focused sugar-reduction solutions. Meanwhile, ADM's investments in innovation highlight its dual focus: maintaining a robust wet-milling scale while pushing for next-generation ingredient platforms.
Emerging opportunities lie in niche yet lucrative sectors. In Europe, inulin-based fructose biorefineries are capitalizing on the availability of chicory root and a regulatory tilt towards natural, non-genetically modified organism (non-GMO) inputs, bolstering their clean-label appeal. Another promising domain is the pharmaceutical and nutraceutical sector, where the demand for high-purity crystalline fructose is outstripping the capacity of validated Good Manufacturing Practice (GMP) facilities. This gap presents a lucrative opportunity for players who can enhance their purification infrastructure. Meanwhile, mid-tier Asian producers like Daesang, Xiwang Sugar, and Baolingbao Biology are ramping up domestic capacities, catering to regional beverage and food sectors, and increasingly challenging United States HFCS prices in export arenas.
In the forecasted period, the competitive landscape will pivot from battles over HFCS volumes to a focus on securing the high-purity fructose tier, which commands premium prices in pharmaceuticals, sports nutrition, and upscale dairy products. Patent activities surrounding chromatographic separation technologies indicate that established players are fortifying their positions in crystalline fructose. At the same time, there is a noticeable influx of innovation capital into differentiated sweetener platforms. The strategic takeaway is evident: the future frontrunners in the fructose arena will be those adept at transitioning from a commodity-centric approach to one centered on specialty innovations, thereby reaping rewards in segments where attributes like purity, functionality, and clean-label status take precedence over mere cost efficiency.
Fructose Industry Leaders
-
Archer Daniels Midland Company
-
Cargill Inc.
-
Tate and Lyle Plc
-
Ingredion Incorporated
-
Roquette Freres S.A.
- *Disclaimer: Major Players sorted in no particular order

Recent Industry Developments
- February 2025: Avantium N.V., headquartered in Delfzijl, The Netherlands, achieved a significant milestone at its FDCA (Furandicarboxylic Acid) Flagship Plant. The company has successfully loaded its first-ever volumes of High Fructose Syrup (HFS) into the plant's storage tanks. This HFS, sourced from Tereos, Avantium's feedstock partner, comes as the company prepares for the plant's imminent start-up.
- June 2024: Fooditive Group, a pioneering Dutch producer of plant-based ingredients, is positioned to transform the United States food and beverage industry with its innovative sweetener, Keto-Fructose (5-keto-D-fructose). Currently undergoing the Food and Drug Administration's Generally Recognized as Safe evaluation, this state-of-the-art sugar alternative promises to set a new standard in sugar substitutes, offering unparalleled taste, functionality, and sustainability.
- June 2024: To address the growing demand for fructose, Galam, a leading supplier of fructose, entered into a strategic partnership with Tat Nissata, a prominent starch manufacturer based in Turkey. As part of this collaboration, Tat Nissata has initiated the construction of a new fructose production plant.


Global Fructose Market Report Scope
Fructose is a naturally occurring simple sugar, classified as a monosaccharide, found in fruits, honey, and some vegetables. It is one of the three primary dietary sugars alongside glucose and galactose, and is known for its high relative sweetness and rapid absorption.
The global fructose market is segmented by product type, source, application, form, and geography. By product type, the market is segmented into High Fructose Corn Syrup, Crystalline Fructose, and Fructose Syrups/Solids. By source, the market is segmented into Corn Starch, Sugarcane and Sugar Beet, Inulin and Chicory Root, and Others. By application, the market is segmented into Beverages, Bakery and Confectionery, Dairy, and Frozen Desserts. Pharmaceuticals and Nutraceuticals, Personal Care and Cosmetics, and Animal Nutrition. By form, the market is segmented into Liquid, Powder, and Granulated. By geography, the market is segmented into North America. Europe, Asia-Pacific, South America, the Middle East, and Africa. The market size is provided in terms of value (USD).
| High Fructose Corn Syrup |
| Crystalline Fructose |
| Fructose Syrups/Solids |
| Corn Starch |
| Sugarcane and Sugar Beet |
| Inulin/Chicory Root |
| Othes |
| Beverages | Carbonated Soft Drinks |
| Juice and Nectar | |
| Sports and Energy Drinks | |
| Others | |
| Bakery and Confectionery | |
| Dairy and Frozen Desserts | |
| Pharmaceuticals and Nutraceuticals | |
| Personal Care and Cosmetics | |
| Animal Feed |
| Liquid |
| Powder/Granulated |
| North America | United States |
| Canada | |
| Mexico | |
| Rest of North America | |
| Europe | Germany |
| United Kingdom | |
| Italy | |
| France | |
| Spain | |
| Netherlands | |
| Rest of Europe | |
| Asia-Pacific | China |
| India | |
| Japan | |
| Australia | |
| Rest of Asia-Pacific | |
| South America | Brazil |
| Argentina | |
| Rest of South America | |
| Middle East and Africa | South Africa |
| Saudi Arabia | |
| Rest of Middle East and Africa |
| By Product Type | High Fructose Corn Syrup | |
| Crystalline Fructose | ||
| Fructose Syrups/Solids | ||
| By Source | Corn Starch | |
| Sugarcane and Sugar Beet | ||
| Inulin/Chicory Root | ||
| Othes | ||
| By Application | Beverages | Carbonated Soft Drinks |
| Juice and Nectar | ||
| Sports and Energy Drinks | ||
| Others | ||
| Bakery and Confectionery | ||
| Dairy and Frozen Desserts | ||
| Pharmaceuticals and Nutraceuticals | ||
| Personal Care and Cosmetics | ||
| Animal Feed | ||
| By Form | Liquid | |
| Powder/Granulated | ||
| Geography | North America | United States |
| Canada | ||
| Mexico | ||
| Rest of North America | ||
| Europe | Germany | |
| United Kingdom | ||
| Italy | ||
| France | ||
| Spain | ||
| Netherlands | ||
| Rest of Europe | ||
| Asia-Pacific | China | |
| India | ||
| Japan | ||
| Australia | ||
| Rest of Asia-Pacific | ||
| South America | Brazil | |
| Argentina | ||
| Rest of South America | ||
| Middle East and Africa | South Africa | |
| Saudi Arabia | ||
| Rest of Middle East and Africa | ||


Key Questions Answered in the Report
What is the current size of the global fructose market?
The global fructose market size stood at USD 5.82 billion in 2026.
What CAGR is forecast for the fructose market through 2031?
Industry projections indicate a 7.07% CAGR between 2026 and 2031.
Which product type holds the largest share of the fructose market?
High fructose corn syrup led with 61.23% of the 2025 market share.
Which region is expected to grow the fastest in the fructose market?
Asia-Pacific is forecast to expand at a 6.88% CAGR through 2031.
Page last updated on:


