GCC Fruit And Vegetable Market Analysis by Mordor Intelligence
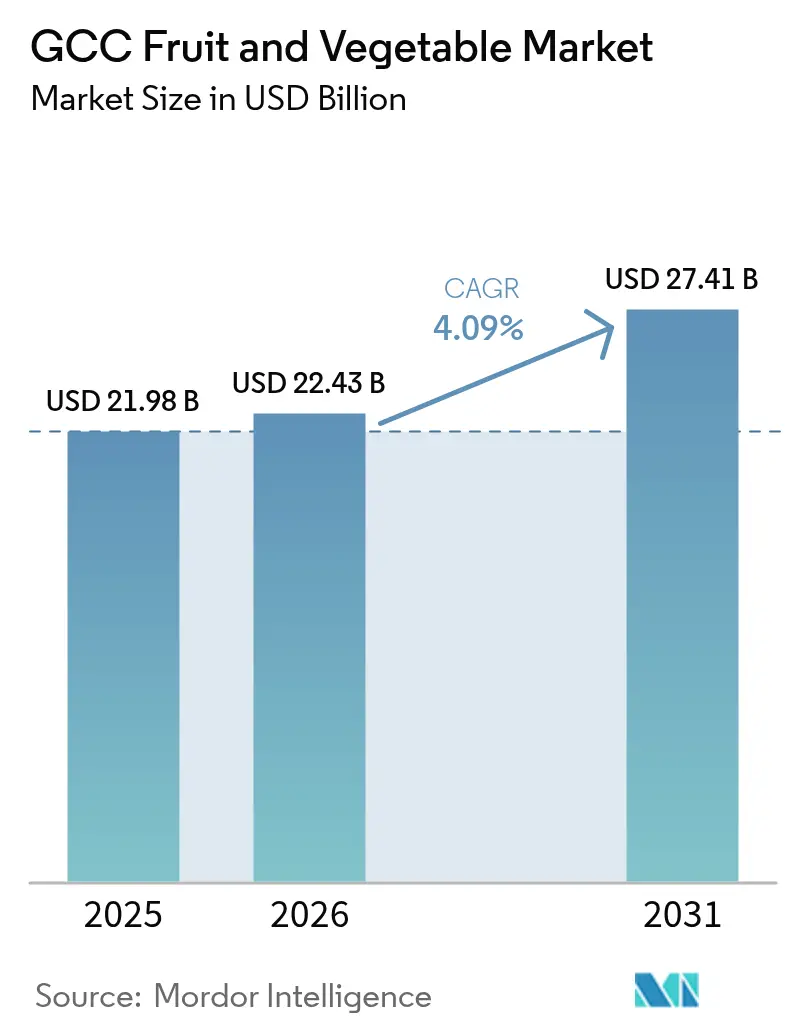
The GCC fruit and vegetable market size is projected to increase from USD 21.98 billion in 2025 to USD 22.43 billion in 2026 and reach USD 27.41 billion by 2031, growing at a CAGR of 4.09% over 2026-2031. Expanding protected-cultivation acreage, sovereign food-security funds, and dual-use agri-voltaic projects are raising domestic output and lowering post-harvest losses. Sovereign mandates to lift self-sufficiency have unlocked capital for climate-controlled greenhouses, hydroponics, and vertical farms, while desalination-brine valorization is trimming fertilizer import bills. Consumption targets of 400 grams per person per day are accelerating premiumization, and retail chains are carving out shelf space for locally grown produce. Competitive intensity remains moderate, yet technology adoption, artificial-intelligence climate optimization, Internet of Things fertigation control, and blockchain traceability are widening the gap between integrated operators and smallholders.
Key Report Takeaways
- By geography, Saudi Arabia led with 41.6% of the GCC fruit and vegetable market share in 2025, while the United Arab Emirates is forecast to expand at a 5.0% CAGR through 2031.
Note: Market size and forecast figures in this report are generated using Mordor Intelligence’s proprietary estimation framework, updated with the latest available data and insights as of 2026.
GCC Fruit And Vegetable Market Trends and Insights
Drivers Impact Analysis*
| Driver | (~) % Impact on CAGR Forecast | Geographic Relevance | Impact Timeline |
|---|---|---|---|
| Expanding protected cultivation acreage | +0.6% | Saudi Arabia, United Arab Emirates, and Qatar | Medium term (2-4 years) |
| Government food-security funds for desert agriculture | +0.5% | All six Gulf Cooperation Council states | Long term (≥ 4 years) |
| Agri-voltaic projects monetizing dual land use | +0.5% | United Arab Emirates, Saudi Arabia, and Oman | Medium term (2-4 years) |
| Increasing per-capita fruit and vegetable intake targets | +0.6% | All six Gulf Cooperation Council states | Long term (≥ 4 years) |
| Surplus desalination brine valorized for fertigation | +0.3% | Saudi Arabia, United Arab Emirates, and Kuwait | Short term (≤ 2 years) |
| Proven yield gains from hydroponics and vertical farms | +0.4% | United Arab Emirates, Qatar, and Bahrain | Short term (≤ 2 years) |
| Source: Mordor Intelligence | |||


Expanding Protected-Cultivation Acreage
Protected agricultural structures expanded significantly by the end of 2025, with a notable increase from the previous year, as farmers prioritized safeguarding crops from extreme summer temperatures that often exceed 45 degrees Celsius. The use of greenhouses has proven effective in extending growing seasons by several months and significantly reducing water consumption, particularly in regions with limited renewable freshwater resources. During this period, Qatar made substantial progress by commissioning additional protected structures, which contributed to a considerable improvement in its vegetable self-sufficiency. Similarly, the AgTech Park initiative in the United Arab Emirates set ambitious production goals to address a portion of Abu Dhabi's vegetable demand.
Government Food-Security Funds for Desert Agriculture
The United Arab Emirates is making significant investments in food security through strategic funds, aiming to become a global leader by 2051. The United Arab Emirates launched the National Strategy for Food Security in 2024, aiming to position the country as the best in the Global Food Security Index by 2051. This strategy focuses on developing a comprehensive national system to enable sustainable food production through modern technologies and enhanced local production[1]Source: Government of the United Arab Emirates, “UAE Food Security Strategy 2051,” u.ae. Qatar’s updated strategy aims to achieve 70% local leafy-green supply by 2030. These investments address long payback periods, secure long-term renewable power contracts, and require GlobalG.A.P. compliance as a financing condition. Consequently, capital-intensive facilities are scaling up more rapidly, advancing the GCC fruit and vegetable market toward improved quality standards.
Increasing Per-Capita Fruit and Vegetable Intake Targets
The nutrition campaigns in the United Arab Emirates and Saudi Arabia aim to increase annual consumption of fruits and vegetables, thereby driving demand for fresh produce. In 2024, the Ministry of Health and Prevention (MoHAP) launched a nutrition-focused awareness campaign to improve community health by encouraging the inclusion of fruits and vegetables in daily diets. The campaign was conducted across the United Arab Emirates, providing practical guidance on incorporating essential fruits and vegetables into regular meals and addressing challenges such as affordability, availability, and time constraints that hinder healthy eating[2]Source: Ministry of Health and Prevention, "MoHAP concludes nationwide campaign to boost health with fruits and vegetables," mohap.gov.ae. Saudi Arabia introduced origin labels in 2025 that favor greenhouse produce over imports. Retailers Lulu Hypermarket and Carrefour responded by expanding local-product aisles, mirroring the growth of the GCC fruit and vegetable market.
Surplus Desalination Brine Valorized for Fertigation
In 2025, a significant volume of reject brine was generated, amounting to billions of cubic meters. The Saudi utility company Marafiq undertook mineral extraction at its Jubail facility, contributing to a notable reduction in the country's reliance on imported fertilizers. During the same year, the United Arab Emirates committed substantial financial resources to upgrading multiple plants, with the objective of achieving a considerable production of nutrient salts within a few years. The Gulf Cooperation Council Standardization Organization has introduced a classification system that designates these inputs as organic, provided their heavy-metal concentration remains within permissible limits. The practice of reusing brine helps minimize marine discharge, significantly reduces fertilizer costs, and supports the objectives of Sustainable Development Goal Twelve, thereby creating a positive impact on the fruit and vegetable market in the GCC region.
Restraints Impact Analysis*
| Restraint | (~) % Impact on CAGR Forecast | Geographic Relevance | Impact Timeline |
|---|---|---|---|
| Shrinking groundwater reserves in arid regions | −0.7% | Saudi Arabia, Oman, and Kuwait | Long term (≥ 4 years) |
| Volatile energy prices inflating controlled-environment costs | −0.5% | All six Gulf Cooperation Council states | Short term (≤ 2 years) |
| High salinity drift clogging drip lines | −0.3% | United Arab Emirates, Bahrain, and Kuwait | Medium term (2-4 years) |
| Bio-security risks from expanding seed-import channels | −0.2% | All six Gulf Cooperation Council states | Short term (≤ 2 years) |
| Source: Mordor Intelligence | |||
Volatile Energy Prices Inflating Controlled-Environment Costs
Fluctuating energy prices are significantly increasing the operating costs of controlled-environment (CE) sectors, including vertical farming and greenhouse agriculture. High energy consumption, coupled with unpredictable spikes in electricity and natural gas prices, is raising operational expenses, impacting profitability, and complicating long-term planning for these energy-intensive industries. In 2024, commercial tariffs in the United Arab Emirates increased by 25%, with cooling and lighting accounting for up to 40% of greenhouse operating expenses. In Saudi Arabia, peak-hour surcharges rose by 15% during the summer of 2025. Controlled-environment facilities require 150-250 kilowatt-hours per square meter annually, putting margin pressure on operators lacking on-site solar energy solutions. Brent crude prices fluctuated between USD 70 and USD 95 per barrel in 2025, impacting subsidy levels. These cost increases have delayed capacity expansions and shifted focus toward retrofitting, thereby moderating growth in the GCC fruit and vegetable market.
High Salinity Drift Clogging Drip Lines
Electrical conductivity levels ranging from 4 to 16 deciSiemens per meter affect 60-80% of cultivated land. In 2025, 40% of drip irrigation systems in the United Arab Emirates required unscheduled maintenance due to salt deposits. Desalinated water continues to contain boron and chloride, which accumulate during high-frequency fertigation. Bahrain has mandated soil testing every six months, increasing the significant compliance cost[3]Source: Ministry of Works Bahrain, “Soil Salinity Testing Rules,” works.gov.bh. While reverse-osmosis pre-treatment and salt-tolerant rootstocks are available, their adoption remains low, limiting growth in certain segments of the GCC fruit and vegetable market.
*Our forecasts treat driver/restraint impacts as directional, not additive. The impact forecasts reflect baseline growth, mix effects, and variable interactions.
Geography Analysis
Saudi Arabia was the largest geographic segment, accounting for 41.6% of the GCC fruit and vegetable market share in 2025. According to the Ministry of Environment, Water, and Agriculture, Saudi Arabia’s annual date production exceeded 1.9 million metric tons in 2023. The total number of palm trees across all regions increased to 37.1 million, of which approximately 31.8 million are fruit-bearing. Al-Qassim Province led in date production across all varieties, producing over 578,100 metric tons. The total number of palm trees in the province, including productive ones, surpassed 10.7 million. Subsidized drip irrigation upgrades have reduced water use by 70%, while aquifer drawdown of up to 5 meters annually has necessitated a shift to desalination, underscoring the need to cultivate high-value crops.
The United Arab Emirates sets the growth pace at 5.0% CAGR through 2031. AgTech Park hosts 12 ventures that produce 40 metric tons of greens annually, and Bustanica supplies 3,000 kilograms daily with zero-day inventory. Retrofitting three desalination plants to produce brine-derived nutrients reduces fertilizer imports and meets circular-economy goals. Electricity rate hikes pressured margins in 2024, but on-site solar mitigated costs, underscoring the resilience of the GCC fruit and vegetable market.
Qatar, Oman, Kuwait, and Bahrain account for the remaining market share. Qatar's National Food Security Strategy 2030 aims to achieve 55% self-sufficiency in local vegetable production. The strategy also aims to increase agricultural land productivity by 50% to meet the targeted production levels. Oman has implemented extraction quotas to reduce cultivated acreage while extending the lifespan of aquifers. Kuwait and Bahrain are piloting vertical farming techniques that reduce water usage by 90% and limit post-harvest losses to below 5%. Intraregional trade remains limited due to overlapping agricultural calendars and non-tariff barriers, with India, Egypt, and Iran continuing as the primary suppliers.
Competitive Landscape
The GCC fruit and vegetable market remains moderately concentrated. In December 2023, United Arab Emirates-based agritech company Pure Harvest Smart Farms announced the acquisition of RedSea's controlled-environment agriculture (CEA) production facility in Saudi Arabia. This acquisition includes a 6-hectare farm near Riyadh and a 40-hectare land bank, enabling Pure Harvest to expand its regional presence in the GCC. Bustanica demonstrates scale with 3,000 kilograms daily output that bypasses wholesale markets. Artificial-intelligence climate software, Internet of Things sensors, and blockchain traceability are becoming standard, widening efficiency gaps.
Opportunities exist in salt-tolerant cultivars, brine-derived fertilizers, and agri-voltaics. These innovations address challenges in arid and saline environments, enhancing agricultural sustainability and improving resource efficiency. Salt-tolerant cultivars enable farming in high-salinity soils, expanding the availability of arable land. Agri-voltaics, which combine agriculture with solar energy production, optimize land use by generating renewable energy while crops are cultivated. Masdar and Elite Agro’s Al Foah project has increased land productivity by up to 60% while producing renewable electricity, showcasing the potential of integrated solutions to address food and energy security. Saudi Arabia is pursuing 500 megawatts of agri-voltaic capacity, promoting diversified farm revenue streams, supporting the transition to renewable energy in agriculture, and contributing to the country’s broader sustainability goals.
Leafy greens and herbs are dominated by five to seven vertical farms, whereas tomatoes and cucumbers remain fragmented among hundreds of greenhouse operators. Retailers Carrefour and Lulu Hypermarket now offer shelf-space incentives for traceable local produce. Patent filings on light-spectrum optimization and climate algorithms increased in 2025, signaling intensifying innovation in the GCC fruit and vegetable market.
Recent Industry Developments
- November 2025: The Qatar Ministry of Municipality has launched the 2025/2026 seasonal vegetable markets, also known as yards for the sale of local agricultural products. Managed by the Agricultural Affairs Department, this initiative seeks to support local farmers by offering direct sales channels to consumers. The seasonal markets are located in Al Khor, Al Thakhira, Al Wakrah, Al Shamal, and Al Shahaniya.
- September 2025: Saudi Arabia’s Ministry of Environment, Water, and Agriculture (MEWA) has implemented stringent regulations for the packaging and labeling of fruits and vegetables in public markets. These measures aim to enhance food safety, quality, and sustainability in alignment with Vision 2030. The regulations mandate detailed labels in Arabic, which must include the product name, net weight, packaging date, country of origin, and supplier or producer information, such as name, logo, and registration number.
- June 2025: Fresh Del Monte has launched its Pinkglow pineapple in the United Arab Emirates market, available exclusively on Talabat Mart for six months. These specially cultivated pink-fleshed pineapples are offered in limited weekly quantities and delivered in customized packaging as a premium gift item. Grown in Costa Rica, this rare, sweeter, and less acidic fruit is positioned to redefine the luxury fruit market.


GCC Fruit And Vegetable Market Report Scope
Fruits and vegetables are essential to the human diet, as they provide essential nutrients for maintaining health. The GCC Fruit and Vegetable Market Report is Segmented by Geography (United Arab Emirates, Bahrain, Kuwait, Oman, Qatar, and Saudi Arabia). The Report Includes Production Analysis (Volume), Consumption Analysis (Value and Volume), Export Analysis (Value and Volume), Import Analysis (Value and Volume), Wholesale Price Trend Analysis and Forecast, Regulatory Framework, Seasonality Analysis, Logistics and Infrastructure, and a List of Key Players. The Market Forecasts are Provided in Terms of Value (USD) and Volume (Metric Tons).
By Geography
| United Arab Emirates | Fruits | Production Analysis | Production Volume | |
| Area Harvested and Yield | ||||
| Consumption Analysis (Value and Volume) | ||||
| Trade Analysis (Value and Volume) | Import Market Analysis | Import Value and Volume | ||
| Key Supplying Markets | ||||
| Export Market Analysis | Export Value and Volume | |||
| Key Destination Markets | ||||
| Wholesale Price Trend Analysis and Forecast | ||||
| Regulatory Framework | ||||
| Seasonality Analysis | ||||
| Logistics and Infrastructure | ||||
| List of Key Players | ||||
| Vegetables | Production Analysis | Production Volume | ||
| Area Harvested and Yield | ||||
| Consumption Analysis (Value and Volume) | ||||
| Import Value and Volume | ||||
| Key Supplying Markets | ||||
| Export Value and Volume | ||||
| Key Destination Markets | ||||
| Wholesale Price Trend Analysis and Forecast | ||||
| Regulatory Framework | ||||
| Seasonality Analysis | ||||
| Logistics and Infrastructure | ||||
| List of Key Players | ||||
| Bahrain | Fruits | Production Analysis | Production Volume | |
| Area Harvested and Yield | ||||
| Consumption Analysis (Value and Volume) | ||||
| Import Value and Volume | ||||
| Key Supplying Markets | ||||
| Export Value and Volume | ||||
| Key Destination Markets | ||||
| Wholesale Price Trend Analysis and Forecast | ||||
| Regulatory Framework | ||||
| Seasonality Analysis | ||||
| Logistics and Infrastructure | ||||
| List of Key Players | ||||
| Vegetables | Production Analysis | Production Volume | ||
| Area Harvested and Yield | ||||
| Consumption Analysis (Value and Volume) | ||||
| Import Value and Volume | ||||
| Key Supplying Markets | ||||
| Export Value and Volume | ||||
| Key Destination Markets | ||||
| Wholesale Price Trend Analysis and Forecast | ||||
| Regulatory Framework | ||||
| Seasonality Analysis | ||||
| Logistics and Infrastructure | ||||
| List of Key Players | ||||
| Kuwait | Fruits | Production Analysis | Production Volume | |
| Area Harvested and Yield | ||||
| Consumption Analysis (Value and Volume) | ||||
| Import Value and Volume | ||||
| Key Supplying Markets | ||||
| Export Value and Volume | ||||
| Key Destination Markets | ||||
| Wholesale Price Trend Analysis and Forecast | ||||
| Regulatory Framework | ||||
| Seasonality Analysis | ||||
| Logistics and Infrastructure | ||||
| List of Key Players | ||||
| Vegetables | Production Analysis | Production Volume | ||
| Area Harvested and Yield | ||||
| Consumption Analysis (Value and Volume) | ||||
| Import Value and Volume | ||||
| Key Supplying Markets | ||||
| Export Value and Volume | ||||
| Key Destination Markets | ||||
| Wholesale Price Trend Analysis and Forecast | ||||
| Regulatory Framework | ||||
| Seasonality Analysis | ||||
| Logistics and Infrastructure | ||||
| List of Key Players | ||||
| Oman | Fruits | Production Analysis | Production Volume | |
| Area Harvested and Yield | ||||
| Consumption Analysis (Value and Volume) | ||||
| Import Value and Volume | ||||
| Key Supplying Markets | ||||
| Export Value and Volume | ||||
| Key Destination Markets | ||||
| Wholesale Price Trend Analysis and Forecast | ||||
| Regulatory Framework | ||||
| Seasonality Analysis | ||||
| Logistics and Infrastructure | ||||
| List of Key Players | ||||
| Vegetables | Production Analysis | Production Volume | ||
| Area Harvested and Yield | ||||
| Consumption Analysis (Value and Volume) | ||||
| Import Value and Volume | ||||
| Key Supplying Markets | ||||
| Export Value and Volume | ||||
| Key Destination Markets | ||||
| Wholesale Price Trend Analysis and Forecast | ||||
| Regulatory Framework | ||||
| Seasonality Analysis | ||||
| Logistics and Infrastructure | ||||
| List of Key Players | ||||
| Qatar | Fruits | Production Analysis | Production Volume | |
| Area Harvested and Yield | ||||
| Consumption Analysis (Value and Volume) | ||||
| Import Value and Volume | ||||
| Key Supplying Markets | ||||
| Export Value and Volume | ||||
| Key Destination Markets | ||||
| Wholesale Price Trend Analysis and Forecast | ||||
| Regulatory Framework | ||||
| Seasonality Analysis | ||||
| Logistics and Infrastructure | ||||
| List of Key Players | ||||
| Vegetables | Production Analysis | Production Volume | ||
| Area Harvested and Yield | ||||
| Consumption Analysis (Value and Volume) | ||||
| Import Value and Volume | ||||
| Key Supplying Markets | ||||
| Export Value and Volume | ||||
| Key Destination Markets | ||||
| Wholesale Price Trend Analysis and Forecast | ||||
| Regulatory Framework | ||||
| Seasonality Analysis | ||||
| Logistics and Infrastructure | ||||
| List of Key Players | ||||
| Saudi Arabia | Fruits | Production Analysis | Production Volume | |
| Area Harvested and Yield | ||||
| Consumption Analysis (Value and Volume) | ||||
| Import Value and Volume | ||||
| Key Supplying Markets | ||||
| Export Value and Volume | ||||
| Key Destination Markets | ||||
| Wholesale Price Trend Analysis and Forecast | ||||
| Regulatory Framework | ||||
| Seasonality Analysis | ||||
| Logistics and Infrastructure | ||||
| List of Key Players | ||||
| Vegetables | Production Analysis | Production Volume | ||
| Area Harvested and Yield | ||||
| Consumption Analysis (Value and Volume) | ||||
| Import Value and Volume | ||||
| Key Supplying Markets | ||||
| Export Value and Volume | ||||
| Key Destination Markets | ||||
| Wholesale Price Trend Analysis and Forecast | ||||
| Regulatory Framework | ||||
| Seasonality Analysis | ||||
| Logistics and Infrastructure | ||||
| List of Key Players | ||||
| By Geography | United Arab Emirates | Fruits | Production Analysis | Production Volume | |
| Area Harvested and Yield | |||||
| Consumption Analysis (Value and Volume) | |||||
| Trade Analysis (Value and Volume) | Import Market Analysis | Import Value and Volume | |||
| Key Supplying Markets | |||||
| Export Market Analysis | Export Value and Volume | ||||
| Key Destination Markets | |||||
| Wholesale Price Trend Analysis and Forecast | |||||
| Regulatory Framework | |||||
| Seasonality Analysis | |||||
| Logistics and Infrastructure | |||||
| List of Key Players | |||||
| Vegetables | Production Analysis | Production Volume | |||
| Area Harvested and Yield | |||||
| Consumption Analysis (Value and Volume) | |||||
| Import Value and Volume | |||||
| Key Supplying Markets | |||||
| Export Value and Volume | |||||
| Key Destination Markets | |||||
| Wholesale Price Trend Analysis and Forecast | |||||
| Regulatory Framework | |||||
| Seasonality Analysis | |||||
| Logistics and Infrastructure | |||||
| List of Key Players | |||||
| Bahrain | Fruits | Production Analysis | Production Volume | ||
| Area Harvested and Yield | |||||
| Consumption Analysis (Value and Volume) | |||||
| Import Value and Volume | |||||
| Key Supplying Markets | |||||
| Export Value and Volume | |||||
| Key Destination Markets | |||||
| Wholesale Price Trend Analysis and Forecast | |||||
| Regulatory Framework | |||||
| Seasonality Analysis | |||||
| Logistics and Infrastructure | |||||
| List of Key Players | |||||
| Vegetables | Production Analysis | Production Volume | |||
| Area Harvested and Yield | |||||
| Consumption Analysis (Value and Volume) | |||||
| Import Value and Volume | |||||
| Key Supplying Markets | |||||
| Export Value and Volume | |||||
| Key Destination Markets | |||||
| Wholesale Price Trend Analysis and Forecast | |||||
| Regulatory Framework | |||||
| Seasonality Analysis | |||||
| Logistics and Infrastructure | |||||
| List of Key Players | |||||
| Kuwait | Fruits | Production Analysis | Production Volume | ||
| Area Harvested and Yield | |||||
| Consumption Analysis (Value and Volume) | |||||
| Import Value and Volume | |||||
| Key Supplying Markets | |||||
| Export Value and Volume | |||||
| Key Destination Markets | |||||
| Wholesale Price Trend Analysis and Forecast | |||||
| Regulatory Framework | |||||
| Seasonality Analysis | |||||
| Logistics and Infrastructure | |||||
| List of Key Players | |||||
| Vegetables | Production Analysis | Production Volume | |||
| Area Harvested and Yield | |||||
| Consumption Analysis (Value and Volume) | |||||
| Import Value and Volume | |||||
| Key Supplying Markets | |||||
| Export Value and Volume | |||||
| Key Destination Markets | |||||
| Wholesale Price Trend Analysis and Forecast | |||||
| Regulatory Framework | |||||
| Seasonality Analysis | |||||
| Logistics and Infrastructure | |||||
| List of Key Players | |||||
| Oman | Fruits | Production Analysis | Production Volume | ||
| Area Harvested and Yield | |||||
| Consumption Analysis (Value and Volume) | |||||
| Import Value and Volume | |||||
| Key Supplying Markets | |||||
| Export Value and Volume | |||||
| Key Destination Markets | |||||
| Wholesale Price Trend Analysis and Forecast | |||||
| Regulatory Framework | |||||
| Seasonality Analysis | |||||
| Logistics and Infrastructure | |||||
| List of Key Players | |||||
| Vegetables | Production Analysis | Production Volume | |||
| Area Harvested and Yield | |||||
| Consumption Analysis (Value and Volume) | |||||
| Import Value and Volume | |||||
| Key Supplying Markets | |||||
| Export Value and Volume | |||||
| Key Destination Markets | |||||
| Wholesale Price Trend Analysis and Forecast | |||||
| Regulatory Framework | |||||
| Seasonality Analysis | |||||
| Logistics and Infrastructure | |||||
| List of Key Players | |||||
| Qatar | Fruits | Production Analysis | Production Volume | ||
| Area Harvested and Yield | |||||
| Consumption Analysis (Value and Volume) | |||||
| Import Value and Volume | |||||
| Key Supplying Markets | |||||
| Export Value and Volume | |||||
| Key Destination Markets | |||||
| Wholesale Price Trend Analysis and Forecast | |||||
| Regulatory Framework | |||||
| Seasonality Analysis | |||||
| Logistics and Infrastructure | |||||
| List of Key Players | |||||
| Vegetables | Production Analysis | Production Volume | |||
| Area Harvested and Yield | |||||
| Consumption Analysis (Value and Volume) | |||||
| Import Value and Volume | |||||
| Key Supplying Markets | |||||
| Export Value and Volume | |||||
| Key Destination Markets | |||||
| Wholesale Price Trend Analysis and Forecast | |||||
| Regulatory Framework | |||||
| Seasonality Analysis | |||||
| Logistics and Infrastructure | |||||
| List of Key Players | |||||
| Saudi Arabia | Fruits | Production Analysis | Production Volume | ||
| Area Harvested and Yield | |||||
| Consumption Analysis (Value and Volume) | |||||
| Import Value and Volume | |||||
| Key Supplying Markets | |||||
| Export Value and Volume | |||||
| Key Destination Markets | |||||
| Wholesale Price Trend Analysis and Forecast | |||||
| Regulatory Framework | |||||
| Seasonality Analysis | |||||
| Logistics and Infrastructure | |||||
| List of Key Players | |||||
| Vegetables | Production Analysis | Production Volume | |||
| Area Harvested and Yield | |||||
| Consumption Analysis (Value and Volume) | |||||
| Import Value and Volume | |||||
| Key Supplying Markets | |||||
| Export Value and Volume | |||||
| Key Destination Markets | |||||
| Wholesale Price Trend Analysis and Forecast | |||||
| Regulatory Framework | |||||
| Seasonality Analysis | |||||
| Logistics and Infrastructure | |||||
| List of Key Players | |||||


Key Questions Answered in the Report
How large is the GCC fruit and vegetable market in 2026?
It stands at USD 22.43 billion and is on course to reach USD 27.41 billion by 2031.
Which country holds the largest share of GCC produce value?
Saudi Arabia led with 41.6% of GCC fruit and vegetable market share in 2025.
What is driving the fastest growth in the United Arab Emirates?
Sovereign food-security funding, rapid vertical-farm deployment, and agri-voltaic power integration underpin a projected 5.0% CAGR through 2031.
How are desalination plants contributing to agriculture?
Saudi Arabia and the United Arab Emirates retrofit plants to turn brine into fertigation nutrients, offsetting up to 15% of imported fertilizers.
Why are energy costs a restraint to greenhouse operations?
Cooling and lighting can reach 40% of total costs, and recent tariff hikes squeeze margins for facilities without on-site solar capacity.
Which technology offers the highest yield boost?
Vertical farming delivers three- to five-fold higher yields and 95% water savings compared with soil cultivation.
Page last updated on:


