Japan Fresh Fruits Market Size and Share
Japan Fresh Fruits Market Analysis by Mordor Intelligence
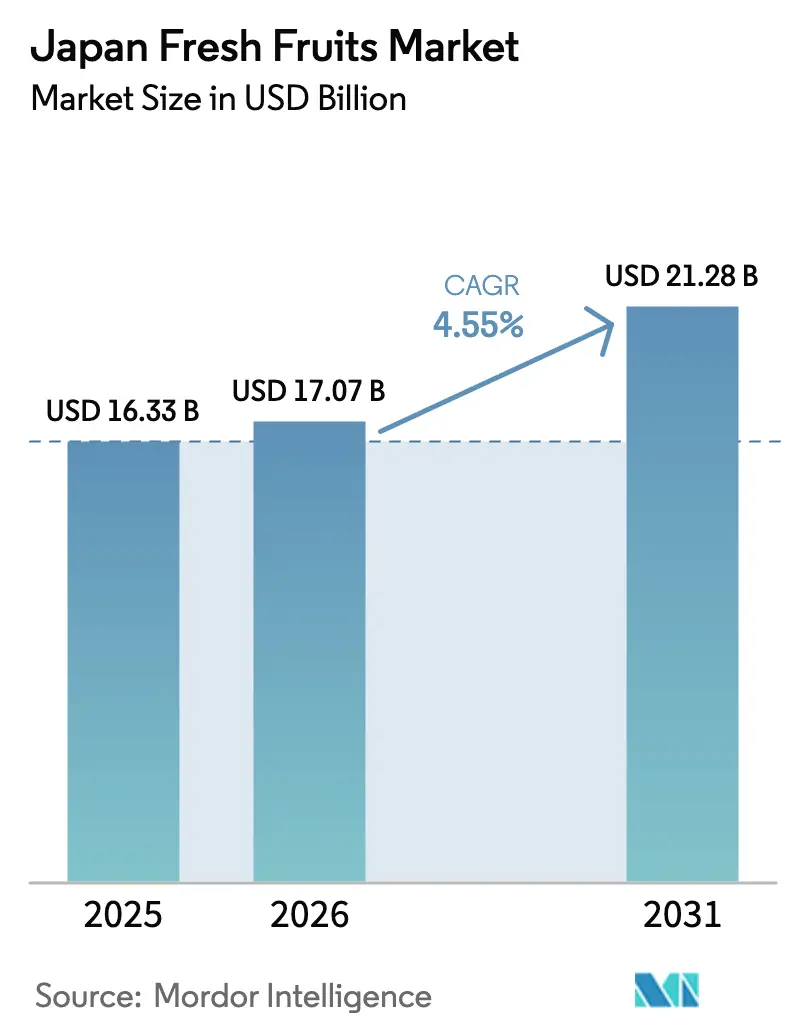
The Japan Fresh Fruits Market size is expected to grow from USD 16.33 billion in 2025 to USD 17.07 billion in 2026 and is forecast to reach USD 21.28 billion by 2031 at 4.55% CAGR over 2026-2031. Japan's fresh fruit market is distinguished by premium-quality produce and high market prices, influenced by domestic production, international trade, and regulatory policies. The country maintains a strong fruit farming heritage, with specialized growing regions for different fruit varieties. Japan is a significant apple producer, particularly known for premium varieties like Fuji, which command strong demand in both domestic and export markets. Aomori Prefecture dominates the country's apple production, generating most of the national harvest. While Japan produces apples and pears domestically, it relies heavily on imports for bananas, persimmons, oranges, grapes, and tropical fruits. Major import partners include the United States, Chile, Australia, and the Philippines. The Japanese government supports agricultural development through subsidies and grants for equipment modernization and advanced farming technology adoption. A 2024 agricultural land reform policy aims to increase farmer land ownership, reduce economic disparities between landowners and tenants, and boost overall food and fruit production.
Key Report Takeaways
- Apple maintains its position as the most produced fresh fruit in Japan. Persimmon exports demonstrate the highest growth rate among fresh fruits, with a CAGR of 3.98%.
Note: Market size and forecast figures in this report are generated using Mordor Intelligence’s proprietary estimation framework, updated with the latest available data and insights as of 2026.
Japan Fresh Fruits Market Trends and Insights
Drivers Impact Analysis*
| Driver | ( ~ ) % Impact on CAGR Forecast | Geographic Relevance | Impact Timeline |
|---|---|---|---|
| Increase in international trade | +1.9% | Export-focused prefectures (Aomori, Ehime, Yamanashi) | Medium term (2-4 years) |
| Rising apple production in the country | +1.4% | Northern Japan (Aomori, Nagano, Iwate) | Short term (≤ 2 years) |
| Government support for orchard modernization and tech adoption | +1.2% | National | Medium term (2-4 years) |
| Expansion of cold-chain logistics networks | +1.0% | Urban hubs and export gateways | Medium term (2-4 years) |
| Agritourism partnerships boosting on-farm direct sales | +0.7% | Tourism-ready rural prefectures | Long term (≥ 4 years) |
| AI-driven phenology forecasting improving yield consistency | +0.5% | Technology-forward agricultural regions | Long term (≥ 4 years) |
| Source: Mordor Intelligence | |||
Increase in international trade
Japan's fresh fruit imports have increased due to changing consumer preferences, growing interest in diverse fruit varieties, and domestic production limitations. Japanese consumers are increasingly choosing nutrient-rich fruits to support their health and wellness goals. This has increased the consumption of citrus, berries, and tropical fruits as part of balanced dietary choices. Japan's domestic fruit production remains constrained by climate and land availability, creating a demand for imported fruits. The country's fresh fruit import volume has shown consistent growth, particularly for bananas, which are among the most consumed fruits in Japan. The imports of grapes, citrus, and cherries have also increased. According to the ITC Trade Map, banana imports rose from USD 961,181.0 thousand in 2023 to USD 974,865.0 thousand in 2024. Japan sources fresh fruits from multiple countries, with the Philippines and Ecuador serving as primary banana suppliers. Chile exports significant quantities of grapes and cherries to Japan, while New Zealand and Australia are key suppliers of kiwis and citrus fruits.
Rising apple production in the country
Japan's apple production contributes significantly to its fresh fruit market. Japan ranks 13th globally in apple production, with 737,100 metric tons produced in marketing year (MY) 2024-2025, representing 0.9% of global production.[1]USDA Apples remain a staple in Japan, supporting both domestic consumption and exports. The Fuji apple maintains market dominance, while varieties like Jonagold and Orin gain popularity due to their distinct flavors and premium quality. Aomori Prefecture leads Japan's apple production, followed by Nagano and Yamagata prefectures. These regions have implemented advanced farming techniques, including controlled-environment farming and precision agriculture, enabling farmers to enhance apple quality and increase yields.
Government support for orchard modernization and tech adoption
The MIDORI strategy, implemented by the Ministry of Agriculture, aims to achieve carbon-neutral and resilient food systems by 2050. The strategy includes doubling organic fertilizer usage and funding 53 "One Prefecture, One Product" projects focused on premium fruit production. In 2023, Japan's government introduced a JPY 17 trillion (USD 113 billion) economic stimulus package, allocating supplementary budget to enhance food security and agricultural development, including fruit exports. Government policies support the implementation of solar-sharing orchards and rainwater harvesting systems, which reduce emissions while improving fruit sugar content. These initiatives strengthen the Japanese fresh fruits market's resilience to climate impacts and enhance its international market position.
Expansion of cold-chain logistics networks
The Japanese fresh fruit supply chain relies on continuous refrigeration from orchards to international retailers. The government's "Emergency Measures for Strengthening Supply Chain Connectivity" provides funding for refrigeration system upgrades, pallet pooling systems, and temperature monitoring equipment at loading facilities. The Ministry of Agriculture, Forestry, and Fisheries selected Wismettac Foods as a subsidy recipient for these measures in fiscal year 2024. The company is upgrading its depots to maintain temperature variations within ±0.5 °C, which is essential for preserving sensitive produce like strawberries and musk melons exported to North America. These logistics improvements increase product shelf life by up to 48 hours, allowing access to previously unreachable profitable markets. The enhanced cold chain infrastructure reduces product waste and improves profit margins for producers in the Japanese fresh fruits market, supporting national export objectives.
Restraints Impact Analysis*
| Restraint | ( ~ ) % Impact on CAGR Forecast | Geographic Relevance | Impact Timeline |
|---|---|---|---|
| Climate and environmental challenges | -1.4% | Nationwide, severe in traditional zones | Long term (≥ 4 years) |
| High price of fresh fruits | -1.2% | Urban consumer markets | Medium term (2-4 years) |
| Aging farmer population limiting orchard reinvestment | -1.0% | Rural production basins | Long term (≥ 4 years) |
| Strict pollen-import rules hindering resilient cultivar trials | -0.7% | National regulatory framework | Medium term (2-4 years) |
| Source: Mordor Intelligence | |||
Climate and environmental challenges
All 47 prefectures in Japan report warming impacts on fruit trees, with earlier flowering and irregular maturation disrupting optimal pollination periods. Issues like pear flowering disorder reduce yields, while apples and grapes suffer from sunburn and poor coloration. While farmers implement measures such as shading nets, reflective mulches, and modified pruning techniques, sustainable solutions require orchard relocation and development of climate-resistant cultivars. Natural disasters further constrain the market. In 2023, Japan experienced six earthquakes measuring five or higher on the Japan Meteorological Agency (JMA) scale. These seismic events cause soil erosion, land displacement, and damage to irrigation systems and storage facilities, affecting fruit production in the affected regions.
High price of fresh fruits
High fruit prices in Japan significantly influence its fresh fruit market, impacting consumer behavior and the economy. Japan's distinctive "luxury fruit" segment features premium-quality produce like perfectly shaped melons, cherries, watermelons, and grapes, which can command prices in the hundreds of dollars per piece. In 2024, a pair of Yubari King melons sold for USD 30,000, exemplifying this premium market. While this high-end segment remains profitable for select producers, it restricts fresh fruit accessibility for the general population. The market shows a growing divide, where luxury segments maintain strength while volume-based segments face pressure as consumers shift toward more affordable alternatives. This price sensitivity has prompted producers to adopt cost-reduction strategies, including automation and shared-services approaches, moving away from the traditional focus on quality regardless of cost.
*Our forecasts treat driver/restraint impacts as directional, not additive. The impact forecasts reflect baseline growth, mix effects, and variable interactions.
Geography Analysis
In Japan, apple production is concentrated in the Tohoku region, with Aomori Prefecture as the country's primary apple producer. Aomori Prefecture, known for its high-quality apples, serves both domestic and international markets. The region's cool climate and low rainfall provide ideal conditions for apple cultivation, producing firm and consistent fruits. Aomori contributed 371,000 metric tons of apples in 2025 despite extreme heat conditions, representing 61.00% of national apple production. The region maintains fruit quality standards through investments in hail nets, evaporative cooling, and dwarf rootstocks. Nagano and Iwate prefectures complete the apple production regions while developing heat-resistant varieties to maintain yields amid climate change.
Citrus production is concentrated in the southern regions of Ehime, Wakayama, and Kumamoto. Yamanashi Prefecture, the primary producer of table grapes, is implementing early-ripening varieties and night-time heat reduction techniques as temperatures rise. The prefecture supports farmers through low-interest loans and variety trials to protect agricultural income and maintain its position in Japan's fresh fruits market.
Farms near Tokyo, Osaka, and Fukuoka focus on greenhouse and vertical farming technologies for berry and melon production with controlled lighting conditions. Their proximity to urban centers enables same-day delivery to consumers. The Tokyo Ota Market handles over 4,000 metric tons of fresh produce daily, including fruits. Enhanced cold-chain distribution networks serve the national market, while refrigerated transport systems connect airports to seaport export facilities.
Recent Industry Developments
- May 2025: Wismettac Foods secured government backing under the “Emergency Measures for Strengthening Supply Chain Connectivity” to upgrade refrigerated links for strawberry, melon, and kiwi exports to the U.S. market, aligning with national export targets.
- December 2024: The Japan Fruit and Vegetables Export Promotion Council initiated a promotional campaign called "Smile Japanese Fruits Gift" in partnership with Hello Kitty. The initiative aims to promote Japanese-grown fruits through social media contests during major holidays, including Christmas, New Year, Chinese New Year, and Valentine's Day. The campaign targets consumers across Thailand, Singapore, Malaysia, Vietnam, Hong Kong, and Taiwan.


Research Methodology Framework and Report Scope
Market Definitions and Key Coverage
We define the Japan fresh fruits market as all edible fruits harvested within the country or imported for immediate household or food-service consumption in raw, unprocessed form. Values are reported in nominal US dollars at the domestic wholesale-to-retail hand-off, while volumes are maintained in metric tons for cross-checks.
Scope exclusions include dried, frozen, canned, juiced, fermented fruits, vegetables, nuts, and fruit derivatives, which fall outside this study.
Segmentation Overview
- By Type
- Apples
- Bananas
- Oranges/Mandarin
- Grapes
- Watermelons
- Kiwifruit
- Pears
- Persimmons
- Cantaloupes and other Melons
- Apricots
- Cherries
Detailed Research Methodology and Data Validation
Primary Research
We enriched desk work through interviews with orchard cooperatives in Aomori, import agents in Kobe, Tokyo Central Wholesale traders, and produce buyers at national supermarket chains. These conversations helped us lock in landed cost spreads, spoilage rates, and premium gifting trends across regions.
Desk Research
Our analysts drew multi-year supply and demand series from the Ministry of Agriculture, Forestry and Fisheries, FAOSTAT, UN Comtrade, ITC Trade Map, and dietary surveys, then overlaid customs tariffs, retailer scanner snippets, and quoted prices from produce exchanges. Paid repositories such as D&B Hoovers and Dow Jones Factiva added company revenue signals, rounding out price ladders and importer exposure. The sources named are illustrative; numerous additional public and proprietary feeds were reviewed to validate and clarify data points.
Market-Sizing & Forecasting
We establish market value with a top-down production-plus-trade rebuild that converts official tonnage into dollars using weighted wholesale prices. Then, we corroborate totals through selective supplier roll-ups and channel checks (this is where Mordor analysts add value). Key model drivers include per-capita fruit intake, import penetration ratio, orchard yield trend, yen-dollar exchange path, and extreme weather incidence. Forecasts to 2030 rely on a multivariate regression coupled with scenario analysis so shocks such as currency swings or typhoon damage can be stress-tested. Small gaps, for instance, missing quotes for niche fruits, are bridged by short-term interpolation guided by expert opinions.
Data Validation & Update Cycle
Before release, every figure passes variance flags, peer review, and leadership sign-off. Our dashboards track monthly customs and climate updates, and if a metric moves beyond a set threshold, the worksheet is reopened, ensuring clients receive a refreshed file even between the scheduled annual update.
Why Mordor's Japan Fresh Fruits Baseline Earns Trust
Published estimates often diverge because each firm selects its own mix of products, price points, and refresh rhythm.
Key gap drivers are that some providers blend vegetables or processed formats, others convert with retail price multipliers, and several roll forward older baselines without verifying new trade surges. Our disciplined scope and yearly field checks keep Mordor's figure grounded.
Benchmark comparison
| Market Size | Anonymized source | Primary gap driver |
|---|---|---|
| USD 16.33 B (2025) | Mordor Intelligence | Baseline figure |
| USD 20.87 B (2024) | Regional Consultancy A | Includes vegetables and frozen fruit, uses retailer revenue lens |
| USD 17.60 B (2024) | Trade Journal B | Values at wholesale import prices, bundles berries with wider crop basket |
The comparison shows that our transparent build-up, clear fruit-only scope, and rolling validation deliver a balanced baseline that decision-makers can rely on.


Key Questions Answered in the Report
What is the current value of the Japan fresh fruits market?
The market is worth USD 17.07 billion in 2026, backed by robust domestic premium demand and expanding export programs.
Which fruit segment holds the largest share in Japan?
Apples dominate with about 35.28% of total domestic volume, supported by Aomori’s 61.00% contribution to national apple output.
How fast is the Japan fresh fruits market projected to grow?
It is projected to post a 4.55% CAGR, rising to USD 21.28 billion by 2031 over 2026-2031, driven by premiumization and smart-farming adoption.
Why are Japanese fresh fruits priced higher than global averages?
Stringent grading, meticulous cultivation, and sophisticated packaging elevate costs, while cultural gifting traditions maintain consumers’ willingness to pay.
Page last updated on:


