Formulation Additive Market Size and Share
Market Overview
| Study Period | 2021 - 2031 |
|---|---|
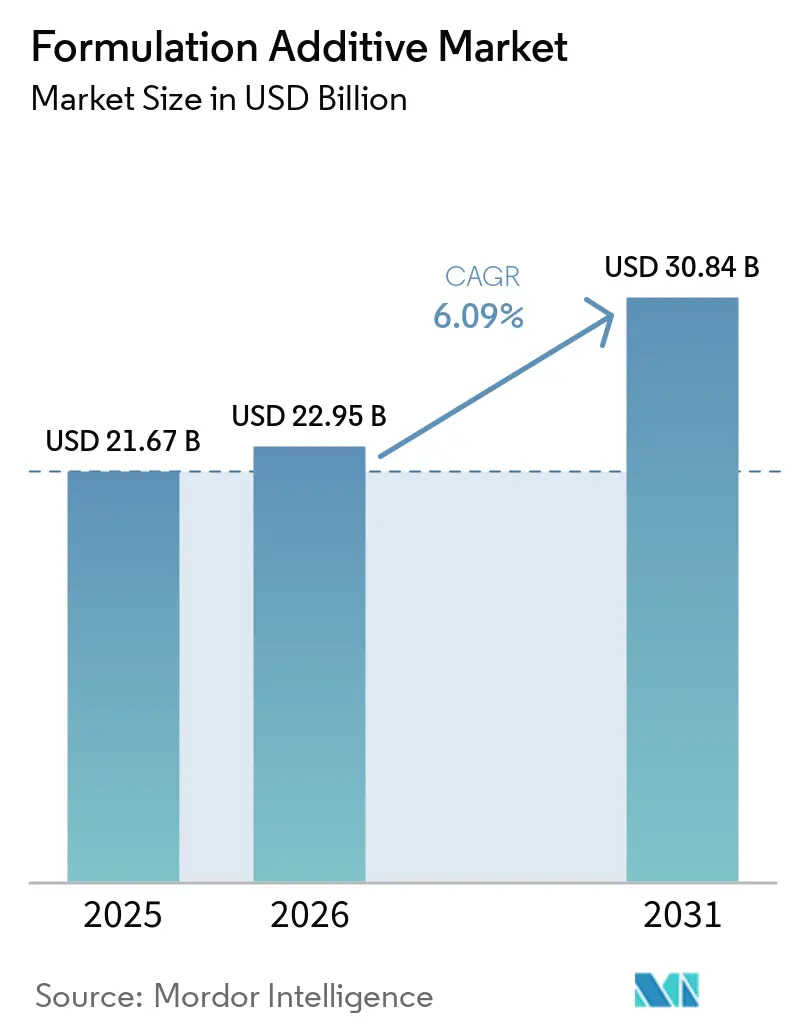
| Market Size (2026) | USD 22.95 Billion |
| Market Size (2031) | USD 30.84 Billion |
| Growth Rate (2025 - 2030) | 6.09% CAGR |
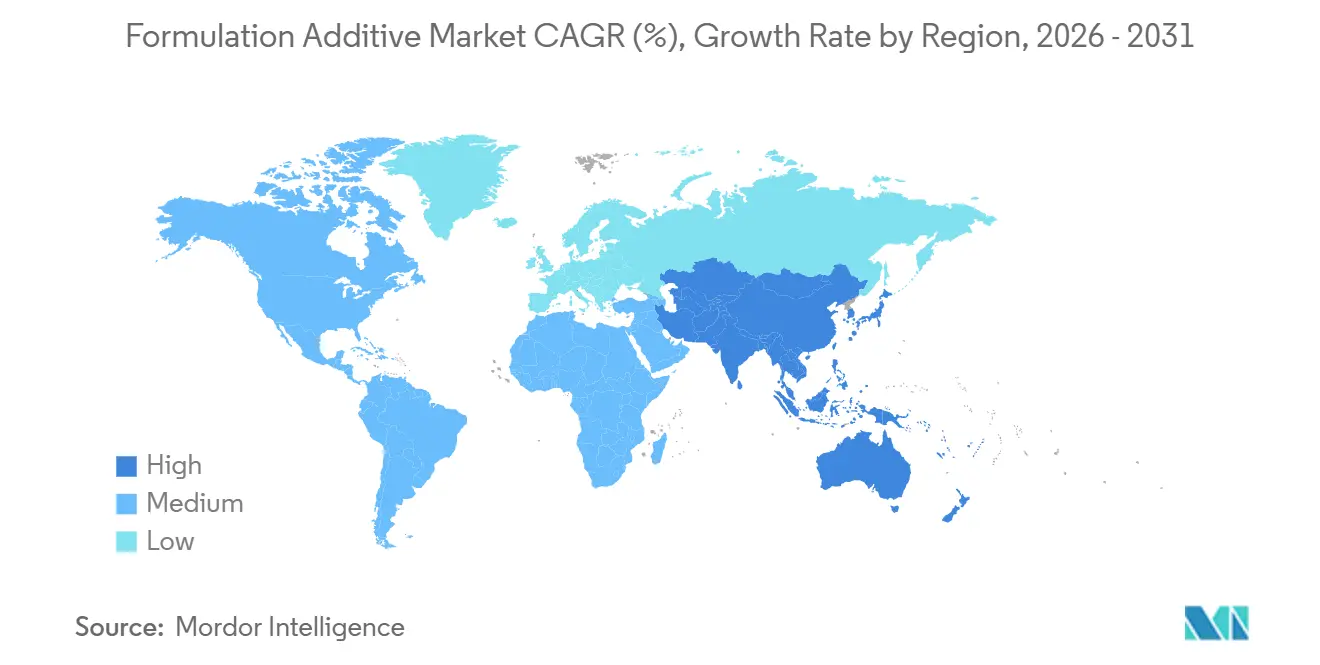
| Fastest Growing Market | Asia Pacific |
| Largest Market | Asia Pacific |
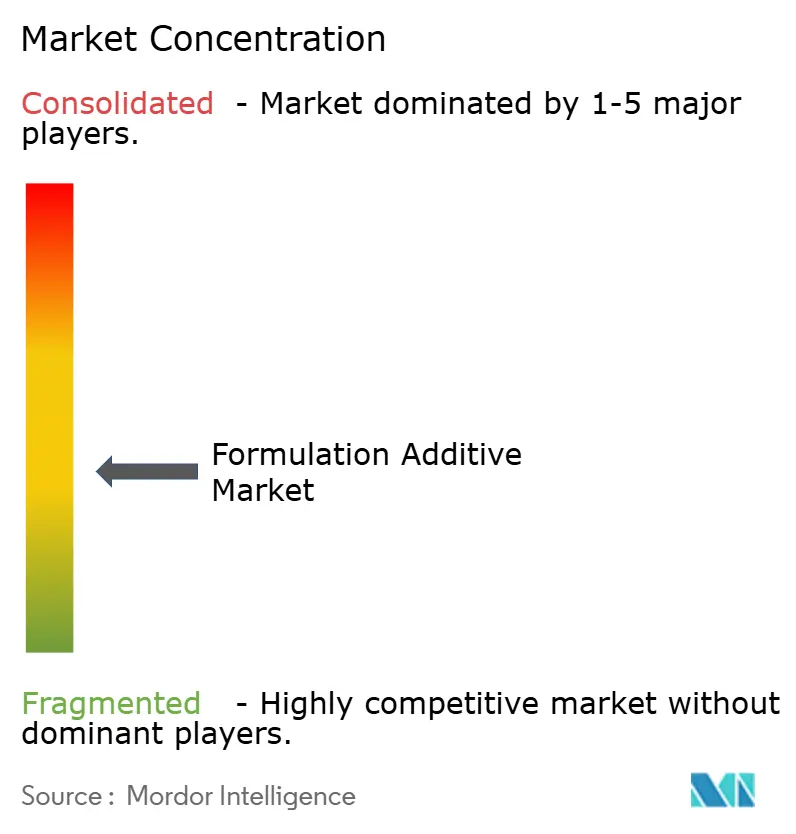
| Market Concentration | Medium |
Major Players *Disclaimer: Major Players sorted in no particular order Image © Mordor Intelligence. Reuse requires attribution under CC BY 4.0. | |
Formulation Additive Market Analysis by Mordor Intelligence
The Formulation Additive Market size is projected to expand from USD 21.67 billion in 2025 and USD 22.95 billion in 2026 to USD 30.84 billion by 2031, registering a CAGR of 6.09% between 2026 to 2031. Strong demand for low-VOC coatings, rapid growth of electric vehicle battery plants, and a rebound in commercial construction are driving steady volume growth in dispersing agents, rheology modifiers, and defoamers. In the electronics and automotive assembly sectors, companies are transitioning from traditional oven-cured solvent-borne lines to UV/EB-curable systems, leading to notable energy cost savings and better utilization of floor space. With policy-driven capacity expansions in India and China, the Asia-Pacific region is cementing its status as a focal point. At the same time, North America's Inflation Reduction Act is catalyzing the reshoring of high-purity additive intermediates. While competition remains moderate, the rise of digital formulation tools is speeding up development cycles.
Key Report Takeaways
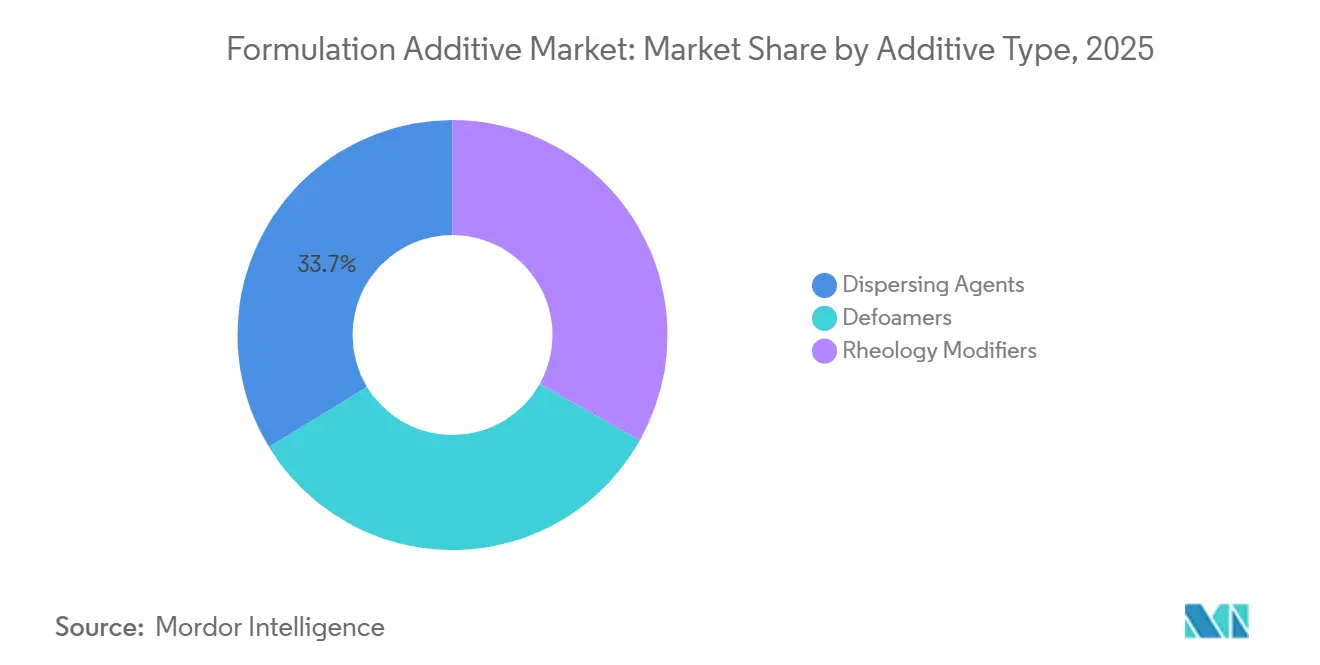
- By additive type, dispersing agents led with 33.71% of formulation additive market share in 2025, while rheology modifiers are projected to expand at a 6.61% CAGR through 2031.
- By end-user industry, construction accounted for 28.74% of demand in 2025; electronics is forecast to grow at a 6.92% CAGR to 2031 as ultra-low-dielectric additives gain traction in 5G hardware.
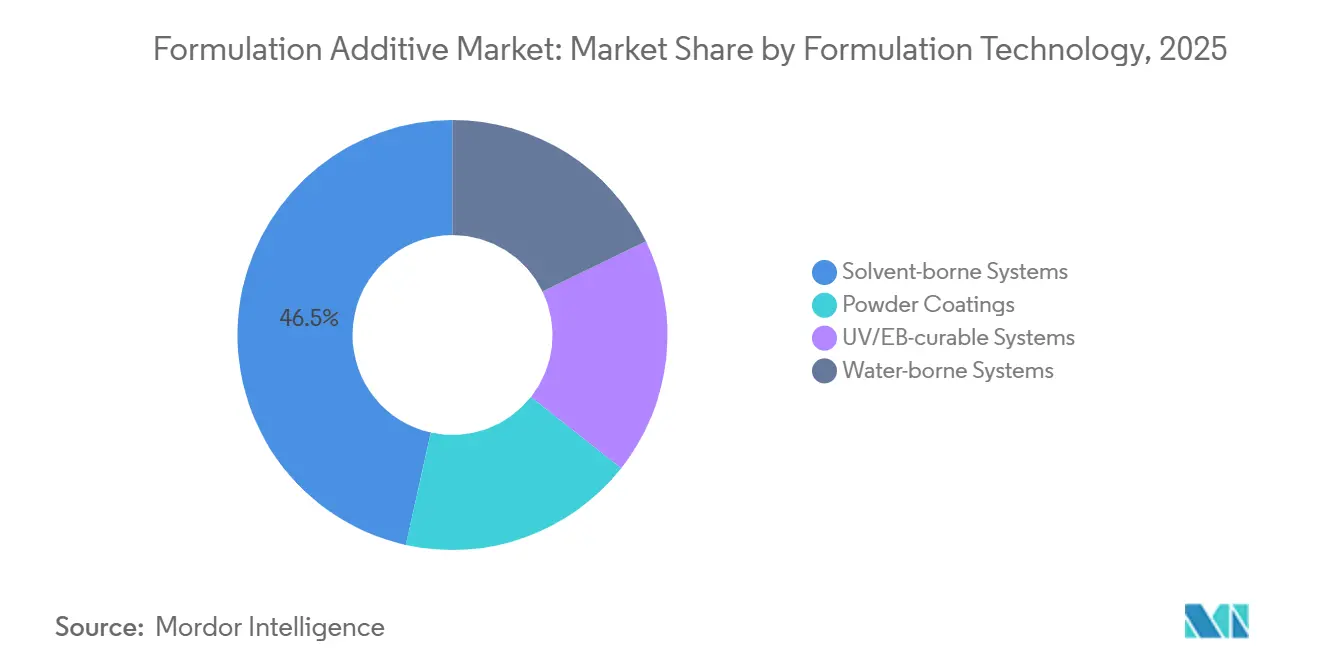
- By formulation technology, solvent-borne systems captured 46.52% revenue in 2025, whereas UV/EB-curable lines are set to surge at 7.28% CAGR, driven by instant-cure cycles in automotive and PCB assembly.
- By geography, Asia-Pacific commanded 42.23% of value in 2025 and is expected to post the fastest regional CAGR of 6.99% over the forecast period, supported by specialty-chemical park investments in Jiangsu and Shandong.
Note: Market size and forecast figures in this report are generated using Mordor Intelligence’s proprietary estimation framework, updated with the latest available data and insights as of January 2026.
Global Formulation Additive Market Trends and Insights
Drivers Impact Analysis*
| Driver | (~) % Impact on CAGR Forecast | Geographic Relevance | Impact Timeline |
|---|---|---|---|
| Sustainability-driven switch to low-VOC water-borne coatings | +1.20% | Global, with strongest uptake in EU and North America | Medium term (2-4 years) |
| Expansion of infrastructure spending in emerging economies | +1.50% | APAC core (India, Indonesia, Vietnam), spill-over to Middle-East | Long term (≥ 4 years) |
| Rapid growth of high-performance lightweight composites | +0.90% | North America and EU aerospace hubs, APAC automotive clusters | Medium term (2-4 years) |
| E-mobility demand for thermal-management fluids and additives | +1.10% | Global, concentrated in China, EU, and U.S. EV manufacturing zones | Short term (≤ 2 years) |
| OEM push for sensor-friendly ultra-low-dielectric additives | +0.80% | APAC electronics hubs (Taiwan, South Korea, Japan), North America automotive | Medium term (2-4 years) |
| Source: Mordor Intelligence | |||
Sustainability-Driven Switch to Low-VOC Water-Borne Coatings
Since 2020, water-borne coatings have surged to dominate a significant share of the global architectural paint volume. This evolution aligns with the heightened VOC limit regulations imposed by authorities in the European Union and California. In light of these changes, major manufacturers are transitioning from the use of traditional glycol ethers to bio-based coalescents and are increasingly adopting associative thickeners. These thickeners, which uphold viscosity without organic solvents, have led to a notable decrease in cradle-to-gate emissions when compared with solvent-borne alternatives. BASF has introduced rheology modifiers that replicate the anti-sag characteristics of alkyds, allowing specifiers to secure LEED v4.1 credits while maintaining high application quality. Meanwhile, platforms such as Benjamin Moore’s Gennex, which feature zero-VOC colorants, are reducing pigment demand, resulting in tangible raw-material cost reductions. Furthermore, in both the United States and Europe, there is a discernible trend in public-sector procurement favoring products backed by third-party environmental declarations, accelerating changes in infrastructure projects.
Expansion of Infrastructure Spending in Emerging Economies
India, under its National Chemicals Policy, is targeting a substantial boost in domestic chemical production by 2030[1]Government of India, “National Chemicals Policy 2024,” chemicals.nic.in . The policy offers foreign investors an enticing decade-long tax holiday across 12 chosen investment zones. Meanwhile, in Indonesia, the Nusantara capital project is setting a benchmark. It requires all government buildings to use low-VOC coatings, thereby increasing the demand for water-borne dispersing agents and defoamers. Saudi Arabia's Public Investment Fund is making a major investment in the NEOM industrial zone, featuring an ethylene cracker that will cater to downstream additive units. This strategic move is expected to cut logistics costs for local formulators. In Vietnam, a recent amendment to the Construction Law mandates VOC testing for skyscraper projects, paving the way for a profitable market for compliant additives by 2028. In 2024, major multilateral lenders committed significant funds to enhance Southeast Asian infrastructure, with a notable emphasis on green-building agreements, highlighting a preference for water-borne and UV-curable solutions.
Rapid Growth of High-Performance Lightweight Composites
From 2022 to 2024, automotive original equipment manufacturers (OEMs) increased their use of carbon fiber in electric platforms, driving a surge in demand for rheology modifiers. These modifiers play a crucial role in ensuring the even distribution of fibers during resin infusion. Prepreg sales experienced significant growth, supported by aerospace programs ranging from Boeing's 787 to Airbus's A350. This growth was primarily driven by epoxy matrices, enhanced with flexibilizers, which can withstand service temperatures of up to 180 degrees Celsius. BMW's iFACTORY initiative has set an ambitious target of recycling a significant portion of its carbon fiber by 2028. Achieving this goal requires the use of dispersing agents that can re-stabilize reclaimed fibers while maintaining their mechanical properties. NASA's innovative composite cryotank achieved a notable reduction in structural mass, providing a cost-saving advantage for space launchers. This advancement has attracted the attention of additive suppliers specializing in cryogenic resins. In the wind energy sector, developers are now opting for 80-meter blades. These blades incorporate gel coats, fortified with ultraviolet (UV) absorbers and anti-sagging agents, to prevent pinholes during vertical molding.
E-Mobility Demand for Thermal-Management Fluids and Additives
Since 2022, EV coolant additive sales have surged. This growth stems from OEMs seeking fluids that can operate stably between -40°C and 135°C, while also preventing corrosion in aluminum heat exchangers. In China, the revised GB 29743.2 regulation sets a new standard, requiring a minimum boiling point of 165°C. As a result, formulators are increasingly turning to polyalkylene glycol base stocks and corrosion inhibitors, both of which have garnered endorsements from industry leaders BYD and CATL. Castrol has rolled out a new dielectric coolant, featuring a breakdown voltage surpassing 50 kV. This innovation supports the immersion cooling of 800-volt packs, achieving a significant system weight reduction of 12 kg. Shell's E-Fluids are fortified with anti-foaming agents, effectively preventing bubble nuclei formation during swift charge heat fluxes, even at the peak of 15 kW/m². In a move toward sustainability, TotalEnergies and Stellantis are piloting rapeseed-derived additive packages. These cutting-edge solutions aim to curtail life-cycle carbon emissions, aligning perfectly with the European Union's Corporate Sustainability Reporting Directive.
Restraints Impact Analysis*
| Restraint | (~) % Impact on CAGR Forecast | Geographic Relevance | Impact Timeline |
|---|---|---|---|
| Volatile petrochemical feedstock pricing | -0.70% | Global, acute in import-dependent regions (EU, Japan, South Korea) | Short term (≤ 2 years) |
| Stringent REACH and TSCA re-registration costs | -0.50% | EU and North America, indirect impact on global supply chains | Medium term (2-4 years) |
| Rising PFAS-free specification bans | -0.40% | EU, North America (state-level), emerging in APAC | Long term (≥ 4 years) |
| Source: Mordor Intelligence | |||
Stringent REACH and TSCA Re-Registration Costs
In 2025, the European Chemicals Agency added eight substances to its Candidate List. Manufacturers face high costs for high-volume substance dossiers, excluding the essential genotoxicity testing. In the United States, the EPA requires manufacturers to report exposure data for thousands of chemicals every four years, imposing substantial fines for non-compliance. Evonik discontinued several surfactant SKUs after internal models projected a negative net present value, taking future authorization fees into account. Mid-sized firms, particularly those with product line portfolios below a certain threshold, are disproportionately burdened by these compliance costs.
Rising PFAS-Free Specification Bans
The European Union's draft PFAS restriction seeks to ban fluorosurfactants in coatings within five years, with only essential-use exemptions permitted. Maine's LD 1537 goes further, banning intentional PFAS in most products unless their use is deemed unavoidable. As a result, several leading paint brands have reformulated their premium exterior lines[2]State of Maine, “LD 1537 PFAS Ban,” maine.gov . Clariant has introduced a PFAS-free wetting agent that achieves the same surface-tension reduction as its predecessor. However, it requires a higher dosage, increasing formulation costs. With a rise in United States state bans and TSCA Section 6 nearing a stricter reporting threshold, those lagging in compliance face the risk of inventory write-offs.
*Our forecasts treat driver/restraint impacts as directional, not additive. The impact forecasts reflect baseline growth, mix effects, and variable interactions.
Segment Analysis
By Additive Type: Dispersing Agents Lead, Rheology Modifiers Accelerate
In 2025, dispersing agents accounted for 33.71% of the revenue, highlighting their pivotal role in stabilizing pigments and fillers across various systems, including water-borne, solvent-borne, and UV. BASF's DISPERBYK-2150, leveraging a polyurethane backbone, curtailed the demand for TiO₂, leading to cost efficiencies in paint batches.
Rheology modifiers are projected to grow at a 6.61% CAGR during the forecast period of 2026-2031, driven by the demand for shear-thinning 3D-print mortars and anti-sag vertical coatings. Associative thickeners, now adept at resisting viscosity drift even in tropical conditions, have broadened the formulation additive market's reach beyond temperate zones. Defoamers have secured a significant market share; Evonik's silicone-free introduction not only meets EU Ecolabel standards but also addresses crater-formation issues that previously challenged satin finishes. Surfactant-based wetting agents met the stringent ionic contamination standards of electronics, while a combination of coupling agents, adhesion promoters, and UV stabilizers made notable contributions to specialized niches.


By End-Use Industry: Construction Dominates, Electronics Surges
In 2025, the construction sector accounted for 28.74% of the volume, utilizing products such as interior primers, exterior elastomeric walls, and concrete release agents. These applications consistently drive the demand for dispersants, defoamers, and rheology packages. Architectural paints typically utilize a defined ratio of dispersants, defoamers, and thickeners, indicating a consistent demand pattern.
The electronics sector is set to outpace the broader formulation additive market, growing at a 6.92% CAGR during the forecast period of 2026-2031, fueled by the demand for ultra-low-dielectric additives in underfill, encapsulant, and thermal-interface materials. Highlighting the specialized value for high-reliability assembly, Henkel's Loctite 3382 line, featuring boron-nitride fillers and aminosilane coupling agents, boasts impressive conductivity and extended pot life. The transportation industry, spanning automotive and aerospace, is increasingly adopting composite structures, driving the demand for flexibilized epoxy systems that bolster fracture toughness. Other sectors, including oil and gas drilling fluids, specialty lubricants, and food-grade can coatings, have been steadily advancing, carving out niches in response to regulatory demands.
By Formulation Technology: Solvent-Borne Prevails, UV/EB Systems Gain
In 2025, solvent-borne lines captured 46.52% of sales, with marine and industrial maintenance coatings relying on high-solids aromatics for enhanced chemical resistance. Meanwhile, UV/EB-curable systems are projected to grow at a 7.28% CAGR during the forecast period of 2026-2031. This growth is attributed to assembly plants embracing instant-cure cycles, which negate the need for ovens and streamline work-in-process stock.
Water-borne systems, bolstered by hydrophilic polyisocyanate crosslinkers such as Covestro's Bayhydur 305, have solidified their market presence. These crosslinkers enable two-component coatings to rival the performance of their solvent-borne epoxy counterparts. Powder coatings, a favorite for appliances and architectural aluminum, benefit from the efficiency of 100% solids in overspray recovery. The market is further rounded out by high-solids hybrids and plasma-polymerized films. Innovations such as Lambson's Esacure TZT photoinitiators are revolutionizing UV curing, achieving greater depths under nitrogen and overcoming previous thickness challenges. This advancement has opened doors for 3D-printed tooling applications.
Geography Analysis
In 2025, the Asia-Pacific region accounted for 42.23% of the global revenue and is projected to grow at a 6.99% CAGR during the forecast period of 2026-2031. India's ambitious chemical roadmap and China's strategic investments in specialty parks in Jiangsu and Shandong are the primary drivers of this growth. Regional producers are poised to increase their stake in the formulation additive market, bolstered by SABIC's investment in a Fujian complex, now utilizing EVA feedstock for adhesive additives. Furthermore, Japan's subsidy initiative is enhancing domestic production of semiconductor-grade dispersants.
North America, with a significant market share in 2025, is reaping benefits from IRA-driven electrification and Dow's bio-ethylene expansion in Texas. This expansion plays a crucial role in supplying low-carbon acrylate monomers, vital for rheology modifiers. The nearshoring boom in Mexico has spurred the creation of numerous factory jobs, escalating the demand for conformal coatings and thermal interface materials. These materials heavily depend on surfactant and coupling-agent packages. The region's specialty additives production enjoys a cushion from abundant shale gas, a privilege not extended to Europe, which grapples with import reliance and feedstock volatility.
Europe is steering its market dynamics in line with the EU Green Deal's Fit for 55 targets. These targets are steering formulators towards sustainable choices like water-borne and UV systems. Germany is advancing with decarbonization grants, backing electrified crackers and bio-based pilots, paving the way for a market for green-label additives. South America is buoyed by Brazil's construction resurgence and Argentina's rising lithium sector, both showing interest in corrosion-resistant pond coatings. Meanwhile, the Middle-East and Africa are leveraging low-cost ethane feedstock, though they grapple with fragmented regulations that slow the adoption of specialty grades.

Competitive Landscape
The formulation additive market is moderately fragmented. Industry leaders distinguish themselves with global application labs and state-of-the-art AI-driven formulation software. For example, BASF's Formulation Advisor platform has transformed lab cycle times, significantly speeding them up by leveraging historical recipe analysis for predictive insights.
In 2025, Evonik rolled out TEGO Dispers 760 W, a PFAS-free wetting agent. This product swiftly gained momentum, obtaining early design nods from multiple global paint manufacturers by mimicking the surface-tension traits of conventional fluorosurfactants, all while sidestepping REACH Annex XVII scrutiny. BYK is focusing on polymeric dispersants, which allow for reduced pigment loading. This feature offers a notable edge, translating to significant raw material savings in the sought-after decorative coatings market.
Regional specialists are flourishing by emphasizing swift customization and sustainable chemistries. For instance, Cabot's surface-treated carbon-black dispersions have shortened dispersion times, benefiting just-in-time production for automotive OEMs. Arxada is seizing opportunities amid regulatory hurdles in the antimicrobial additives sector. Concurrently, computational-chemistry startups are rapidly crafting molecules in silico, positioning themselves to swiftly navigate PFAS bans. Clariant's recent patent applications for lignin-based dispersants highlight the industry's increasing focus on bio-content innovations, resonating with customer Scope 3 objectives.
Formulation Additive Industry Leaders
Dow
Evonik Industries AG
Arkema
BASF
Altana (BYK)
- *Disclaimer: Major Players sorted in no particular order

Recent Industry Developments
- January 2026: Evonik Coating Additives introduced TEGO Dispers 695, a hyperdispersant designed for radiation-curing inks and solventborne polyurethane inks. This additive is highly polymeric, solvent-free, and 100% active, with the ability to dissolve easily in various monomers and organic solvents, including alcohols.
- April 2025: Evonik Coating Additives, a subsidiary of Evonik Industries AG developed TEGO Wet 288, a substrate wetting formulation additive for waterborne and radiation-cured formulations. Furthermore, the additive has broad food contact compliance, making it suitable for food packaging applications.


Global Formulation Additive Market Report Scope
Formulation additives are specialized chemical substances added during manufacturing to enhance processing, performance, stability, and overall functionality. Although not the primary active components of a formulation, they play a critical role in ensuring the final product meets the required quality and application standards.
The formulation additive market is segmented by additive type, end-user industry, formulation technology, and geography. By additive type, the market is segmented into defoamers, rheology modifiers, and dispersing agents. By end-user industry, the market is segmented into construction, transportation, automotive, oil and gas, food and beverage, electronics, and other end-user industries. By formulation technology, the market is segmented into water-borne systems, solvent-borne systems, powder coatings, UV/EB-curable systems. The report also covers the market size and forecasts for formulation additive in 15 countries across major regions. For each segment, the market sizing and forecasts have been done on the basis of value (USD).
| Defoamers |
| Rheology Modifiers |
| Dispersing Agents |
| Construction |
| Transportation |
| Automotive |
| Oil and Gas |
| Food and Beverage |
| Electronics |
| Other End-user Industries |
| Water-borne Systems |
| Solvent-borne Systems |
| Powder Coatings |
| UV/EB-curable Systems |
| Asia-Pacific | China |
| Japan | |
| India | |
| South Korea | |
| Rest of Asia-Pacific | |
| North America | United States |
| Canada | |
| Mexico | |
| Europe | Germany |
| United Kingdom | |
| France | |
| Italy | |
| Rest of Europe | |
| South America | Brazil |
| Argentina | |
| Rest of South America | |
| Middle-East and Africa | Saudi Arabia |
| South Africa | |
| Rest of Middle-East and Africa |
| By Additive Type | Defoamers | |
| Rheology Modifiers | ||
| Dispersing Agents | ||
| By End-use Industry | Construction | |
| Transportation | ||
| Automotive | ||
| Oil and Gas | ||
| Food and Beverage | ||
| Electronics | ||
| Other End-user Industries | ||
| By Formulation Technology | Water-borne Systems | |
| Solvent-borne Systems | ||
| Powder Coatings | ||
| UV/EB-curable Systems | ||
| By Geography | Asia-Pacific | China |
| Japan | ||
| India | ||
| South Korea | ||
| Rest of Asia-Pacific | ||
| North America | United States | |
| Canada | ||
| Mexico | ||
| Europe | Germany | |
| United Kingdom | ||
| France | ||
| Italy | ||
| Rest of Europe | ||
| South America | Brazil | |
| Argentina | ||
| Rest of South America | ||
| Middle-East and Africa | Saudi Arabia | |
| South Africa | ||
| Rest of Middle-East and Africa | ||


Key Questions Answered in the Report
How large will global demand for formulation additives be by 2031?
The formulation additive market size stands at USD 22.95 billion in 2026, and it is projected to reach USD 30.84 billion by 2031 at a 6.09% CAGR.
Which additive type drives the highest revenue today?
Dispersing agents commanded 33.71% of 2025 sales, the largest share among all additive categories.
Which end-use sector is growing the fastest?
Electronics is forecast to register a 6.92% CAGR through 2031 as 5G and high-density packaging raise purity and dielectric requirements.
Why are UV/EB-curable formulations gaining favor?
They offer instant cures, cut curing energy by more than 70%, and eliminate ovens, boosting throughput on automotive and electronics lines.
Which region will add the most incremental value?
Asia-Pacific is expected to see the highest absolute dollar growth, supported by chemical park investments in China and policy incentives in India.
How are suppliers addressing PFAS bans?
Leaders such as Evonik and Clariant are commercializing PFAS-free wetting agents and surfactants that match performance while satisfying REACH and state-level regulations.
Page last updated on:


