
Ink Additives Market Size and Share
Market Overview
| Study Period | 2020 - 2031 |
|---|---|
| Market Size (2026) | USD 2.67 Billion |
| Market Size (2031) | USD 3.4 Billion |
| Growth Rate (2026 - 2031) | 4.98 % |
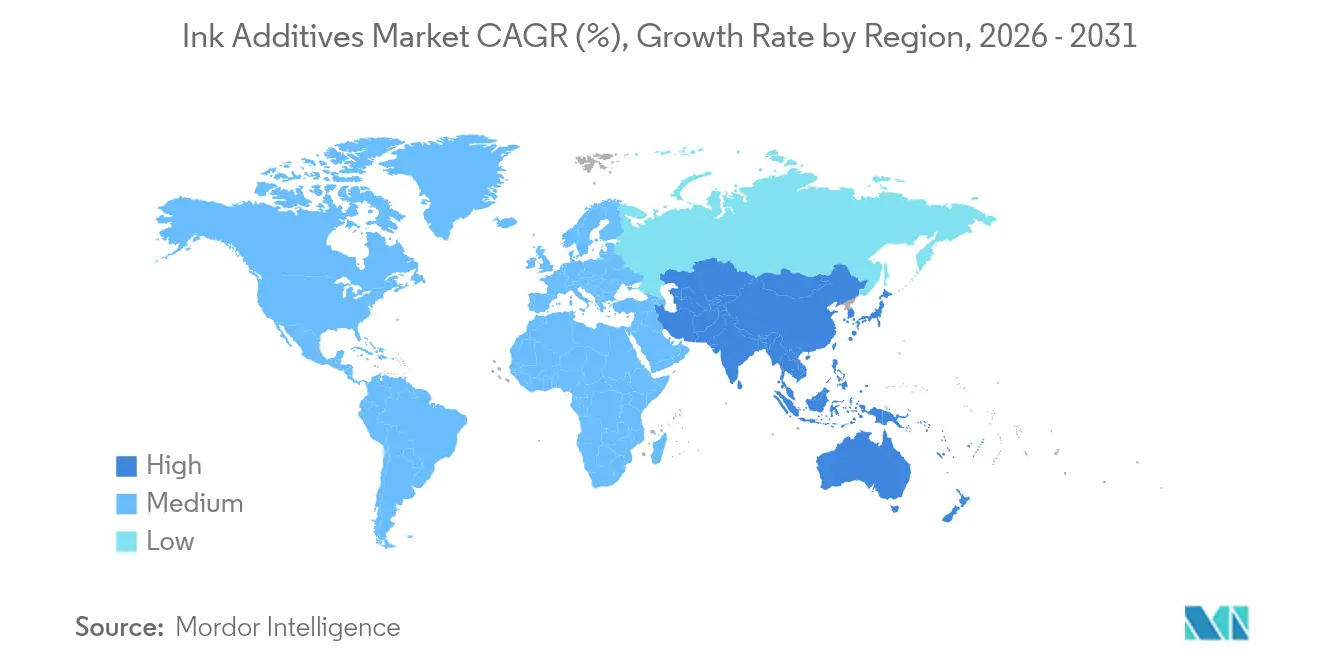
| Fastest Growing Market | Asia Pacific |
| Largest Market | Asia Pacific |
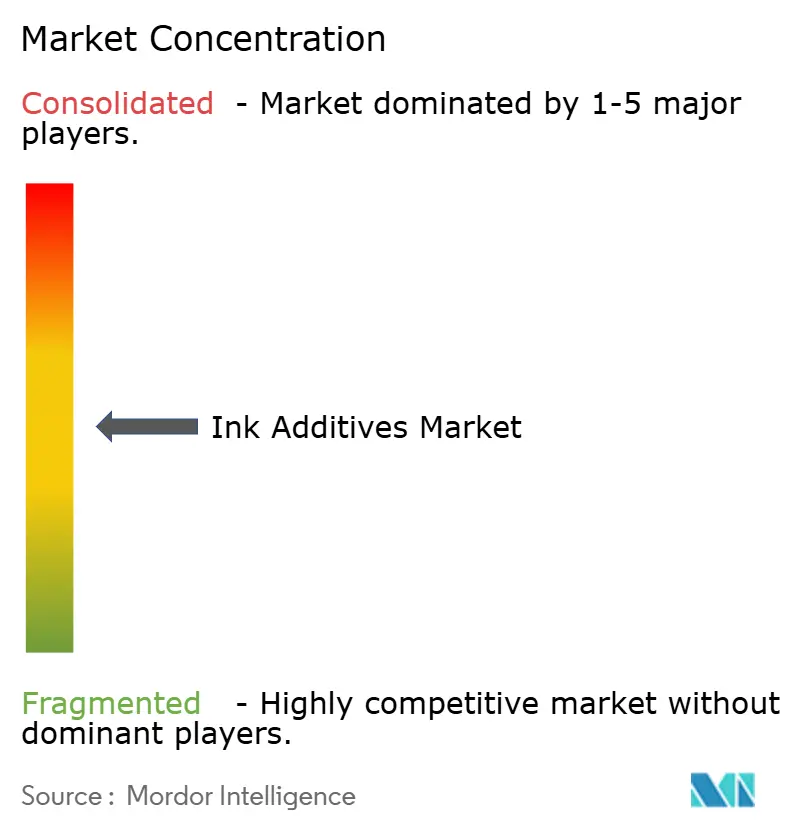
| Market Concentration | Medium |
Major Players *Disclaimer: Major Players sorted in no particular order Image © Mordor Intelligence. Reuse requires attribution under CC BY 4.0. | |
Ink Additives Market Analysis by Mordor Intelligence
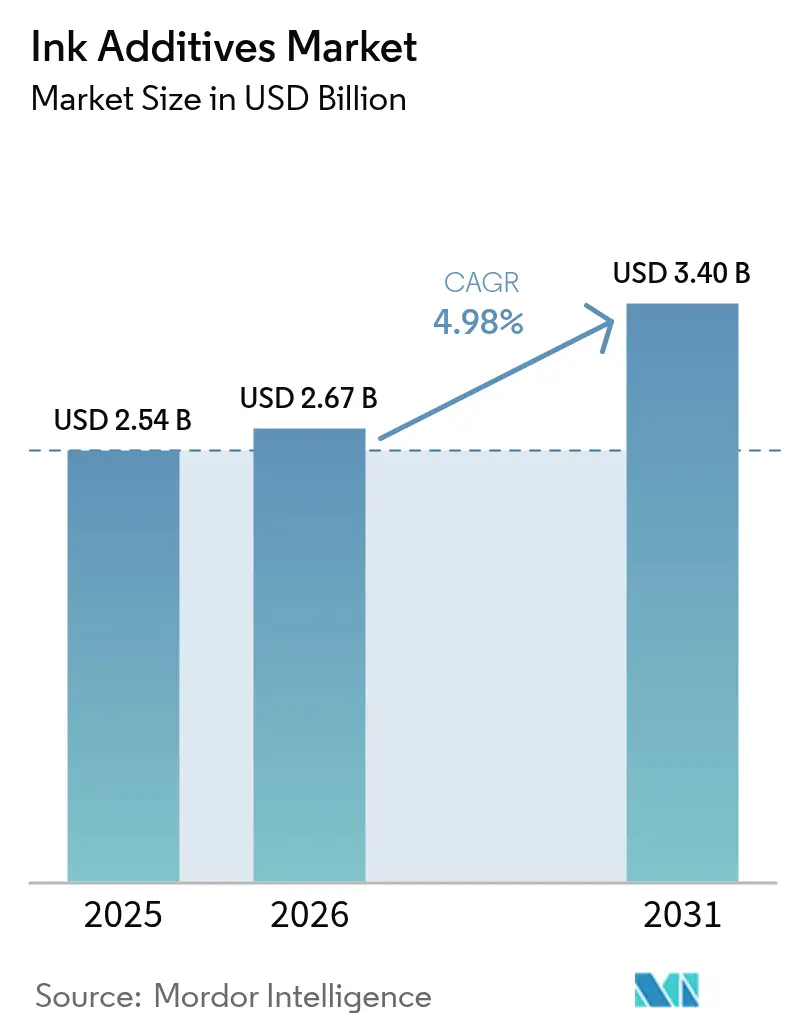
The Ink Additives market size is expected to grow from USD 2.54 billion in 2025 to USD 2.67 billion in 2026 and is forecast to reach USD 3.4 billion by 2031 at 4.98% CAGR over 2026-2031. Market expansion reflects tightening quality demands from packaging converters, rising regulatory pressure to cut volatile-organic-compound (VOC) emissions, and a gradual shift toward digital printing workflows. Although additives account for less than 5% of a typical ink formulation, they provide essential functionality—such as pigment stabilization, flow control, surface slip, and adhesion enhancement—that enables consistent print results on increasingly diverse substrates. Packaging leads consumption because e-commerce, food-grade flexibles, and premium corrugated formats all require highly engineered, low-migration chemistries. In technology terms, water-based systems now dominate volumes, while UV-curable chemistries record the fastest growth thanks to energy-efficient curing and regulatory preference for low-VOC solutions. Supply-side innovation centres on bio-based, PFAS-free, and mineral-oil-free platforms that support circular-economy goals without sacrificing performance.
Key Report Takeaways
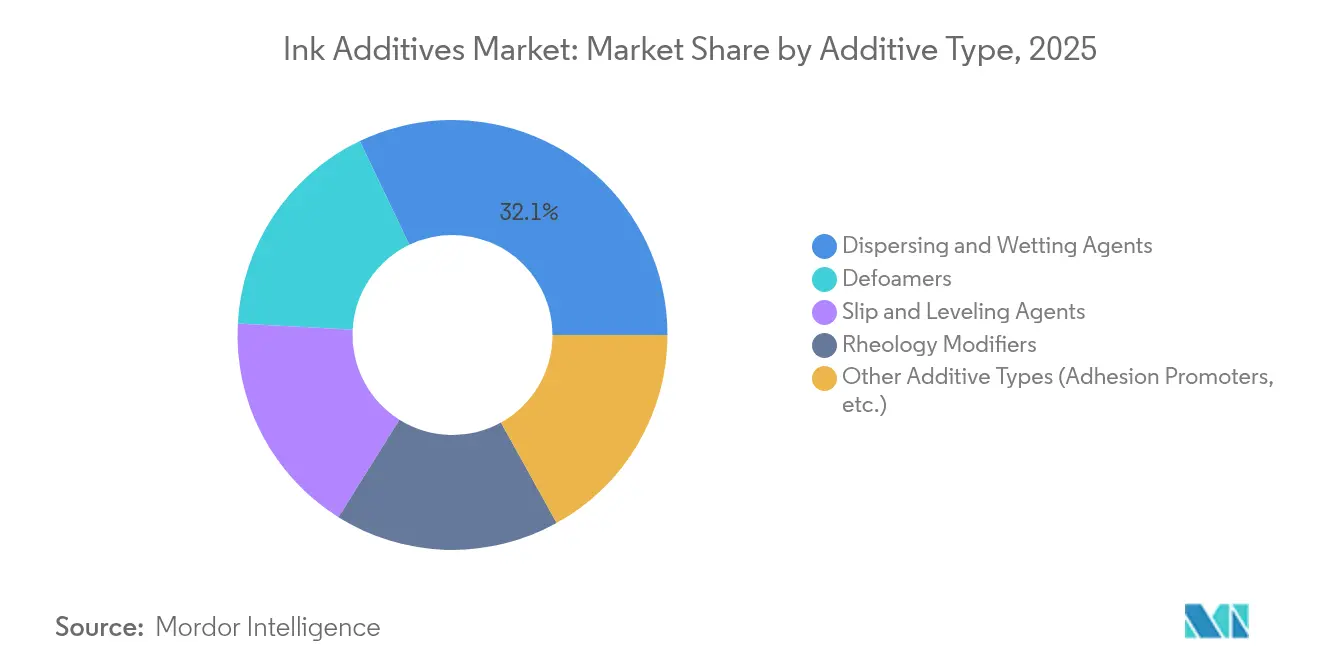
- By additive type, dispersing and wetting agents accounted for 32.10% of the ink additives market size in 2025; specialty modifiers and adhesion promoters are set to advance at 5.74% CAGR during the forecast period.
- By technology, water-based systems held 46.80% of the ink additives market share in 2025, while UV-curable chemistries are projected to grow at 5.62% CAGR through 2031.
- By printing process, the lithographic process accounted for the largest share of 35.05% in 2025; while the digital printing process is projected to grow at the fastest CAGR of 5.86% through 2031.
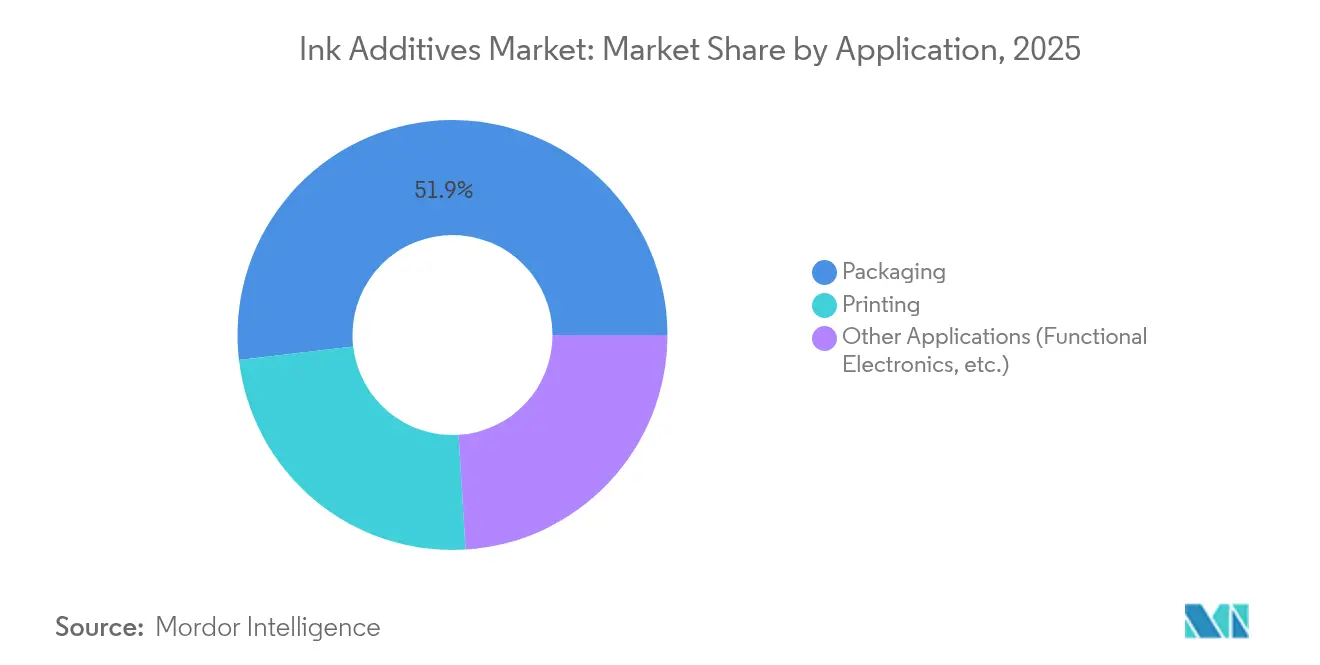
- By application, packaging captured 51.85% revenue share in 2025 and is expanding at a 5.83% CAGR to 2031.
- By geography, Asia-Pacific commanded 46.10% of global revenue in 2025 and is forecast to post a 5.68% CAGR to 2031.
Note: Market size and forecast figures in this report are generated using Mordor Intelligence’s proprietary estimation framework, updated with the latest available data and insights as of 2026.
Market Trends and Insights
Drivers Impact Analysis of Ink Additives Market*
| Driver | (~) % Impact on CAGR Forecast | Geographic Relevance | Impact Timeline |
|---|---|---|---|
| Growing demand from packaging converters | +1.2% | Global, with APAC and North America leading | Medium term (2-4 years) |
| Surge in e-commerce corrugated volume | +0.9% | Global, concentrated in urban markets | Short term (≤ 2 years) |
| Regulatory push toward water-based and UV-curable systems | +0.8% | Europe and North America primary, APAC following | Long term (≥ 4 years) |
| Adoption of functional and smart-packaging inks | +0.7% | North America and Europe early adoption, APAC scaling | Medium term (2-4 years) |
| Digital textile-printing penetration | +0.4% | Global, with Asia-Pacific manufacturing focus | Long term (≥ 4 years) |
| Source: Mordor Intelligence | |||
Growing Demand from Packaging Converters
Converters are specifying additives that maintain print density and adhesion across multilayer films, paper-poly laminates, and metallized foils. BASF expanded its Joncryl and Acronal Pro waterborne dispersion line in the Netherlands to address food-grade flexibles that require low-migration profiles. Larger converter groups also insist on batch-to-batch consistency to support automated inspection lines, pushing suppliers toward high-purity raw materials and tighter production standards. Investments in closed-loop colour management and augmented-reality job set-up further underscore the need for additives that remain stable under variable press speeds, humidity, and temperature. The expected rise in global packaged-goods demand through 2030 therefore secures a long runway for premium additive chemistries.
Surge in E-commerce Corrugated Volume
Direct-to-consumer brands treat the shipping box as a marketing canvas, driving higher ink laydown and demanding rheology modifiers able to maintain jetting stability in high-viscosity inkjet formulations. Laboratory studies show up to 67% higher colour density on coated white-liners when high-solids dispersants are used, without nozzle clogging. Urban fulfilment centres favour inventory-friendly inks with extended pot life, encouraging anti-settling packages that resist phase separation after weeks of storage. Functional inks that embed QR codes, freshness indicators, or anti-counterfeit features are emerging, requiring conductive or luminescent additives previously uncommon in corrugated workflows.
Regulatory Push Toward Water-based and UV-curable Systems
The EU added UV-328 to the persistent organic pollutants list in February 2025, accelerating reformulation away from legacy UV synergists[1]SGS SA, “EU Adds UV-328 to POPs Regulation,” sgs.com. Evonik introduced rhamnolipid biosurfactants tailored for water-based inks that match pigment wetting performance formerly supplied by solvent-borne dispersants. UV-LED curing reduces energy consumption by up to 65% versus conventional mercury lamps, giving converters both a cost and sustainability incentive. In North America, large brand owners now score suppliers on carbon-footprint metrics, making compliant additives a competitive differentiator.
Adoption of Functional and Smart-Packaging Inks
Conductive silver inks require dispersants that reach electrical conductivities near 1 × 10^5 S/m while preventing particle agglomeration. RFID and near-field-communication tags printed on flexible polyolefin films need adhesion promoters that form durable bonds without impeding antenna performance. Carbon-based gas-sensing layers embedded in meat packaging demand rheology control so printed circuits remain responsive after thermoforming. These hybrid requirements—printability plus electronic function—are unlocking new revenue niches for specialty additive suppliers ready to co-engineer solutions with electronics integrators.
Restraints Impact Analysis of Ink Additives Market*
| Restraint | (~) % Impact on CAGR Forecast | Geographic Relevance | Impact Timeline |
|---|---|---|---|
| Stringent food-contact and VOC regulations | -0.8% | Global, with Europe and North America most restrictive | Long term (≥ 4 years) |
| Volatile specialty-monomer supply chain | -0.6% | Global, with Asia-Pacific manufacturing concentration | Short term (≤ 2 years) |
| Post-patent commoditization pressure | -0.4% | Global, affecting premium additive segments | Medium term (2-4 years) |
| Source: Mordor Intelligence | |||
Stringent Food-Contact and VOC Regulations
The US Food and Drug Administration continues its case-by-case approach to ink components, lengthening approval cycles and raising compliance costs for smaller suppliers. Switzerland’s 2024 revision of its inks ordinance removed the provisional list of unevaluated substances, forcing formulators to rely on pre-approved chemistries only. The EU will tighten CMR substance restrictions under REACH Annex XVII in September 2025, compelling another wave of reformulations. VOC caps differ by state in the US and by member state in the EU, thereby complicating product-line rationalisation. Large multinationals exploit in-house regulatory teams to navigate these rules, whereas regional players face higher relative testing costs, constraining innovation pipelines.
Volatile Specialty-Monomer Supply Chain
Severe caustic-soda shortages in early 2025 ripple into pigment dispersant and defoamer production, prompting suppliers to model dual sourcing and carry higher safety stocks. Polyvinyl-alcohol pricing fell across major regions in Q1 2025, eroding inventory values and squeezing margins. Nitrocellulose prices diverged, with Asia recording premiums due to tight inventories while Europe remained flat. Additive producers must hedge feedstock exposure or risk sudden margin erosion, particularly when long-term contracts fix ink prices with converters.
*Our forecasts treat driver/restraint impacts as directional, not additive. The impact forecasts reflect baseline growth, mix effects, and variable interactions.
Ink Additives Market Segment Analysis
By Additive Type:
Dispersing Agents Drive Performance InnovationDispersing and wetting agents represented 32.10% of revenue in 2025, underscoring their pivotal role in colour development and long-term stability. BASF’s Efka PX and Dispex Ultra PX lines improve transparency and lower mill-base viscosities, reducing energy consumption during grinding. Clariant’s Dispersogen range covers organic, inorganic, and carbon pigment classes, enabling formulators to build universal systems for multi-substrate workflows. Defoamers remain vital during high-speed mixing and flexographic printing, where micro-bubble entrapment causes defects. Slip and levelling agents enhance wetting on low-surface-energy films such as BOPP, while rheology modifiers from BYK deliver anti-settling benefits across the full shear profile. Specialty modifiers and adhesion promoters are the fastest-growing sub-group at 5.74% CAGR as smart-packaging, high-temperature ceramics, and outdoor signage demand tailored performance. Developments in ionic-liquid and hyper-branched-polymer additives show promise for next-generation water-based systems.



By Technology:
Water-based Systems Lead Sustainability TransitionWater-based chemistries commanded 46.80% share in 2025, driven by low-VOC regulations and lower fire-insurance costs in pressrooms. BASF’s scale-up of waterborne resin capacity in the Netherlands emphasises the commitment to food-grade, odour-neutral platforms. Solvent-based inks remain essential in automotive interiors, cable marking, and industrial coding where chemical resistance eclipses environmental concerns. UV-curable formulations—growing at 5.62%—offer instant curing, smaller press footprints, and reduced energy use with LED-UV lamps. Suppliers now introduce tin-free photoinitiators and APEO-free dispersants to meet tightening endocrine-disruptor guidelines. Hybrid chemistries that merge UV and electron-beam curing address high-opacity white layers on shrink sleeves and retort-able pouches, bridging performance gaps between existing technologies.
By Printing Process:
Digital Growth Challenges Lithographic DominanceLithography retained 35.05% of 2025 volume thanks to its cost efficiency on long runs and mature supply ecosystems. Ink additives for offset systems remain heavily standardised, focusing on emulsification control and fountain-solution compatibility. Digital printing grew at 5.86% CAGR, buoyed by demand for on-demand labels, personalised corrugated shippers, and short-run textile transfers. High-viscosity inkjet inks, when paired with bespoke rheology modifiers, deliver vivid solids without sacrificing nozzle open-time. Flexography dominates flexible packaging but now incorporates water-based and UV-flexo formulations that lower environmental impact. Gravure remains strong in high-volume décor and laminates where cylinder cost amortises over millions of linear metres. Electrohydrodynamic printing for micro-electronics uses nanomaterial composite inks requiring surfactants that also support electrical conductivity.
By Application:
Packaging Dominance Reflects E-commerce GrowthPackaging led with 51.85% share in 2025 and continues as the fastest-expanding application at 5.83% CAGR. Corrugated board benefits from flow-and-levelling packages that maintain legibility after die-cutting and folding. Flexible packaging pushes adhesion promoters to bond inks onto co-extruded barrier structures without primer. Food packaging drives the migration-tested segment of the ink additives market, compelling suppliers to certify each component under multiple jurisdictions. Smart features, from QR codes to time-temperature indicators, require conductive or luminescent additives that do not hinder standard graphics. Publication, commercial graphics, and specialty markets such as ceramics and glass still rely on high-temperature or solvent-resistant systems but collectively grow slower as digital consumption rises.
Geography Analysis
APAC Ink Additives Market
Asia-Pacific dominated the ink additives market with 46.10% revenue in 2025 and is forecast to exhibit a 5.68% CAGR to 2031. China’s GB 4806.14-2023 standard for food-contact inks is reshaping additive portfolios toward low-migration, benzophenone-free systems. Southeast Asian nations invest in specialty-chemical capacity, and local governments extend tax incentives for green-chemistry projects, fostering regional self-sufficiency. India’s prohibition of toluene in printing inks continues to steer demand toward water-based formulations, while Japan’s stringent toxics control drives premium additive uptake.
North America Ink Additives Market
North America remains technologically advanced and compliance-focused. Washington State’s proposal to restrict several ink classes underscores mounting environmental scrutiny. The US Environmental Protection Agency listed Pigment Violet 29 under Toxic Substances Control Act evaluation, compelling proactive risk assessments across pigment dispersant packages. Canadian brand owners emphasise recyclable mono-material packaging, prompting demand for additives that promote delamination-free separation.
Europe Ink Additives Market
Europe consistently leads sustainability regulation. The EU’s Zero-Pollution Action Plan targets mineral-oil-based inks, and Germany’s market share in eco inks already exceeds 15%. France’s impending 2025 ban on mineral-based inks spurs rapid migration to plant-based and UV-LED systems, escalating demand for bio-based dispersants and renewable-resource defoamers. Nordic countries, long proponents of cradle-to-cradle certification, offer niche opportunities for ultra-low-migration additive packages that command price premiums.
LATAM and MEA Ink Additives Market
Latin America and the Middle East & Africa represent smaller but rising markets. Regulatory frameworks are less mature, yet global brand owners require harmonised formulations, creating pull-through for compliant additives. Infrastructure investment in flexible packaging manufacturing in Mexico and Turkey augments regional demand. South Africa’s adoption of extended producer responsibility schemes for packaging could accelerate the shift to water-based inks, boosting additive uptake in the region.

Regulatory Landscape
Regulation for ink additives is shaped by chemical-control and food-contact frameworks, with Europe setting many of the practical benchmarks for printing inks used in packaging. EuPIA moved several industry controls forward in 2026, publishing its 1st Edition Charter on raw material selection and exclusion for printing inks and related products (March 2026) and issuing a PFAS information note tied to the Packaging and Packaging Waste Regulation (PPWR) context (April 2026), including packaging-level compliance for food-contact applications effective August 12, 2026. Separately, EuPIA members adopted the 5th version of the Good Manufacturing Practice (GMP) guidelines for printing inks for food contact materials effective January 1, 2026, which raised documentation and process-control expectations for additive suppliers and ink formulators serving food packaging.
National measures also influence formulation and sourcing decisions. Germany's Printing Ink Ordinance transition period for compliance with positive lists was extended to December 31, 2026, providing a defined window for additive substitution, supplier declarations, and migration testing. In the United States, oversight continues under EPA TSCA obligations, including the TSCA Inventory Reset rule finalized in 2024 that requires recurring active substance declarations on a five-year cadence, adding ongoing administrative load for importers and chemical manufacturers supporting global ink additive portfolios.
Value Chain Analysis
The ink additives value chain starts with upstream feedstocks and intermediates (petrochemical derivatives and specialty chemistries used for surfactants, dispersants, defoamers, slip agents, and rheology modifiers), then moves through additive manufacturers and blenders, to printing ink formulators, and finally to converters and end users in packaging, publication, and specialty printing. Trade bodies and associations such as NAPIM, CEPE, EuPIA, and AIPIMA act as coordination points for technical guidance, compliance communication, and industry advisories that shape purchasing and reformulation priorities.
Recent dynamics focus on raw material volatility and logistics risk that feed into additive pricing and lead times. AIPIMA issued a March 2026 advisory highlighting cost escalation in key solvents and resins (including toluene, MEK, ethyl acetate, and acrylic resins), reflecting how freight availability and transit constraints pressure ink and additive cost structures. Ink and additive producers are responding with dual sourcing, higher safety stocks of critical components, and contract mechanisms such as raw material escalation clauses, while also managing shortages and pricing pressure in constrained inputs (for example, nitrocellulose availability tightening amid competing industrial demand).
Competitive Landscape
The ink additives market is moderately fragmented with top players combining broad chemistries, global supply chains, and regulatory expertise. ALTANA reported EUR 1.64 billion in H1 2024 sales, dedicating 6% to R&D and acquiring pigment specialist Silberline to deepen effect-ink capabilities. BASF upgraded waterborne resin capacity and leverages backward integration in raw materials to buffer against monomer volatility. Clariant completed its PFAS-free transition in December 2023 and markets its dispersants under a single global portfolio for streamlined compliance. Evonik positions biosurfactant platforms as drop-in replacements for solvent-based wetting agents.
Strategic moves cluster around sustainable innovation: bio-based platforms, mineral-oil-free metallics, and next-generation photoinitiators free of endocrine-disruptor labels. Midsize specialists focus on functional electronics; for example, Henkel collaborates with flexible-circuit producers to develop print-friendly silver-flake dispersants. AI-driven supply-chain monitoring helps majors anticipate feedstock disruptions, while digital customer portals deliver real-time rheology data, cementing stickiness with converters.
Emerging challengers include start-ups offering enzyme-based defoamers and nanocellulose rheology modifiers, often partnering with universities for rapid pilot-line validation. Large customers increasingly sign multi-year innovation agreements that bundle additive supply with joint-development roadmaps, locking in volume and discouraging spot-market entry by generics.
Ink Additives Industry Leaders
BASF
Evonik Industries AG
ALTANA
Elementis PLC
Dow
- *Disclaimer: Major Players sorted in no particular order
Ink Additives Market Companies Covered in this Report
- ALTANA
- Arkema
- artience Co., Ltd.
- BASF
- Clariant
- Croda International Plc
- DIC Corporation
- Dorf Ketal
- Dow
- Elementis PLC
- Evonik Industries AG
- Hubergroup Deutschland GmbH
- Huntsman International, LLC
- K-TECH (INDIA) LIMITED
- Michelman, Inc.
- Shamrock Technologies
- The Lubrizol Corporation
- Venator Materials PLC

Market Opportunities and Future Outlook
A key opportunity area is reformulation and raw material substitution aligned with food-contact and broader packaging sustainability requirements, where additive packages need to deliver low migration, low odor, and consistent performance across increasingly diverse substrates. EuPIA's 2026 Charter on raw material selection and exclusion and its April 2026 PFAS note in the PPWR context increase the need for PFAS-free or non-intentionally added PFAS positioning, stronger supplier declarations, and more robust value-chain communication. The window created by the German Printing Ink Ordinance transition extension to December 31, 2026 also supports targeted conversion programs for additives used in packaging inks that must align with positive lists and migration constraints.
Technology-driven whitespace is most visible in UV-curable and digital workflows that require higher-performance dispersing, wetting, and stability solutions at lower VOC footprints. Evonik's January 2026 launch of TEGO Dispers 695, a solvent-free, 100% active hyperdispersant for radiation-curing and solventborne polyurethane inks, points to ongoing product development aimed at pigment dispersion efficiency and formulation stability in demanding systems. On the demand side, consolidation and capacity additions in packaging inks expand the addressable base for additive suppliers that can qualify into large platforms, including Siegwerks' June 2026 acquisition of Hi-Tech Inks in India and the associated expansion of production sites, which can accelerate harmonized additive approvals across multiple plants and packaging-ink product lines.
Recent Industry Developments in Ink Additives Market
- May 2026: BASF launched Efka PX 4720 at the American Coatings Show (May 5 to 7). The product extends BASF's dispersant offering for high-performance formulations where pigment wetting and stability are critical, supporting additive differentiation as converters pursue higher color consistency and productivity across industrial and packaging-related applications.
- May 2025: Evonik introduced four AERODISP particle dispersions (SiO2/Al2O3) designed to enhance inkjet ink receptive coatings. The move strengthens Evonik's position in digital printing value chains where surface engineering and controlled dot shape are tied to print quality and throughput, increasing pull-through for compatible wetting and dispersing additive packages.
- November 2024: BASF opened a new production line in Heerenveen, Netherlands, to increase capacity for Joncryl and Acronal Pro water-based polymers used in sustainable food packaging inks. This capacity addition supports shorter lead times and improved supply security for water-based, low-odor, low-migration systems, tightening integration between resin platforms and downstream ink additive selection.


Ink Additives Market Report Scope and Research Methodology
Market Definition and Coverage
The ink additives market is defined as the value of chemical additives used in printing ink formulations to adjust print performance, stability, and processing across major printing technologies and end uses. Revenues are counted at the point of additive sale.
Scope exclusions: This sizing excludes finished printing inks, printing equipment, and raw pigments and resins sold without an additive function.
Segments Covered in This Report
- By Additive Type
- Dispersing and Wetting Agents
- Defoamers
- Slip and Leveling Agents
- Rheology Modifiers
- Other Additive Types (Adhesion Promoters, etc.)
- By Technology
- Water-based
- Solvent-based
- UV Curable
- Other Technologies (Oil-based, Hybrid)
- By Printing Process
- Lithographic
- Flexographic
- Digital
- Gravure
- Other Printing Process (Screen , etc)
- By Application
- Packaging
- Corrugated
- Flexible
- Food
- Printing
- Ceramics
- Glass
- Paper
- Plastics
- Other Applications (Functional Electronics, etc.)
- Packaging
- By Geography
- Asia-Pacific
- China
- Japan
- India
- South Korea
- ASEAN Countries
- Rest of Asia-Pacific
- North America
- United States
- Canada
- Mexico
- Europe
- Germany
- United Kingdom
- France
- Italy
- Spain
- Russia
- NORDIC Countries
- Rest of Europe
- South America
- Brazil
- Argentina
- Rest of South America
- Middle East and Africa
- Saudi Arabia
- South Africa
- Rest of Middle East and Africa
- Asia-Pacific
Data Sources, Market Sizing, and Validation
Desk Research
For desk research, we first map where ink additives are consumed and how demand moves with printing and packaging activity. Public references such as US Census Bureau manufacturing data, UN Comtrade trade statistics, Eurostat industrial indicators, and the International Trade Centre trade maps help frame volumes, import dependence, and regional production footprints. We also use sources such as EPA and ECHA documents to understand compliance-driven formulation shifts, especially where VOC rules and chemical registrations influence additive choices.
After that, we review company annual reports, investor presentations, and association publications related to printing and packaging to map product portfolios and typical application areas. We check patent databases to see where dispersion, defoaming, or slip technologies are being emphasized, then translate those observations into assumptions on mix change. Where needed, paid subscriptions for company financials and news, patent intelligence, and shipment-level trade data are used to cross-check totals and reduce missed players. These desk research sources are illustrative and not exhaustive, since many other public references were used for data collection, validation, and clarification.
Primary Interviews and Surveys
Primary work is used to pressure-test what desk research cannot confirm cleanly, mainly the share of additives within an ink formulation and the pace at which water-based and UV-curable systems are taking share by region. We spoke with additive suppliers, ink formulators, distributors, and downstream print buyers to confirm pricing behavior, purchasing cycles, and which performance needs are truly driving specifications (for example, wetting, foam control, rub resistance, and slip). Coverage was balanced across APAC, EMEA, and the Americas so regional differences in packaging growth and regulation could be reflected in the final model.
Distribution of primary research fieldwork respondents
| Company type | Respondent position | Region |
|---|---|---|
| Top tier: 31% | CXOs: 12% | APAC: 42% |
| Mid tier: 51% | Functional/Unit leaders: 28% | EMEA: 37% |
| Smaller Players: 18% | Managers: 60% | Americas: 21% |
Market-Sizing & Forecasting
Sizing starts with a top-down build where printing activity and packaging output are used to reconstruct ink demand, which is then translated into additive demand using typical treat-rate ranges and formulation mix by technology. Since treat rates vary by ink system, we adjust using variables such as the share of water-based versus solvent-based inks, UV and LED-UV penetration in labels and packaging, packaging print volume growth, and regulation-linked substitution away from higher-VOC systems. Price assumptions are guided by observable raw material cost direction and by interview feedback on pass-through timing and contract structures.
The totals are corroborated with selective bottom-up checks, such as rolling up a sample of supplier revenues, validating distributor channel shares, and applying indicative ASP x volume ranges for key additive functions including dispersants, defoamers, wetting agents, and wax or slip additives. Where company disclosures are limited, gaps are handled through peer comparisons within similar product lines and by using import-export signals as a sanity check for smaller markets.
For forecasting, scenario analysis is used because end-use demand can shift with packaging cycles and with fast technology changes. The scenarios are anchored around primary feedback on adoption pace for water-based and UV-curable inks. The final forecast is aligned to realistic constraints, including compliance timelines, equipment changeover speed, and regional differences in printing demand.
Data Validation & Update Cycle
Outputs are validated through multiple checks so the numbers make sense against independent signals. The model is compared with trade flows, published production indicators, and the implied additive-to-ink intensity by region, and then any unusual jumps are reviewed until the driver is clearly explained. If large variances appear versus interview expectations, respondents are re-contacted to confirm whether the issue is mix, pricing, or a scope mismatch.
Before sign-off, a second analyst reviews the key assumptions, the math links, and the year-to-year movements to ensure they are consistent and traceable. Reports are refreshed annually, with interim updates added when material events occur, including regulatory shifts, capacity changes, or sharp feedstock moves. Right before delivery, a final pass is completed so clients receive the most current view available.
Mordor Intelligence's Ink Additives Market Size Versus Other Published Estimates
Published numbers for ink additives do not always match because different studies may group products differently and may also assume different price and mix paths for water-based, solvent-based, and UV-curable inks. Another common reason is the choice of base year and how currency conversion is handled when regional values are aggregated into one global total.
In practice, the largest gaps usually come from scope and treat-rate assumptions, since some estimates fold ink components or broader formulation chemicals into the same bucket, while others apply a single additive intensity across technologies. The spread also widens when faster adoption scenarios are applied to packaging and labels without checking against realistic conversion timelines and regional regulation pressure, which is where the annual refresh and re-contact checks used in this model tend to matter, a modeling choice applied by Mordor Intelligence.
Benchmark comparison
| Source | Market Size | Gaps in Research Methodology |
|---|---|---|
| Mordor Intelligence | USD 2.67 B (2026) | |
| Global Business Publisher A | USD 2.69 B (2026) | Uses a slightly different base-year setup and growth path, and the scope appears to allow a broader inclusion of ink formulation chemicals in some applications, which can lift the total marginally. |
| Industry Commentary B | USD 2.50 B (2025) | Anchors the estimate to a different year and tends to apply a generalized additive intensity without clearly separating technology mix shifts, which can keep the stated value lower. |
Across the table, the difference is small in one case and larger in the other, and it mainly comes down to how narrowly ink additives are defined and how technology mix is translated into demand. By keeping treat rates and mix assumptions explicit and then cross-checking them with trade and interview signals, the final number stays easy to audit and repeat when new data becomes available.


Key Questions Answered in the Report
What is the current Ink Additives Market size?
The ink additives market size stands at USD 2.67 billion in 2026 and is projected to reach USD 3.4 billion by 2031.
What is the expected growth rate for the ink additives market?
The market is forecast to expand at a 4.98% CAGR from 2026 to 2031.
Which application segment generates the most demand for ink additives?
Packaging is the leading application, accounting for 51.85% of global revenue in 2025 and advancing at a 5.83% CAGR.
Which technology segment is growing quickest within the ink additives market?
UV-curable systems show the fastest growth, registering a 5.62% CAGR through 2031 due to energy-efficient, low-VOC curing.
Page last updated on:


 Your data is secure and never sold or shared.


