
Forklift Trucks Market Size and Share
Market Overview
| Study Period | 2019 - 2031 |
|---|---|
| Market Size (2026) | USD 76.62 Billion |
| Market Size (2031) | USD 93.98 Billion |
| Growth Rate (2026 - 2031) | 4.17 % |
| Fastest Growing Market | Middle East and Africa |
| Largest Market | Asia-Pacific |
| Market Concentration | Medium |
Major Players *Disclaimer: Major Players sorted in no particular order Image © Mordor Intelligence. Reuse requires attribution under CC BY 4.0. | |
Forklift Trucks Market Analysis by Mordor Intelligence
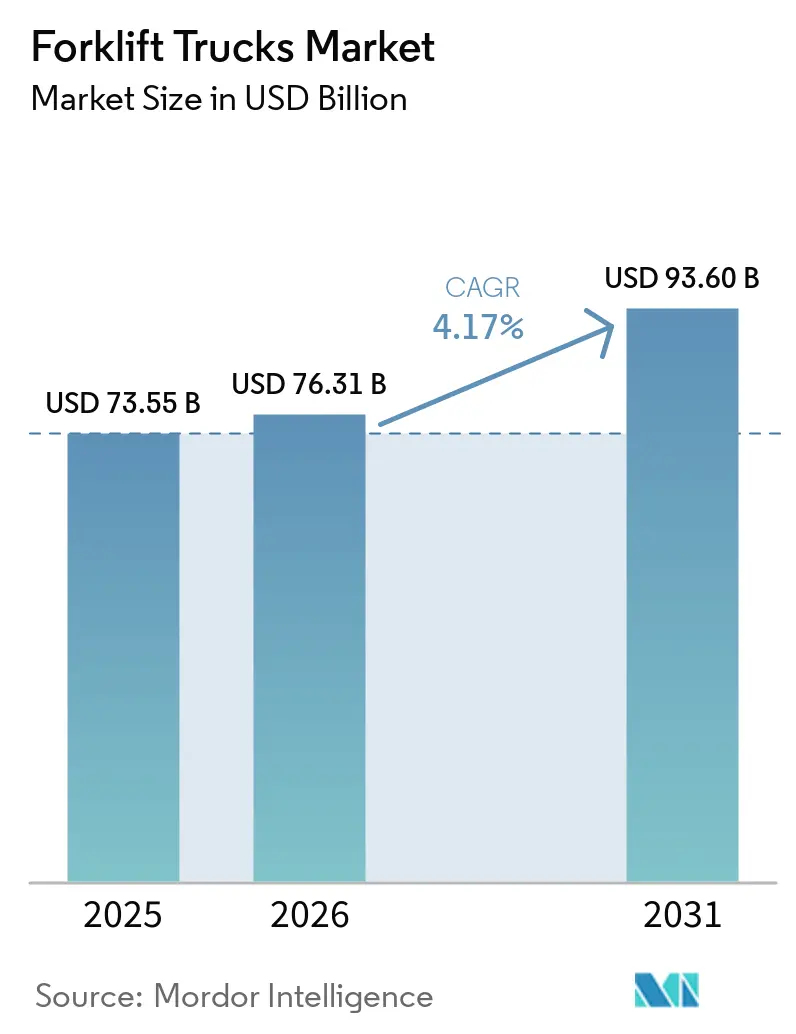
The forklift trucks market size was valued at USD 73.55 billion in 2025 and estimated to grow from USD 76.62 billion in 2026 to reach USD 93.98 billion by 2031, at a CAGR of 4.17% during the forecast period (2026-2031). Momentum stems from the growing preference for electric powertrains, tightening emissions regulations, and the operational savings of lithium-ion batteries, which offer 95% round-trip efficiency. Strong infrastructure outlays in the Asia Pacific, North America’s manufacturing reshoring, and Middle Eastern logistics corridors amplify demand for versatile lift trucks that blend automation readiness with low emissions. Meanwhile, hydrogen fuel-cell pilots in automotive and cold-storage settings, together with falling renewable-hydrogen costs, add a small but rising zero-emission pathway. Competitive pressure is intensifying as Chinese manufacturers deploy aggressive pricing and emerging rental fleets bargain down original equipment manufacturer margins, nudging incumbents toward value-added telematics and service contracts.
Key Report Takeaways
- By powertrain, electric forklifts accounted for 67.73% of the forklift trucks market share in 2025, while Hydrogen Fuel-cell Vehicle (HFCV) is forecast to grow at a 4.19% CAGR through 2031.
- By vehicle class, Class III electric pallet trucks held 43.47% of the forklift truck market share in 2025; Class I electric rider trucks are the fastest-growing at a 4.25% CAGR through 2031.
- By load capacity, the 5 to 15-ton bracket accounted for 41.23% of the forklift truck market share in 2025; the above-15-ton segment posted the strongest CAGR at 4.28% to 2031.
- By end-user, logistics and warehousing commanded 37.88% of the forklift trucks market share in 2025, whereas the food and beverage cold chain leads growth at a 4.22% CAGR through 2031.
- By geography, Asia Pacific dominated, with a 47.63% market share in 2025; the Middle East and Africa delivered the fastest CAGR, at 4.27%, through 2031.
Note: Market size and forecast figures in this report are generated using Mordor Intelligence’s proprietary estimation framework, updated with the latest available data and insights as of January 2026.
Global Forklift Trucks Market Trends and Insights
Drivers Impact Analysis*
| Driver | (~) % Impact on CAGR Forecast | Geographic Relevance | Impact Timeline |
|---|---|---|---|
| Asia Pacific's Emission Mandates | +1.2% | Asia Pacific core (China, India, Japan), spillover to Southeast Asia | Long term (≥ 4 years) |
| North America's Automated and E-commerce Warehouses Expand | +0.8% | North America, spillover to Europe | Medium term (2–4 years) |
| United States Forklift Demand Surges | +0.7% | United States, Canada | Medium term (2–4 years) |
| European Cold-Chain Facilities Embrace Lithium-ion Forklifts | +0.6% | Europe, Nordic countries | Short term (≤ 2 years) |
| Aging Forklift Fleet Replacement Cycle | +0.5% | Japan, South Korea | Short term (≤ 2 years) |
| GCC's Infrastructure Investments | +0.4% | Middle East (United Arab Emirates, Saudi Arabia), North Africa | Long term (≥ 4 years) |
| Source: Mordor Intelligence | |||
APAC's Emission Mandates Propel Electric Forklift Adoption
China mandates zero-emission non-road machines in major cities starting in the near future as part of its Air Pollution Action Plan [1]. India's PM E-DRIVE scheme provides significant funding for charging infrastructure and offers a substantial capital grant for electric forklifts. Japan's working-hour ceiling is driving warehouses to adopt faster-charging lithium-ion fleets. Meanwhile, South Korea's Green New Deal 2.0 aims to achieve a significant share of electric vehicles in commercial fleets within the next decade. Given these converging initiatives, the electric share of the forklift truck market in the Asia-Pacific region is projected to grow significantly in the coming years, outpacing that of Western counterparts.
North America's Automated and E-commerce Warehouses Expand
E-commerce giants are ramping up the deployment of "lights-out" fulfillment centers, seamlessly integrating autonomous mobile robots with advanced warehouse management systems. Amazon's sprawling new facility in Calgary has integrated several FoxBot robotic units, optimizing aisle widths and significantly boosting pallet density [2]. Meanwhile, Walmart's introduction of in-store drones and cleaning robots has not only streamlined operations but also liberated capital for narrow-aisle lift trucks, which now work in harmony with automated racking systems. In a significant move, Prologis has allocated substantial funding for Prologis Labs in 2024, setting the stage to test VisionNav and Multiway's autonomous forklifts at multiple sites across the United States and Europe [3]. These initiatives are poised to drive strong growth in Class I and Class II electric units over the next few years, even as the broader forklift truck market slows. Furthermore, the integration of IoT software and battery analytics platforms is swiftly becoming a standard requirement.
European Cold-Chain Facilities Embrace Lithium-ion Forklifts
Temperature-controlled logistics providers face rising energy costs and stringent EU battery regulations. In 2024, STEF deployed several lithium-ion trucks, significantly reducing warehouse energy consumption and eliminating the need for ATEX ventilation. Under Regulation (EU) 2023/1542, companies must disclose the carbon footprint of batteries and meet substantial lithium recovery targets within the specified timeline. These requirements benefit OEMs with established battery take-back programs. NewCold’s large facility in the Netherlands operates numerous lithium-ion units and uses off-peak charging to reduce per-pallet costs compared with lead-acid alternatives. For high-throughput cold storage operations, this strategy has reduced payback periods to a few years, strengthening lithium-ion technology’s position in the forklift truck market.
Aging Forklift Fleet Replacement Cycle in Japan and South Korea
Japan is witnessing increased demand for equipment replacement, as a significant share of its installed lift-truck fleet is more than a decade old. South Korea’s domestic electric vehicle investment plans are accelerating lift-truck fleet renewal across battery and vehicle manufacturing plants, with substantial new unit additions expected in the coming years. The market is increasingly favoring telemetry-enabled lithium-ion trucks that integrate seamlessly with Industry 4.0 maintenance protocols.
Restraints Impact Analysis*
| Restraint | (~) % Impact on CAGR Forecast | Geographic Relevance | Impact Timeline |
|---|---|---|---|
| Electric Forklift's High Upfront Cost Hinders Adoption | -0.9% | Global, acute in emerging markets | Short term (≤ 2 years) |
| Europe and Nordics Face Shortage of Skilled Forklift Operators | -0.6% | Europe, Nordic countries | Medium term (2–4 years) |
| OEM Margins Squeeze Amid Fierce Rental-Fleet Competition | -0.4% | North America, Europe | Medium term (2–4 years) |
| Supply Chain Disruptions Hinder Component Availability | -0.3% | Global | Short term (≤ 2 years) |
| Source: Mordor Intelligence | |||
Electric Forklift’s High Upfront Cost Hinders Adoption
Electric trucks, powered by lithium-ion technology, are significantly more expensive than their diesel counterparts. This places electric trucks in a higher price range compared to diesel models. Notably, batteries constitute a substantial portion of the total build cost. In recent years, lithium carbonate prices have shown considerable volatility. Many small enterprises face challenges securing collateral, limiting their access to green financing. While the European Investment Bank's Clean Transport Facility offers highly competitive interest rates, adoption remains low among smaller firms with limited employee numbers. In India, subsidies are available for electric trucks, but they cover only a small fraction of the total fleet, highlighting the limited reach of such incentives. Additionally, until battery pack costs decrease significantly, the adoption of electric forklift trucks will remain constrained, particularly among cost-conscious buyers.
Europe and Nordics Face Shortage of Skilled Forklift Operators
Across Germany, France, and the Nordic countries, the European Commission has identified a critical skills gap in material handling, leaving many positions unfilled. In Norway, a shortage of instructors has led to lengthy waiting periods for obtaining the required certification. Germany has also recorded a notable decline in logistics apprenticeship enrollments in recent years. As wages rise—German operators now earn considerably more than previously—companies are increasingly adopting automation. Despite growth in the forklift truck market, persistent labor shortages may constrain improvements in throughput.
*Our forecasts treat driver/restraint impacts as directional, not additive. The impact forecasts reflect baseline growth, mix effects, and variable interactions.
Segment Analysis
By Powertrain Type: Lithium-ion Batteries Redefine Electric Economics
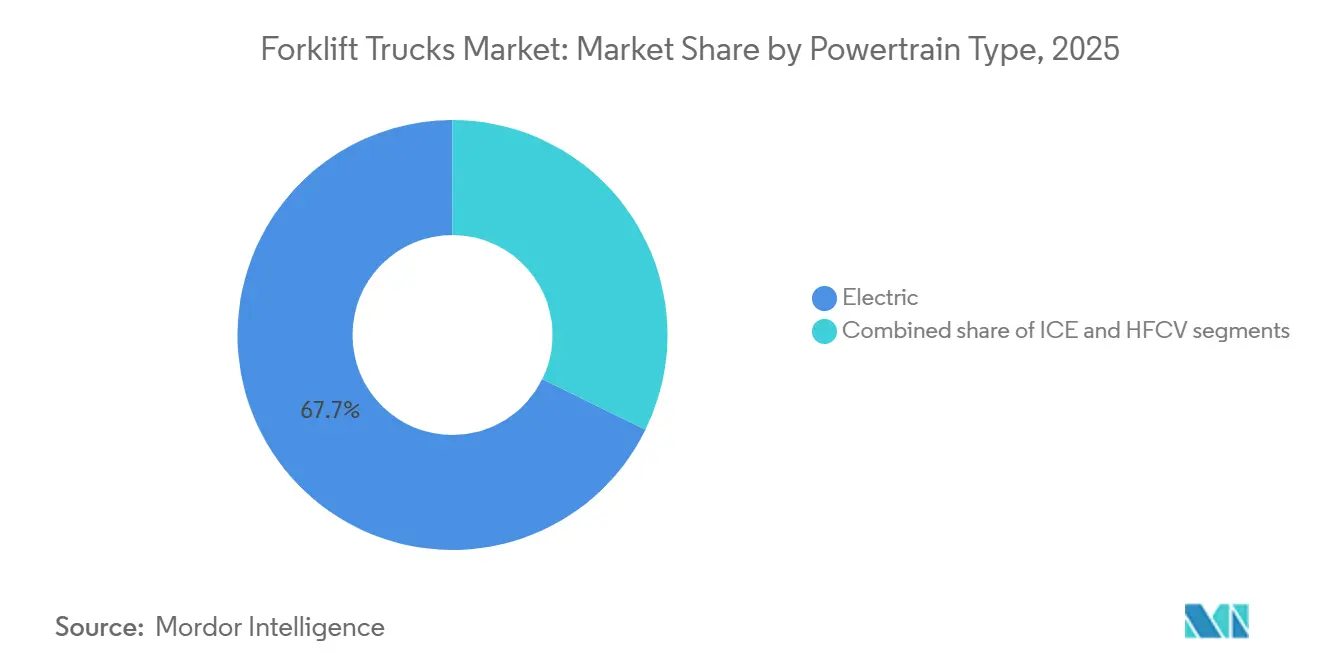
Electric units accounted for 67.73% of the forklift truck market share in 2025, as operators pursued lower lifetime costs. Within the electric segment, lithium-ion packs experienced substantial growth, becoming the dominant choice compared to their position a few years ago. While hydrogen fuel-cell forklifts currently hold a minimal share, they are expected to grow steadily with a robust CAGR of 4.19% through 2031, supported by deployments in key industrial operations. Internal combustion continues to hold a considerable share, primarily serving outdoor and emerging-market applications. The U.S. Department of Energy (DOE) aims to achieve a competitive hydrogen price within the next few years, which could significantly reduce operating-cost differences.
Heavy users in cold storage increasingly prefer hydrogen fuel cells because of their rapid refueling capabilities, which enable uninterrupted multi-shift operations. The forklift truck market is also adapting to declining battery costs, with OEMs gradually phasing out lead-acid batteries in premium models. Hydrogen currently accounts for a very small share of the forklift truck market. However, expanding renewable energy capacity and zero-emission mandates implemented by port authorities are strengthening its position as a viable long-term alternative. Meanwhile, lithium-ion technology is expected to remain the preferred investment option in the near term, supported by established charging infrastructure, telematics integration, and enhanced safety certifications that help reduce insurance risks.

By Vehicle Class: Narrow-Aisle Configurations Drive Class I Growth
Class III pallet trucks accounted 43.47% of the forklift truck market share in 2025, but logged slower growth in saturated retail channels. Class I electric rider trucks are growing at a 4.25% CAGR as e-commerce firms condense aisle widths to 8 feet for greater cube efficiency. Amazon’s Calgary site illustrates the shift by using autonomous riders in narrower corridors. Class II narrow-aisle machines benefit from pharmaceuticals and electronics verticals where high-value SKUs support premium equipment. Class IV and V combustion models held a combined share, indispensable in uneven terrain and heavy construction zones.
Rising demand for agile Class I units indicates a lasting shift in warehouse design. As more facilities integrate mezzanines and automated storage systems, navigation accuracy and battery productivity will become key differentiators for OEMs. By the end of the decade, the Class I forklift truck market is projected to further widen its size gap over Class III equipment.
By Load Capacity: Heavy-Duty Segment Gains from Port Decarbonization
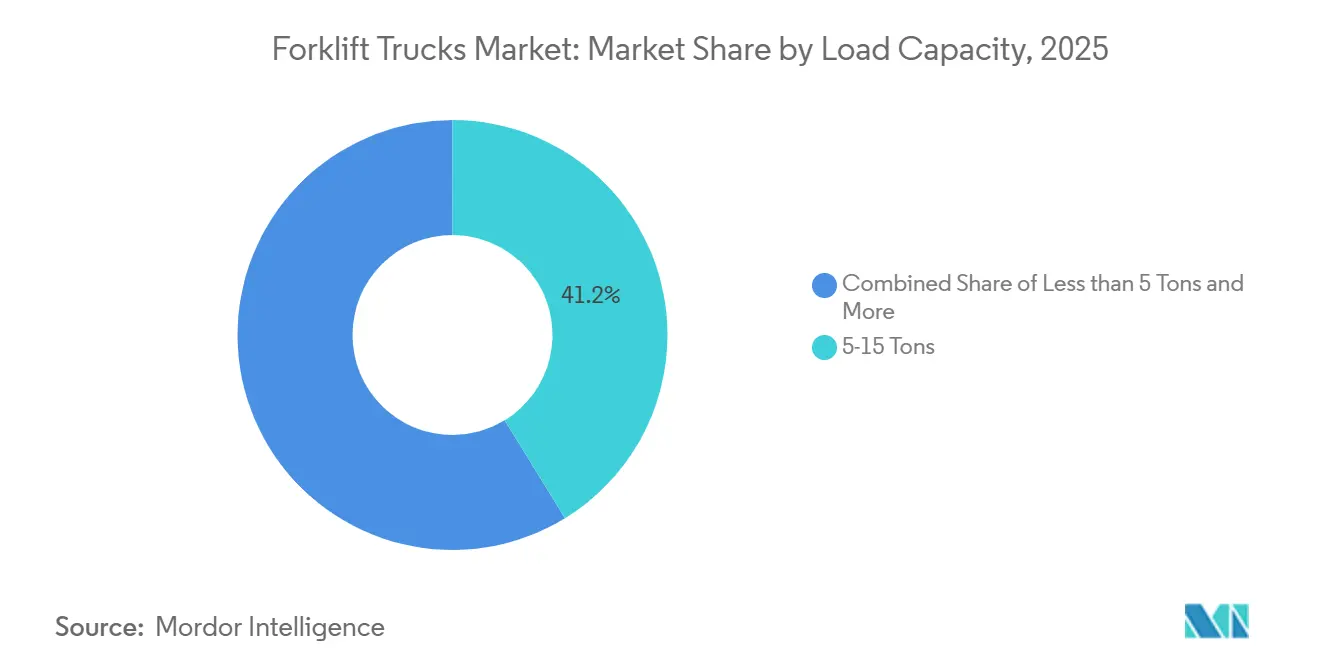
The 5-15-ton segment, which accounts for 41.23% of the forklift truck market share in 2025, remains a versatile workhorse for mid-sized plants. The above-15-ton segment is projected to register the highest CAGR of 4.28% through 2031, driven by California port regulations mandating zero-emission cargo-handling equipment by 2031. Forklifts with capacities below 5 tons are expected to grow slightly below the market average, as manual pallet jacks continue to retain share in small retail operations.
The electrification of ports and intermodal yards is increasing duty-cycle requirements for material-handling equipment, driving the forklift truck market toward larger battery packs, rapid-charging infrastructure, and hydrogen-hybrid solutions. These technologies help operators reduce downtime, maintain productivity across extended operating hours, and mitigate range anxiety during heavy-load operations.
By End-user Industry: Cold-Chain Automation Accelerates Lithium-ion Uptake
Logistics and warehousing still dominate at 37.88% of the forklift truck market share in 2025, driven by 3PL network expansion and automation retrofits. Food and beverage cold chain posts a 4.22% CAGR as lithium-ion chemistry retains 90% of its performance at -30 °C and eliminates battery-room ventilation costs. Manufacturing absorbs some of the annual shipments, with combustion units holding up in outdoor staging areas.
Construction sites in North America and the GCC take minimal volumes, favoring rugged pneumatic-tire diesels. Retail chains convert to Class III electrics that mesh with in-store automation strategies. The Forklift trucks market share for cold-chain applications should edge upward as EU Alternative Fuels Infrastructure rules make facility-wide charging obligatory for sites over 50,000 m2. High-throughput freezer warehouses show paybacks under three years, tipping buyer sentiment toward lithium-ion.
Geography Analysis
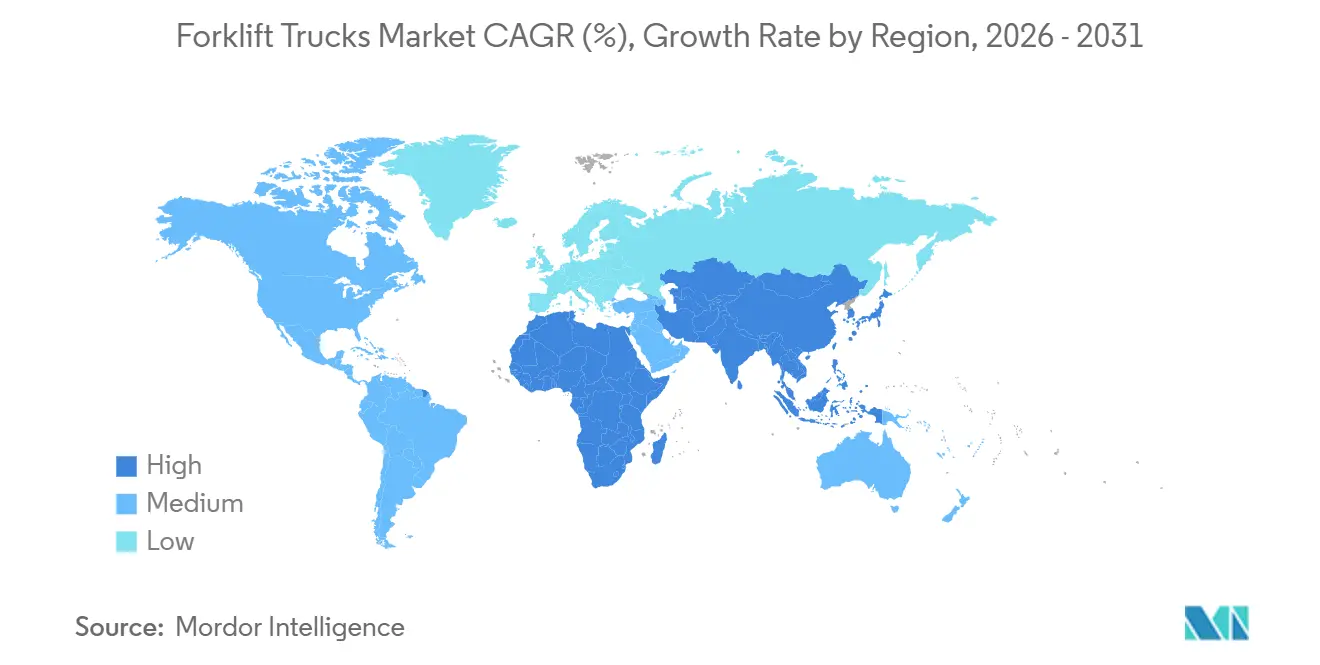
Asia Pacific accounted for 47.63% of the forklift truck market in 2025, driven by China's large production capacity. Domestic manufacturers Hangcha, Heli, and EP exported a significant number of units to Southeast Asia and Africa, competing with traditional suppliers. The region's growth reflects strong industrial activity, expanding logistics networks, and rising e-commerce fulfillment needs. Government investments in manufacturing infrastructure across Vietnam, Indonesia, and India are further supporting demand for both electric and internal combustion forklifts.
India's warehousing expansion, linked to the Production-Linked Incentive program, could increase annual demand by a significant number of units by 2027. The Middle East and Africa, with a 4.27% CAGR, are seeing demand from megaprojects such as King Salman Airport and Jebel Ali's cold-store development. These projects require reliable material handling equipment at scale, making the region an increasingly important growth area for forklift manufacturers.
Europe accounts for a significant share of revenue, driven by the EU Battery Regulation, which is accelerating the adoption of lithium-based solutions. North America records lower volumes but benefits from reshoring initiatives and gigafactory project pipelines that support steady demand for heavy-duty equipment. South America lags in adopting premium electric equipment due to currency volatility; however, localized demand remains strong in Brazil’s grain corridors. Across all regions, the transition toward electrification and automation continues to influence procurement decisions and long-term fleet planning strategies.
Regulatory Landscape
Forklift trucks operate under occupational safety requirements, machinery compliance regimes, and updated expectations for electrified and automated equipment. In the United States, OSHA 29 CFR 1910.178 governs powered industrial trucks, including obligations tied to ANSI B56.1 design provisions and employer duties for operator training and evaluation (with recertification at least every three years). These requirements shape buyer decisions on safety features, documentation, and the structure of training programs.
In Europe, Regulation (EU) 2023/1230 (the Machinery Regulation) replaces Directive 2006/42/EC. It applies from January 20, 2027, raising requirements for technical documentation, EU declaration of conformity, and CE marking for forklift OEMs and importers. Standardization work also continues through ISO, including ISO/DIS 3691-1 (self-propelled industrial trucks) in inquiry as of 2026 and ISO/DIS 3691-4 (driverless industrial trucks) under development as a new edition intended to replace ISO 3691-4:2023. Together, these updates reinforce compliance expectations for connected and autonomous lift trucks.
Value Chain Analysis
The forklift truck value chain begins with upstream raw materials and core subsystems, including steel fabrication, hydraulics, tires, and increasingly electronics (controllers, sensors) and energy storage (lithium-ion battery packs and charging components). OEMs assemble these inputs into Classes I-V configurations, then sell through direct enterprise channels, dealer networks, and integrator routes that bundle trucks with charging, safety, and fleet-management software. Downstream processes typically include commissioning, operator training support, and warranty administration.
Value also concentrates in uptime and lifecycle services, including batteries, telematics-enabled preventive maintenance, and parts logistics, where lead times can be affected by batch production schedules, freight disruptions, and customs friction. The 2026 wave of OEM and technology partnerships reflects a shift from standalone hardware to integrated intralogistics systems: The Raymond Corporation worked with Third Wave Automation to scale AI-enabled automation for lift-truck fleets, Hyundai Material Handling partnered with Matrix Design Group on collision-avoidance integration, and Jungheinrich took a stake in Navflex to strengthen automated loading and unloading capabilities. On the heavy-duty, zero-emission side, Hyster-Yale Nederland BV joined the IntegratR cooperative in early 2026, highlighting how cross-industry collaborations are supporting the adoption of electrified equipment and related infrastructure.
Competitive Landscape
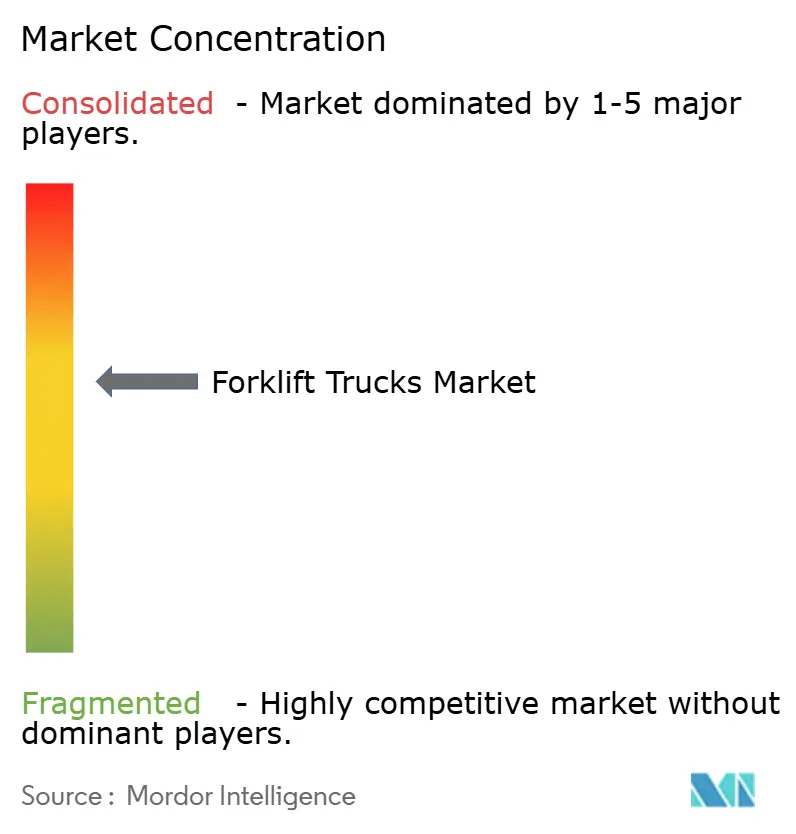
The forklift truck market is moderately concentrated, with Toyota Industries, KION, Jungheinrich, Hyster-Yale, and Mitsubishi Logisnext accounting for a significant share of global revenue. Chinese manufacturers, including Hangcha, Heli, and EP Equipment, have used cost advantages and Southeast Asian expansion to erode established players’ market share. Large rental companies such as United Rentals have also leveraged volume discounts, compressing OEM margins and shifting profits toward service contracts.
Technology stratification is increasing. Toyota and KION use IoT sensors and predictive algorithms to secure long-term maintenance subscriptions, while Linde’s 5G-enabled autonomous model with Maersk reflects a premium technology focus. Chinese manufacturers offer modular battery-swapping units to reduce downtime. VisionNav and Multiway Robotics, supported by logistics pilot programs, are emerging as fully driverless lift truck solutions, offering continuous uptime and improved space efficiency.
Regulatory compliance favors larger players. The EU Machinery Regulation has raised costs for importers without in-house cybersecurity capabilities, while updated ISO standards require autonomous vendors to invest in premium collision-avoidance sensor suites. Consequently, the industry combines cost-driven and technology-centric strategies, challenging mid-tier players.
Forklift Trucks Industry Leaders
-
Jungheinrich AG
-
Toyota Industries Corporation
-
Mitsubishi Heavy Industries Group
-
KION Group AG
-
Crown Equipment Corporation
- *Disclaimer: Major Players sorted in no particular order
Market Opportunities and Future Outlook
Electrification and automation readiness are expanding the addressable whitespace beyond traditional replacement demand, particularly among buyers who prioritize energy efficiency, indoor air quality compliance, and throughput gains. Product and capability roadmaps increasingly favor lithium-ion-first platforms, compact packaging, and connected diagnostics. This aligns with electric trucks already accounting for 67.73% of 2025 shipments and with the move toward telematics and service contracts as rental fleets and large buyers negotiate harder on upfront pricing.
Named capacity and supply-chain actions also create more specific volume pathways and localized sourcing options. In June 2026, Toyota Material Handling reached full production at its expanded Indiana facility after a nearly USD 100 million project initiated in 2024, supporting higher output and faster delivery for North American customers. In Korea, HD Hyundai XiteSolution completed the Ulsan Campus Advancement Project in June 2026 (KRW 93 billion), raising industrial vehicle capacity to 24,000 units annually, and, in July 2026, began rolling out 10- to 18-ton large electric forklift models to meet higher-capacity electrification needs. On battery supply, Hangcha and Manitou announced plans in August 2025 for a Le Mans-based joint venture to produce lithium-ion batteries for industrial vehicles, pointing to efforts to secure battery supply and standardize pack compatibility across forklift portfolios.
Recent Industry Developments
- May 2026: Toyota Material Handling introduced a redesigned Toyota stand-up rider forklift with updates including electric power steering and ergonomic improvements. The launch targets high-cycle warehouse applications where operator comfort and controllability translate into productivity, supporting the ongoing shift toward premium electrics in Class I and related indoor segments.
- March 2026: Toyota Material Handling launched the Toyota Core Diesel Pneumatic Forklift series (4,000- to 6,500-pound capacity) aimed at outdoor industrial and construction applications. This expands coverage in applications where pneumatic tires and diesel power remain preferred, helping fleets balance electrification with duty-cycle and site-condition realities.
Research Methodology Framework and Report Scope
Market Definition and Coverage
For this study, the market covers factory-built forklift trucks used to lift, stack, and move palletized loads in warehouses, yards, plants, and construction sites. Sizing is expressed as OEM revenue from new forklift truck sales in USD.
Scope exclusions: The totals exclude rough-terrain telehandlers, autonomous mobile robots sold without forks, aftermarket parts, rentals, and used-truck sales.
Segmentation Overview
- By Powertrain Type
- Internal Combustion Engine (ICE)
- Electric
- Lead-acid
- Lithium-ion
- Hydrogen Fuel-cell Vehicle (HFCV)
- By Vehicle Class
- Class I (Electric Rider Trucks)
- Class II (Electric Narrow-Aisle)
- Class III (Electric Pallet)
- Class IV (ICE Cushion-Tire)
- Class V (ICE Pneumatic-Tire)
- By Load Capacity
- Less than 5 Tons
- 5-15 Tons
- Above 15 Tons
- By End-user Industry
- Manufacturing
- Logistics & Warehousing
- Construction & Infrastructure
- Retail & Wholesale
- Food & Beverage Cold-Chain
- By Geography
- North America
- United States
- Canada
- Rest of North America
- South America
- Brazil
- Argentina
- Rest of South America
- Europe
- Germany
- United Kingdom
- France
- Italy
- Spain
- Rest of Europe
- Asia-Pacific
- China
- India
- Japan
- South Korea
- Rest of Asia-Pacific
- Middle East and Africa
- United Arab Emirates
- Saudi Arabia
- South Africa
- Turkey
- Rest of Middle East and Africa
- North America
Data Sources, Market Sizing, and Validation
Desk Research
Desk work starts with building a clean fact base on forklift demand pools and supply signals, before any modeling is done. We reference public sources such as national statistics offices, customs and trade portals, and central bank releases to understand industrial output, capital spending, and import flows tied to material handling equipment.
Industry context is then tightened using sources such as ISO and ANSI/ITSDF standards pages, safety and incident publications from bodies such as OSHA, and peer-reviewed engineering and logistics journals that describe truck classes, operating conditions, and electrification trends. We also review annual reports, investor presentations, and press releases to map product mix and pricing direction, and we supplement with paid subscriptions for company financials and intelligence, patent databases, and import-export shipment-level records where it helps validate directionally. These sources are illustrative and not exhaustive, since many other public documents were used to collect, cross-check, and clarify data.
Primary Interviews and Surveys
Primary interviews and surveys are used to sanity-check desk assumptions and to translate market signals into practical inputs like pricing ranges, lead times, and product mix by end use. We spoke with OEM and component-side executives, dealers and rental channel participants (for demand signals only, not for revenue inclusion), and large fleet operators across APAC, EMEA, and the Americas to address gaps in regional adoption and class mix.
Distribution of primary research fieldwork respondents
| Company type | Respondent position | Region |
|---|---|---|
| Top tier: 28% | CXOs: 13% | APAC: 48% |
| Mid tier: 52% | Functional/Unit leaders: 30% | EMEA: 32% |
| Smaller Players: 20% | Managers: 57% | Americas: 20% |
Market-Sizing & Forecasting
Sizing uses a top-down build where production and trade data, combined with class-level demand allocation, are used to reconstruct new forklift truck revenue by region. Once the demand pool is formed, it is converted into value using class and powertrain mix and an average selling price range that is checked with channel feedback.
To keep the model grounded, a few fingerprints are tracked and updated each cycle, including warehouse and logistics capacity additions, manufacturing output indices, construction activity direction, electrification share by class, and typical replacement cycles for fleets. When inputs are patchy for a country, proxies like industrial production growth, import intensity, and installed warehouse space growth are used until primary feedback confirms a more accurate pattern.
Forecasts are then produced using multivariate regression supported by scenario analysis, since end-market drivers do not move in a straight line every year. The driver outlook is reviewed with industry participants so assumptions on price progression, battery adoption, and utilization changes do not drift away from what buyers and sellers are reporting on the ground.
Data Validation & Update Cycle
Outputs are validated through triangulation across independent signals, so the final value does not depend on one dataset or one interview view. We run variance checks across regions, compare year-on-year shifts against macro indicators like industrial output and trade, and then re-check any outliers back to either a source document or a follow-up call.
Before sign-off, the model goes through a multi-step analyst review where assumptions and conversions are inspected, and where any large revision triggers re-contact with selected respondents. Reports are refreshed annually, with interim updates when material events occur, and a final pre-delivery pass so clients receive the latest updated view.
Mordor Intelligence's Forklift Trucks Market Size Compared Against Other Published Estimates
Published market values for forklift trucks can differ even when the topic name looks the same, because firms do not always count the same revenue streams or use the same year assumptions. Differences in whether used units, rentals, and aftermarket are included, along with how pricing is converted into USD, are usually what create the spread.
The table shows a meaningful gap across sources, and in Mordor Intelligence's model the total is tied to OEM revenue from new forklift truck sales only, with rough-terrain telehandlers, rentals, used-truck sales, and parts kept outside scope. Some other estimates appear to blend adjacent equipment or downstream revenues, and they may also apply a stronger price ramp or a different currency timing, which can lift the headline value in the same calendar year.
Benchmark comparison
| Source | Market Size | Gaps in Research Methodology |
|---|---|---|
| Mordor Intelligence | USD 73.55 B (2025) | |
| Global Consultancy A | USD 87.10 B (2025) | Likely broader revenue capture that blends adjacent material-handling equipment and or includes downstream revenue streams like rentals or service in the same total, with less clarity on new-unit-only treatment. |
| Industry Research Desk B | USD 46.10 B (2023) | Uses an earlier base year and may apply a narrower product or geography coverage, and the published view does not clearly separate OEM new-unit revenue from other commercial flows, which makes like-for-like comparison harder. |
Taken together, the spread is mainly explained by scope boundaries and the year and price assumptions sitting under each figure. By keeping the calculation traceable to observable demand drivers, class and powertrain mix, and checked price ranges, the resulting market size is easier to reproduce and to update as conditions change.
Key Questions Answered in the Report
How large is the forklift truck market in 2026?
The forklift trucks market size reaches USD 76.62 billion in 2026 and is forecast to rise to USD 93.98 billion by 2031.
What was the market share of electric forklifts in 2025?
Electric powertrains accounted for 67.73% of the forklift trucks market in 2025.
Which vehicle class is growing the fastest?
Class I electric rider trucks expand at 4.25% CAGR, fueled by narrow-aisle warehouse designs and automation investments.
Why are hydrogen forklift pilots gaining traction?
Hydrogen models refuel in under three minutes and maintain performance in multi-shift cold-storage and port operations, supporting a 4.19% CAGR outlook.
Which region offers the highest market growth through 2031?
The Middle East and Africa post the quickest 4.27% CAGR through 2031 due to large-scale logistics and infrastructure projects in Saudi Arabia, the UAE, and South Africa.