Foam Tape Market Size and Share
Market Overview
| Study Period | 2020 - 2031 |
|---|---|
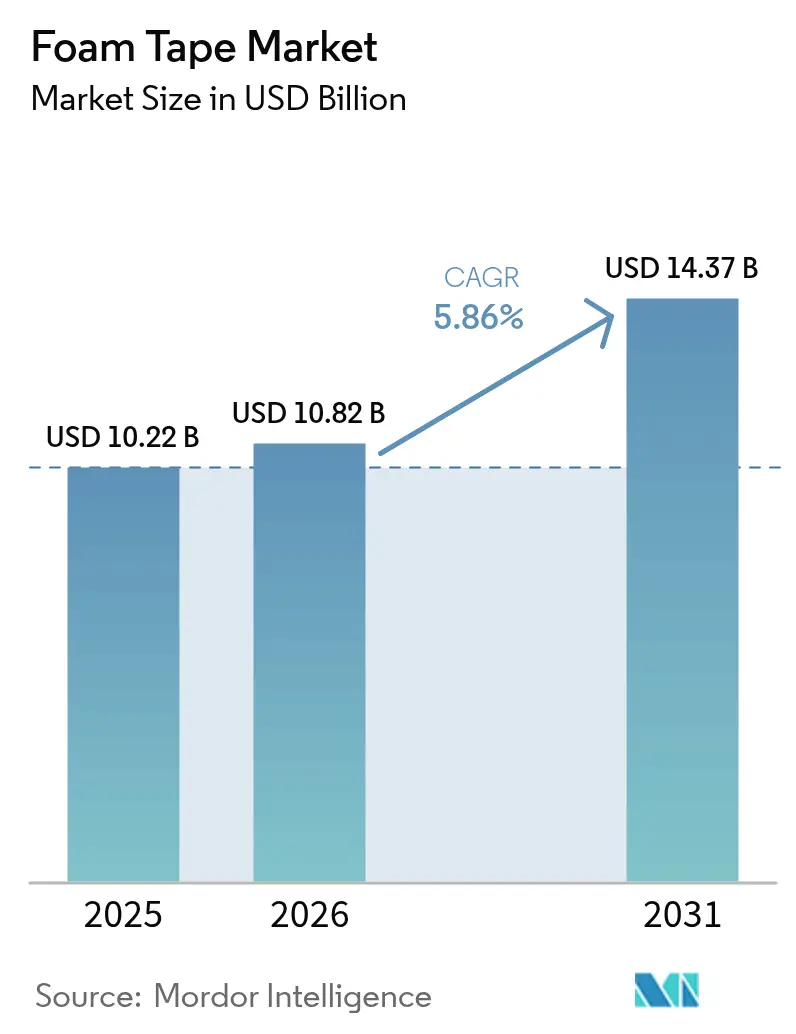
| Market Size (2026) | USD 10.82 Billion |
| Market Size (2031) | USD 14.37 Billion |
| Growth Rate (2026 - 2031) | 5.86% CAGR |
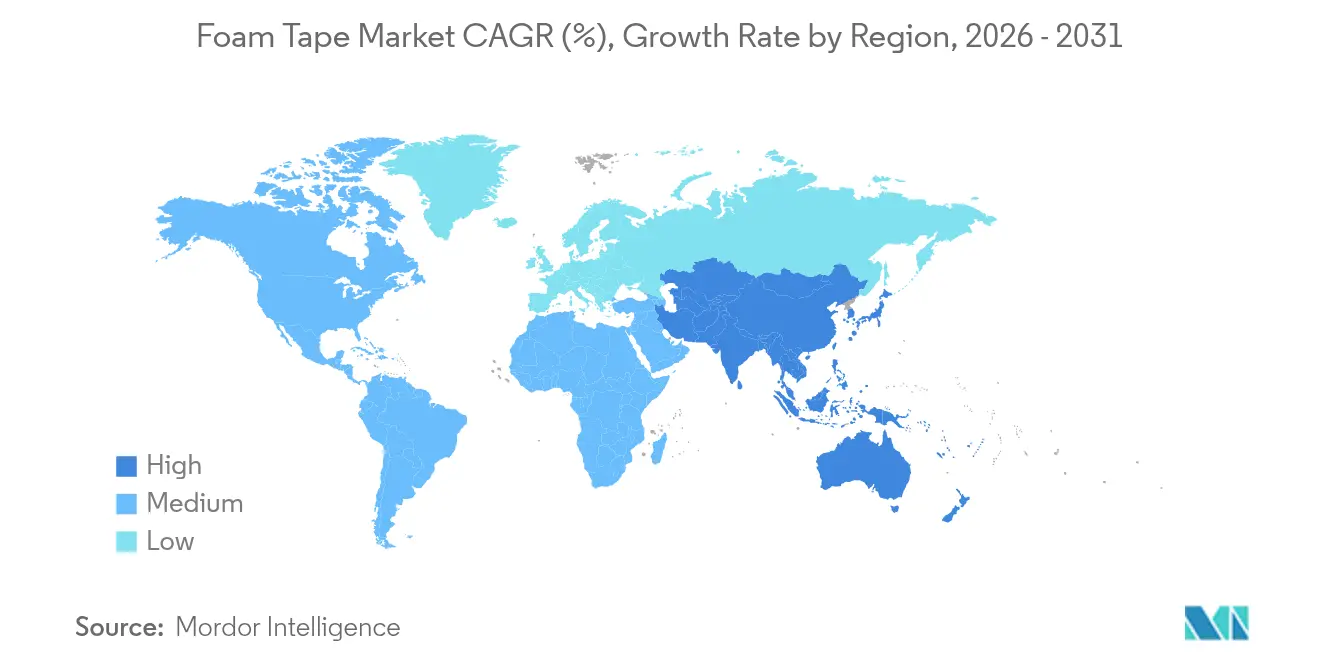
| Fastest Growing Market | Asia Pacific |
| Largest Market | Asia Pacific |
| Market Concentration | Medium |
Major Players *Disclaimer: Major Players sorted in no particular order Image © Mordor Intelligence. Reuse requires attribution under CC BY 4.0. | |
Foam Tape Market Analysis by Mordor Intelligence
The Foam Tape Market size was valued at USD 10.22 billion in 2025 and estimated to grow from USD 10.82 billion in 2026 to reach USD 14.37 billion by 2031, at a CAGR of 5.86% during the forecast period (2026-2031). Electrification in automotive systems, rapid expansion of e-commerce fulfillment centers, and stricter construction codes are raising demand as foam tapes deliver sealing, insulation, and bonding in one material. Asia-Pacific leads with manufacturing scale and local demand, while Europe and North America pull demand upward through retrofit incentives and stringent fire-safety rules. Product design trends now favor hot-melt and solvent-free chemistries to meet low-VOC mandates, and bio-based foams move from niche to growth engines. Competitive focus is shifting from volume to value, with suppliers investing in debondable adhesives, EV battery solutions, and recyclable architectures that support circularity.
Key Report Takeaways
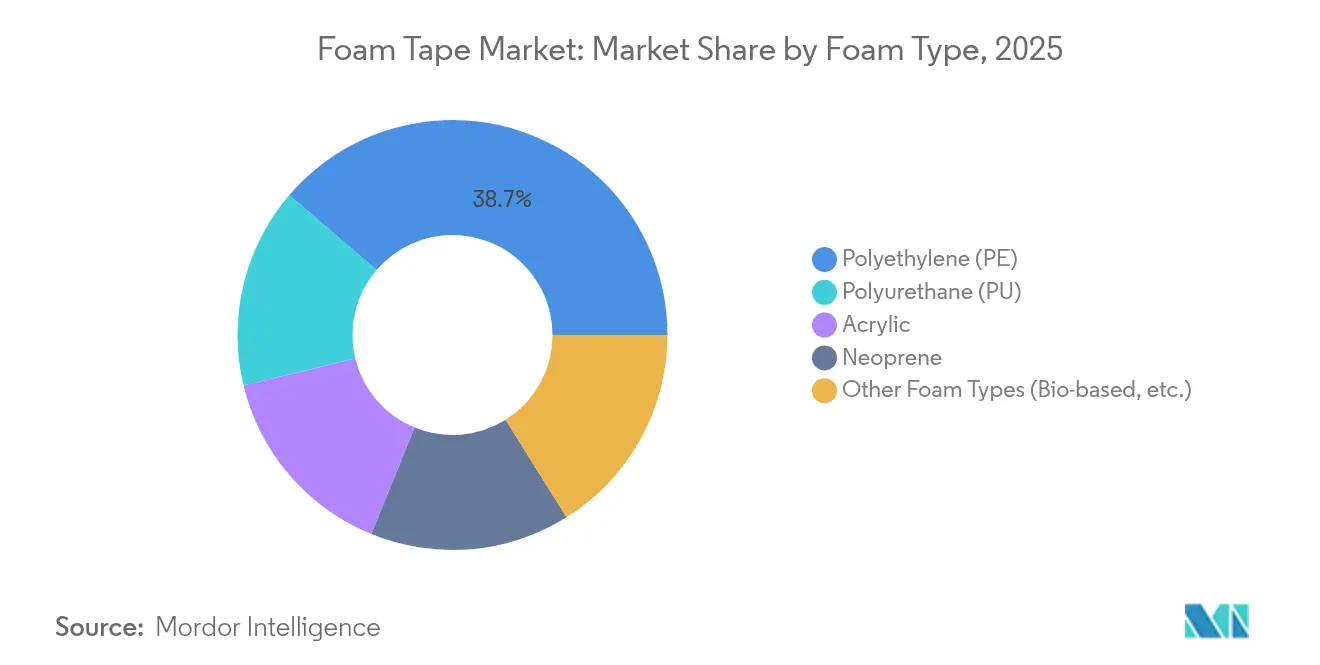
- By foam type, polyethylene retained 38.72% of the foam tapes market share in 2025; Other foam types are projected to expand at a 6.83% CAGR through 2031
- By tape type, single-sided accounted for 61.68% share of the foam tapes market size in 2025; double-sided products are forecast to grow at 7.02% CAGR between 2026-2031.
- By resin, acrylic led with 43.02% revenue share in 2025; silicone resins register the fastest 7.08% CAGR through 2031.
- By technology, solvent-based lines held 47.65% share in 2025; hot-melt solutions rise at 6.64% CAGR to 2031.
- By end-user industry, construction captured 35.05% of the foam tapes market share in 2025; electronics is advancing at a 7.18% CAGR through 2031.
- By region, Asia-Pacific accounted for the largest share of 41.63% in 2025, and is projected to grow at the fastest CAGR of 6.72% through 2031.
Note: Market size and forecast figures in this report are generated using Mordor Intelligence’s proprietary estimation framework, updated with the latest available data and insights as of 2026.
Global Foam Tape Market Trends and Insights
Driver Impact Analysis*
| Driver | (~) % Impact on CAGR Forecast | Geographic Relevance | Impact Timeline |
|---|---|---|---|
| Booming retrofit construction demand | +1.8% | Global, with concentration in North America & EU | Medium term (2-4 years) |
| Rapid e-commerce packaging shift to foam tape | +1.2% | Global, led by Asia-Pacific and North America | Short term (≤ 2 years) |
| Lightweighting push in EV battery pack assembly | +1.5% | Global, with early adoption in China, EU, and North America | Medium term (2-4 years) |
| High-speed automated die-cutting adoption | +0.9% | APAC core, spill-over to MEA | Long term (≥ 4 years) |
| Building-code fire-safety upgrades for façades | +1.1% | North America & EU, expanding to APAC | Long term (≥ 4 years) |
| Source: Mordor Intelligence | |||
Booming Retrofit Construction Demand
Retrofit programs aim for a 73% emission cut in US buildings over twenty years, and foam tapes help close thermal bridges without adding structural load. The Inflation Reduction Act allocates USD 9 billion to low-income retrofit projects, broadening the customer base beyond commercial segments[1]US Department of Energy, “Inflation Reduction Act Building Provisions,” energy.gov. Updated 2024 International Building Code provisions require façade materials to meet tougher flame-spread indices, lifting demand for fire-rated foam tapes. Similar direction in the EU Packaging and Packaging Waste Regulation promotes recyclable insulation systems that enable clean separation during deconstruction[2]European Commission, “Packaging and Packaging Waste Regulation,” europa.eu. The combined policy push positions retrofit as a fast-growing avenue where energy savings, safety, and circularity converge.
Rapid E-commerce Packaging Shift to Foam Tape
Automated fulfillment centers run at high line speeds that reward adhesive solutions over mechanical closures. The global sealing and strapping tapes market reached USD 25.36 billion in 2024, and foam tapes capture share by lowering damage rates in parcel networks. Ahlstrom’s recyclable backings answer retailer mandates for curb-side-recyclable packaging. Superior cushioning versus air-filled dunnage keeps goods secure across temperature swings, a decisive factor while logistics disruptions elevate service-level penalties. The shift is amplified as brands adopt packaging reliability as a hedge against supply chain unpredictability, driving steady uptake of premium foam tapes.
Lightweighting Push in EV Battery Pack Assembly
EV battery packs need thermal, structural, and EMI functions simultaneously, and specialized foam tapes deliver each. Rogers’ ProCell EV Firewall ranges block thermal propagation while trimming weight. tesa’s EV battery tapes remove drilling steps, cutting module assembly time and shaving up to 30% weight. Avery Dennison offers UL 94-rated flame-retardant tapes that mitigate thermal runaway hazards. Vehicle electrification mandates in China and Europe ensure multi-year volume growth, making battery applications a pivotal long-term revenue pillar for the foam tapes market.
High-speed Automated Die-cutting Adoption
Next-generation converting lines apply AI to optimize cutting paths and reduce waste, which requires tapes with tight caliper control and lint-free edges. Dow expanded specialty adhesive capacity to meet these automation-ready specs. Asian converters pair labor-cost advantages with robotics, creating export-competitive production clusters that prefer dimensionally stable foams. Suppliers able to deliver consistent roll-to-roll uniformity win procurement contracts that lock in multi-year volumes, supporting predictable capacity utilization.
Restraint Impact Analysis*
| Restraint | (~) % Impact on CAGR Forecast | Geographic Relevance | Impact Timeline |
|---|---|---|---|
| Volatile isocyanate & petro-feedstock prices | -1.4% | Global, with acute impact in regions dependent on imports | Short term (≤ 2 years) |
| Stringent VOC emissions limits on solvent lines | -0.8% | EU and North America, expanding to APAC | Medium term (2-4 years) |
| Recycling-unfriendly multi-layer foam composites | -0.6% | EU leading, with global adoption of circular economy principles | Long term (≥ 4 years) |
| Source: Mordor Intelligence | |||
Volatile Isocyanate & Petro-feedstock Prices
MDI and TDI costs spiked in early 2024, pushing polyurethane resin prices higher and eroding margins for tape converters reliant on spot purchasing. Automotive demand dropped 25% the same quarter, magnifying margin strain as raw material surcharges met falling volumes. Smaller converters without long-term supply contracts faced cash-flow stress, triggering acquisitions by larger players seeking scale economies. Alliances with feedstock suppliers and R&D into non-isocyanate polyurethanes are under way, but these solutions need multi-year validation, keeping volatility a near-term concern.
Stringent VOC Emissions Limits on Solvent Lines
REACH Annex XVII adds a formaldehyde cap in 2026 that forces re-formulation of solvent acrylics. China’s low-VOC mandates for car interiors create a global compliance bar that all exporters must clear, prompting tesa and peers to launch ultra-low-emission lines. Converting from solvent to water-based or hot-melt chemistries calls for new ovens, chillers, and coaters, lifting capex and production downtime. Large multinationals absorb the cost, but smaller companies may exit commodity niches rather than reinvest, raising market entry barriers.
*Our forecasts treat driver/restraint impacts as directional, not additive. The impact forecasts reflect baseline growth, mix effects, and variable interactions.
Segment Analysis
By Foam Type: Bio-based Innovation Challenges PE Dominance
Polyethylene led the segment with 38.72% share in 2025 thanks to mature supply chains and low cost that satisfy construction and packaging demand. The foam tapes market size for polyethylene equates to USD 3.96 billion in 2025, but growth moderates as regulations drive users toward greener chemistries. Other foam types that include bio-based and specialty formulations expand at a 6.83% CAGR, the highest in the segment mix. Polyurethane variants face headwinds from EU diisocyanate training rules, and this constraint diverts volume into acrylic and silicone options that offer inherently lower hazard profiles.
Bio-based polyurethane derived from corn and castor oil delivers 30-50% lower carbon footprints, and Wanhua’s polyether polyols now meet automotive standards for compression set and shear. Fraunhofer’s FOIM technology, where thin polyurethane foil puffs into foam during lamination, removes isocyanate exposure during production while cutting shipping volume. Academic labs in Minnesota are scaling cashew-shell triblock copolymers that match adhesion strength yet degrade under mild composting conditions. These breakthroughs signal an impending shift, although scale-up economics still favor conventional PE in cost-sensitive jobs.


By Tape Type: Double-sided Applications Drive Premium Growth
Single-sided tapes commanded 61.68% revenue in 2025 relying on their versatility for gasketing, gap filling, and weather stripping. The foam tapes market share for single-sided stands resilient as contractors and OEMs value familiar installation and broad supplier choice. Double-sided tapes, while smaller, post 7.02% CAGR through 2031 on the strength of EV battery modules, façade panels, and electronic bezel bonding where two-way adhesion cuts assembly steps.
Avery Dennison has positioned its EVB tapes to replace rivets in structural attachments, winning design-ins that add USD 5-10 per vehicle. tesa’s Debonding on Demand series allows device repair by releasing with low-heat tools, meeting circular-design guidelines in consumer electronics. Commodity single-sided products remain a price-driven arena, but OEM qualification cycles provide stickiness for premium double-sided lines, offsetting lower absolute volumes with healthier contribution margins.
By Resin Type: Silicone Surge Driven by Thermal Applications
Acrylic resins topped with 43.02% share in 2025 due to balanced adhesion, UV tolerance, and price. Silicone resins accelerate at 7.08% CAGR given their unrivaled heat resistance, which is vital in EV battery packs and power semiconductors operating above 150 °C. Rubber-based adhesives retain a foothold where flexibility and cold-flow properties matter more than high-temperature survival.
DowSil’s TC-3080 curable gel exemplifies silicone’s expansion by combining low viscosity for automated dispensing with 3 W/m·K conductivity. Non-isocyanate polyurethane examines toxicity concerns yet must match acrylic clarity and cost. Hence, resin choice is pivoting from one-size-fits-all toward application-tailored chemistry, reinforcing supplier specialization trends.
By Technology: Hot-melt Gains Momentum from Automation Trends
Solvent-based lines held 47.65% revenue in 2025 backed by entrenched assets and strong bond strength. The foam tapes market size contribution from solvent lines will slip as low-VOC laws bite. Hot-melt CAGR stands at 6.64% through 2031 because 100% solids systems bypass drying ovens and run at higher web speeds. Water-based coatings serve interior applications where odor and VOC thresholds are tight, yet their slower drying limits high-speed lamination.
H.B. Fuller promotes hot-melt grades that cut energy use by 30% and lower freight costs due to solids content. Henkel paired hot-melt with UV-curing, marrying line speed with elevated heat resistance for high-temperature masking tapes. Converters weigh capex versus long-term compliance, yet many retrofit solvent assets with modular hot-melt heads to hedge regulatory risk while preserving sunk investments.
By End-User Industry: Electronics Surge Challenges Construction Leadership
Construction recorded 35.05% share in 2025 as retrofits, façades, and HVAC sealing rely on foam tapes for thermal bridges and fire blocking. Electrical and electronics lines outpace the pack with a 7.18% CAGR, propelled by semiconductor packaging that needs new thermal interface materials and EMI shielding functions. Automotive remains vital due to the metal-to-plastic shift and lightweighting, while aerospace and medical device niches deliver high margin but lower tonnage.
The IC packaging and testing sector will double to USD 137.10 billion by 2034, pulling high-temp tapes into flip-chip and wafer-level encapsulation. UFP Technologies supplies 25 of the top 30 medical device firms with foam components that meet ISO 10993 biocompatibility standards. Biomimetic octopus-suction tapes open new wound-closure avenues, merging medical and industrial know-how into future growth lanes. The downstream mix thus skews toward electronics without eroding construction’s base volume.

Geography Analysis
Asia-Pacific dominated with 41.63% revenue share in 2025 and leads at a 6.72% CAGR to 2031. China accounts for the largest slice through its EV and consumer electronics production hubs, while India supplies double-digit electronics growth supported by the Production Linked Incentive scheme. South Korea and Japan push premium demand in semiconductors and advanced materials. VOC rules in Chinese car interiors accelerated adoption of ultra-low-emission tapes, and these standards ripple into export markets, compelling global suppliers to certify to Chinese thresholds first.
North America shows steady growth underpinned by USD 9 billion in retrofit funding tied to the Inflation Reduction Act. Foam tapes fit window flashing, façade joints, and HVAC ducting upgrades, enabling fast project cycles without heavy gear. Sonoco invests USD 30 million to scale adhesive packaging capacity in Orlando, signaling confidence in regional demand. Near-shoring pushes Mexico to become the fourth-largest polyurethane consumer, offering short-haul supply for US automotive plants. The continent rewards suppliers with UL and NFPA approvals that speed municipal permitting.
Europe balances strict environmental compliance with materials innovation. The diisocyanate training regulation effective in 2023 nudged users toward acrylic and silicone systems. Saint-Gobain’s USD 1.025 billion FOSROC acquisition illustrates consolidation aimed at strengthening construction chemistry portfolios. Germany’s OEMs specify flame-retardant adhesives in lightweight body panels, while France’s aerospace sector demands FST-rated foams for cabin interiors. EU circularity policies enforce recyclability, prompting R&D into mono-material architectures. Export of these sustainable solutions to other continents supports revenue diversification for European headquarters.

Competitive Landscape
The foam tapes market is moderately fragmented. 3M led with USD 24.6 billion total sales in 2024 and invests in debondable acrylic platforms for consumer electronics. Avery Dennison generated USD 8.8 billion and directs its Materials Group toward intelligent labels and EV battery tapes that carry higher margins. tesa files over 50 patents around reversible adhesion to serve repairable smartphones and circular design. Rogers, Nitto Denko, and Saint-Gobain build moats in thermal and fire-safe foams, while regional players specialize in contract converting.
Raw material cost swings trigger vertical integration moves. Dow extends silicone gel capacity, pairing polymer supply with direct tape coating services. Meanwhile Berry Global divested certain specialty tape units to refocus on core films, opening niches for mid-size converters to gain share. Innovation races center on bio-based foams, hot-melt UV chemistries, and in-process fire-barrier additives. Suppliers with global sites hedge geopolitical risk and win multinational sourcing contracts.
M&A is expected to climb as small converters lack capital for VOC-compliant upgrades. Saint-Gobain’s FOSROC deal sets the tone, and private equity interest rises where automation investments can double EBITDA in three years. Winners will align product lines with EV, electronics, and high-rise retrofit cycles, leveraging digital supply-chain tools to guarantee on-time delivery that OEMs now treat as critical to avoid production stoppages.
Foam Tape Industry Leaders
3M
NITTO DENKO CORPORATION
tesa Tapes (India) Private Limited
IPG (Intertape Polymer Group)
AVERY DENNISON CORPORATION
- *Disclaimer: Major Players sorted in no particular order

Recent Industry Developments
- July 2024: Avery Dennison has unveiled a new range of functional tapes for bonding foam and fiber materials in vehicles. This addition to its pressure-sensitive adhesive tapes addresses in-cabin noise, VOC-related odors, and OEM compliance.
- November 2023: CCL Design launched the 5400 LSE series of acrylic foam tapes. Developed by the R&D team in Venray, Netherlands, the series offers primerless adhesion to plastics, strong bonding to polypropylene (PP), and excellent compatibility with automotive paints.


Global Foam Tape Market Report Scope
Foam tapes are used for temporary or permanent fastening, packaging, acoustic dampening, thermal insulation, and gap filling. They are made of open-cell or closed-cell foams, coated with different types of pressure-sensitive adhesives (PSAs), and they come in a variety of thicknesses. Each foam tape has unique features and ideal purposes. The foam tape market is segmented by foam type, type, resin type, technology, end-user industry, and geography. By foam type, the market is segmented into polyethylene, polyurethane, neoprene, acrylic, and other foam types. By type, the market is segmented into single sided foam tape and double sided foam tape. By resin type, the market is segmented into rubber, silicone, acrylic, EVA, and other resin types. By technology, the market is segmented into solvent-based, water-based, and hot-melt-based, and by end-user industry, the market is segmented into automotive, construction, electrical and electronics, aerospace, packaging, and other end-user industries. The report also covers the market size of and forecasts for the foam type market in 15 countries across major regions. For each segment, the market sizing and forecasts have been done on the basis of revenue (USD million).
| Polyethylene (PE) |
| Polyurethane (PU) |
| Acrylic |
| Neoprene |
| Other Foam Types (Bio-based, etc.) |
| Single-Sided |
| Double-Sided |
| Acrylic |
| Rubber |
| Silicone |
| Ethyl Vinyl Acetate (EVA) |
| Other Resin Types (Epoxy, Bio-based, etc,) |
| Solvent-Based |
| Water-Based |
| Hot-Melt |
| Construction |
| Automotive |
| Electrical and Electronics |
| Aerospace |
| Packaging |
| Other End-user Industries (Food and Beverage, etc.) |
| Asia-Pacific | China |
| Japan | |
| India | |
| South Korea | |
| ASEAN Countries | |
| Rest of Asia-Pacific | |
| North America | United States |
| Canada | |
| Mexico | |
| Europe | Germany |
| United Kingdom | |
| France | |
| Italy | |
| Spain | |
| Russia | |
| NORDIC Countries | |
| Rest of Europe | |
| South America | Brazil |
| Argentina | |
| Rest of South America | |
| Middle East and Africa | Saudi Arabia |
| South Africa | |
| Rest of Middle East and Africa |
| By Foam Type | Polyethylene (PE) | |
| Polyurethane (PU) | ||
| Acrylic | ||
| Neoprene | ||
| Other Foam Types (Bio-based, etc.) | ||
| By Tape Type | Single-Sided | |
| Double-Sided | ||
| By Resin Type | Acrylic | |
| Rubber | ||
| Silicone | ||
| Ethyl Vinyl Acetate (EVA) | ||
| Other Resin Types (Epoxy, Bio-based, etc,) | ||
| By Technology | Solvent-Based | |
| Water-Based | ||
| Hot-Melt | ||
| By End-User Industry | Construction | |
| Automotive | ||
| Electrical and Electronics | ||
| Aerospace | ||
| Packaging | ||
| Other End-user Industries (Food and Beverage, etc.) | ||
| By Geography | Asia-Pacific | China |
| Japan | ||
| India | ||
| South Korea | ||
| ASEAN Countries | ||
| Rest of Asia-Pacific | ||
| North America | United States | |
| Canada | ||
| Mexico | ||
| Europe | Germany | |
| United Kingdom | ||
| France | ||
| Italy | ||
| Spain | ||
| Russia | ||
| NORDIC Countries | ||
| Rest of Europe | ||
| South America | Brazil | |
| Argentina | ||
| Rest of South America | ||
| Middle East and Africa | Saudi Arabia | |
| South Africa | ||
| Rest of Middle East and Africa | ||


Key Questions Answered in the Report
What is the current value of the foam tapes market and its expected growth?
The foam tapes market stands at USD 10.82 billion in 2026 and is forecast to reach USD 14.37 billion by 2031, advancing at a 5.86% CAGR.
Which region generates the highest demand for foam tapes?
Asia-Pacific accounts for 41.63% of global revenue in 2025 and is also the fastest-growing region at a 6.72% CAGR through 2031.
Which end-user segment is expanding the fastest?
Electrical and electronics applications lead growth with a 7.18% CAGR as EV battery packs and semiconductor packaging lift demand for high-temperature, precision bonding solutions.
How are environmental regulations influencing product development?
Stricter VOC limits and diisocyanate restrictions are accelerating shifts from solvent-based to hot-melt chemistries and boosting interest in bio-based and recyclable foam formulations.
Page last updated on:


