Market Overview
| Study Period | 2021 - 2031 |
|---|---|
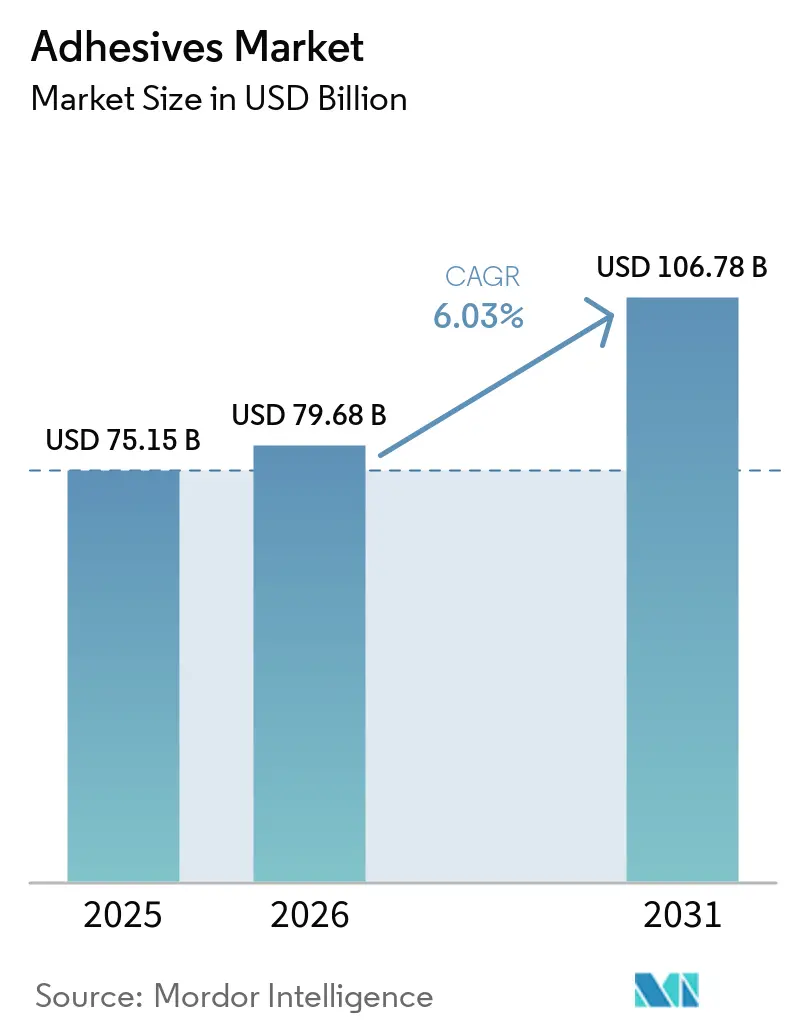
| Market Size (2026) | USD 79.68 Billion |
| Market Size (2031) | USD 106.78 Billion |
| Growth Rate (2026 - 2031) | 6.03% CAGR |
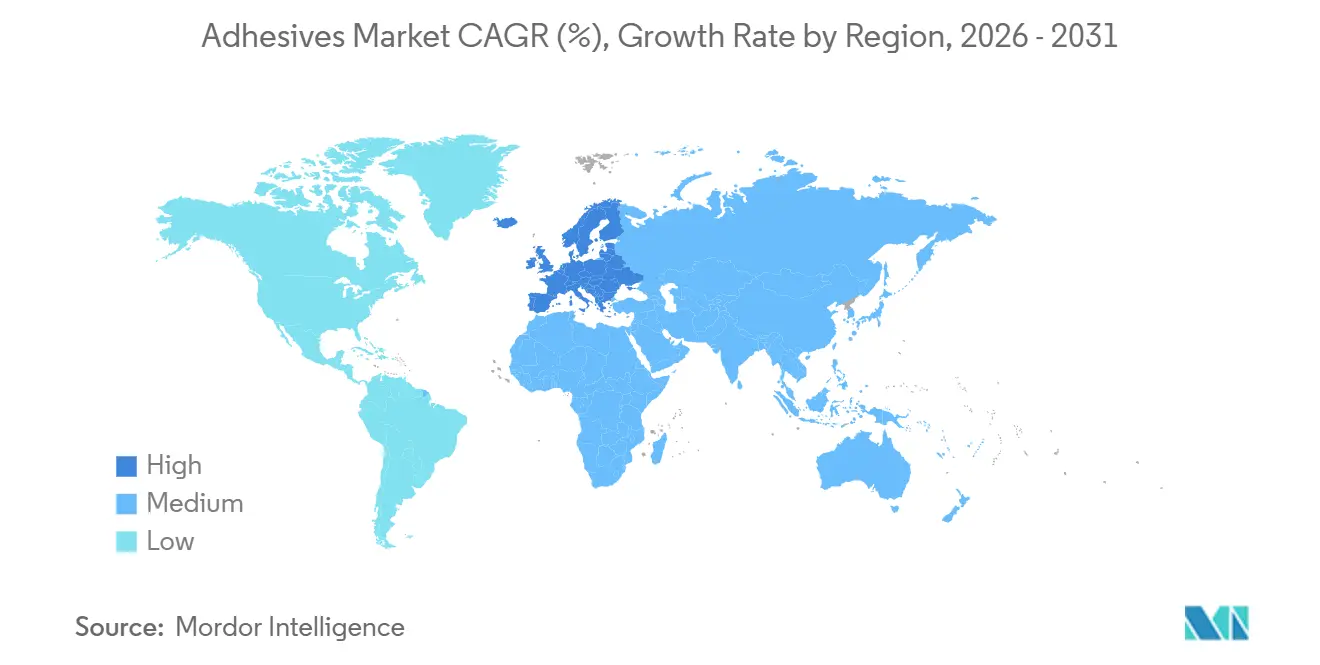
| Fastest Growing Market | Europe |
| Largest Market | Asia-Pacific |
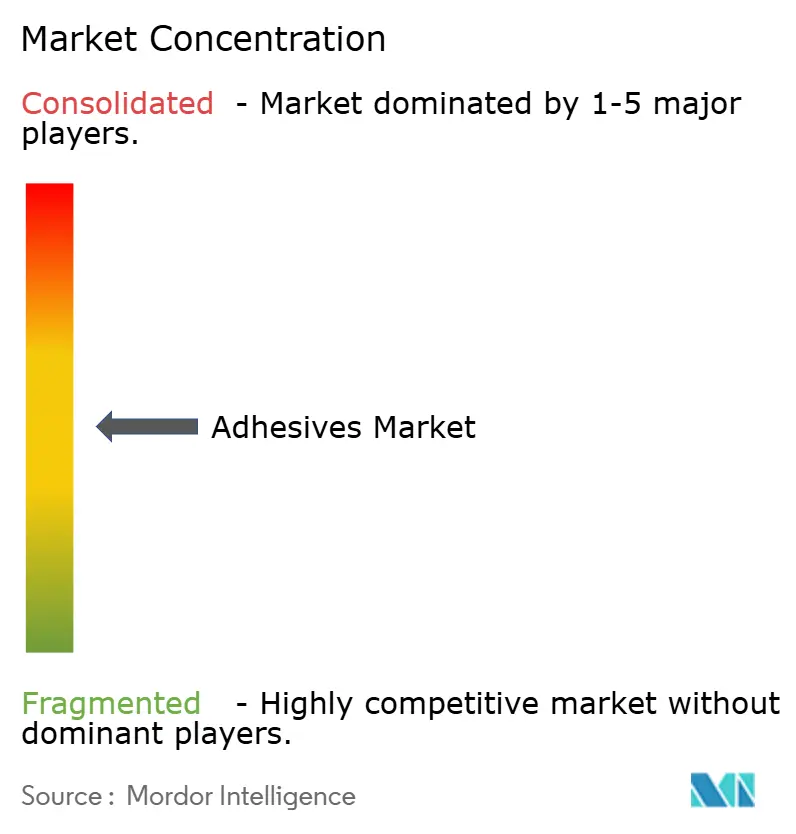
| Market Concentration | Medium |
Major Players *Disclaimer: Major Players sorted in no particular order Image © Mordor Intelligence. Reuse requires attribution under CC BY 4.0. | |
Adhesives Market Analysis by Mordor Intelligence
The Adhesives Market size was valued at USD 75.15 billion in 2025 and is estimated to grow from USD 79.68 billion in 2026 to reach USD 106.78 billion by 2031, at a CAGR of 6.03% during the forecast period (2026-2031). Surging infrastructure programs, electric-vehicle platform redesign, and stricter volatile-organic-compound (VOC) limits are redirecting demand from solvent-borne to water-borne and reactive chemistries. Near-shoring of acrylic monomer capacity in the United States after the 2025 aromatic-feedstock tariff is shortening lead times and easing input-price volatility. Packaging adopters are accelerating purchases of PFAS-free formulations to meet European Union and U.S. food-contact rules, while automotive producers are specifying structural epoxies and polyurethanes to lighten battery-electric vehicles and extend driving range. Artificial-intelligence (AI) formulation tools now simulate curing kinetics across thousands of resin combinations, trimming development cycles by up to 70% and lowering cost barriers for custom bonding.
Key Report Takeaways
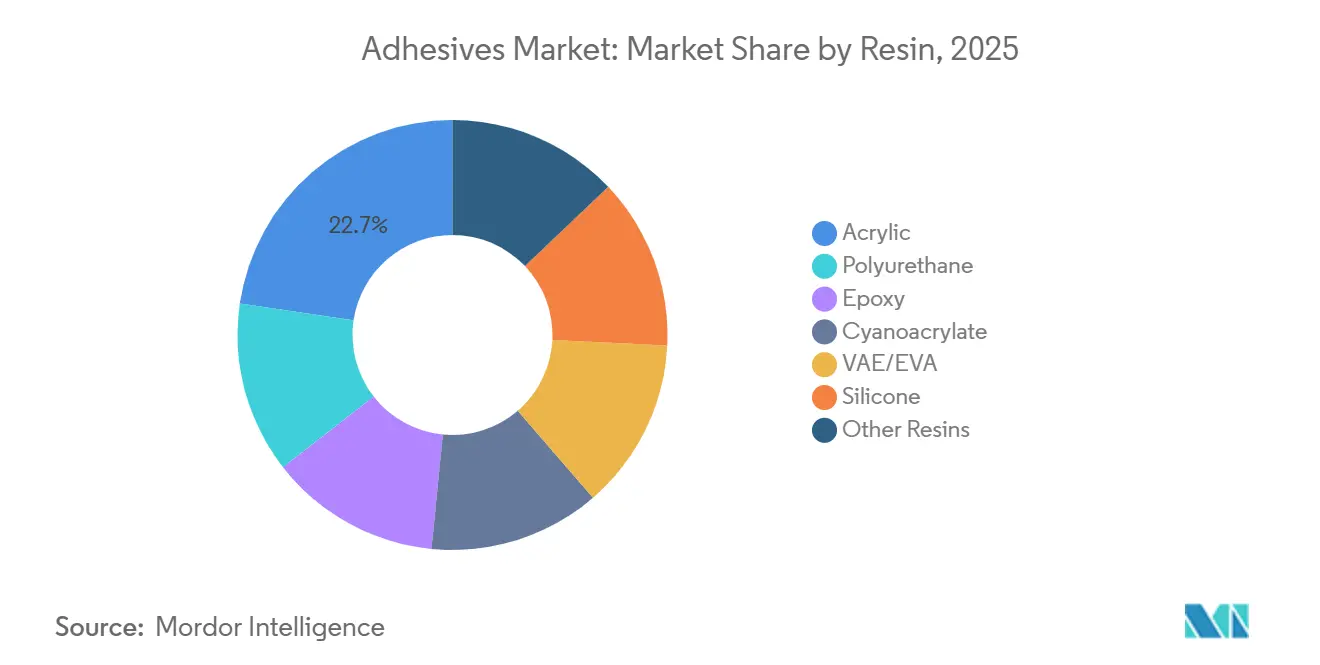
- By resin, acrylics held 22.66% of the adhesives market share in 2025; vinyl-acetate-ethylene (VAE/EVA) formulations are forecast to grow at a 6.33% CAGR through 2031.
- By technology, water-borne systems captured 42.32% of the adhesives market size in 2025, while hot-melt is the fastest-growing technology at 6.67% CAGR to 2031.
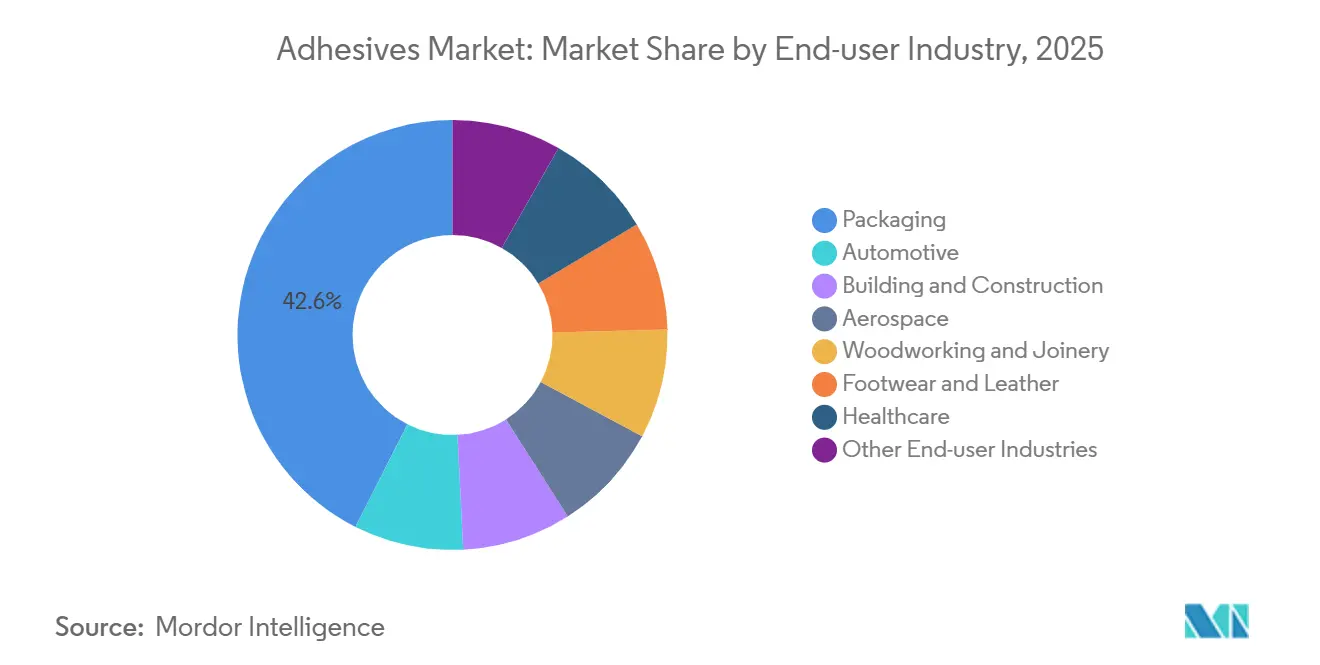
- By end-user industry, packaging led with 42.56% of adhesives market share in 2025; automotive is projected to expand at a 6.31% CAGR through 2031.
- By geography, Asia-Pacific accounted for 36.41% of the adhesives market size in 2025, whereas Europe records the highest projected growth at 6.42% CAGR to 2031.
Note: Market size and forecast figures in this report are generated using Mordor Intelligence’s proprietary estimation framework, updated with the latest available data and insights as of 2026.
Global Adhesives Market Trends and Insights
Drivers Impact Analysis*
| Drivers | (~) % Impact on CAGR Forecast | Geographic Relevance | Impact Timeline |
|---|---|---|---|
| Global construction upcycle raising consumption of structural and flooring adhesives | +1.80% | Worldwide, led by Asia-Pacific and Middle-East | Long term (≥ 4 years) |
| Lightweighting and electric-vehicle platforms accelerating automotive adhesive penetration | +1.50% | North America, Europe, China | Medium term (2-4 years) |
| AI-driven formulation optimization slashing R&D timelines and costs | +0.90% | Global | Short term (≤ 2 years) |
| Near-shoring of acrylic-monomer supply in the United States | +0.60% | North America | Medium term (2-4 years) |
| Bio-based adhesive regulatory credits spurring premium-price adoption | +0.70% | Europe, North America | Long term (≥ 4 years) |
| Source: Mordor Intelligence | |||


Global Construction Upcycle Raising Consumption of Structural and Flooring Adhesives
Government-funded infrastructure initiatives in North America, Asia-Pacific, and the Middle-East have been driving the adoption of polyurethane and acrylic structural adhesives across the adhesives market for applications involving steel, concrete, and composite materials. In the United States, federal funding of USD 110 billion for bridges and highways has promoted the use of rapid-cure methyl-methacrylate systems, valued for their ability to withstand freeze-thaw cycles[1]U.S. Department of Transportation, “Infrastructure Investment Allocations,” transportation.gov . Meanwhile, India's fiscal 2024-2025 budget for urban transit and housing has driven up demand for low-VOC VAE/EVA tile adhesives[2]Government of India Ministry of Finance, “Budget 2024-2025,” indiabudget.gov.in . In Saudi Arabia, large-scale projects like NEOM have utilized silicone and polyurethane sealants designed to endure ambient temperatures exceeding 50°C. Additionally, public-sector tenders in Europe have required ISO 11600-compliant sealants, driving a transition to water-borne and reactive chemistries that comply with VOC regulations. Collectively, these programs have increased demand for adhesives that reduce installation time, improve structural integrity, and support green-building goals.
Lightweighting and Electric-Vehicle Platforms Accelerating Automotive Adhesive Penetration
Battery-electric vehicles (BEVs) consume a significant amount of structural adhesive per unit, twice the amount used in internal-combustion vehicles, creating strong demand across the adhesives industry. This is due to the inability to spot-weld aluminum and carbon-fiber panels. For instance, Polestar 5 employs bonded aluminum space frames, shedding considerable mass and extending the single-charge range. Major original-equipment manufacturers (OEMs) are turning to epoxy and polyurethane chemistries, ensuring high shear strengths and resilience against thermal cycling from low to high temperatures. With the European Union mandating vehicle recyclability by 2027, formulators are innovating thermally reversible adhesives that can debond at elevated temperatures, simplifying material separation. Such industry shifts signal a robust growth trajectory for automotive bonding over the coming years.
AI-Driven Formulation Optimization Slashing R&D Timelines and Custom-Bonding Costs
Machine-learning models, trained on decades of formulation data, now predict viscosity, open time, and cured strength with high accuracy across the adhesives industry. This advancement has significantly reduced development cycles from the traditional timeline to a much shorter duration. In 2025, a global supplier, leveraging a digital-twin rollout, screened numerous resin permutations, expediting the removal of PFAS, a feat that previously relied on time-consuming lab-based trial-and-error. Dow, in 2026, introduced an AI tool that predicts peel strength for polyurethane hot-melts. This innovation empowers customers to skip pilot plants and move directly into production. Meanwhile, smaller formulators are turning to open-source libraries to enhance bio-based VAE emulsions. However, a shortage of data-savvy polymer chemists is hindering immediate scalability.
Bio-Based Adhesive Regulatory Credits Spurring Premium-Price Adoption
Europe’s Renewable Energy Directive and California’s Low Carbon Fuel Standard both incentivize certified bio-based adhesive content through tradable credits. These credits help offset the price premium associated with petrochemical grades. Henkel’s Loctite Liofol hot-melts, boasting renewable carbon content and USDA BioPreferred seals, enable brand owners to account for Scope 3 emission reductions. However, with fermentation capacity capped at a limited amount annually, supply has been restricted to high-value sectors like flexible packaging and medical devices.
Restraints Impact Analysis*
| Restraints | (~) % Impact on CAGR Forecast | Geographic Relevance | Impact Timeline |
|---|---|---|---|
| Escalating VOC and chemicals regulation curbing solvent-borne adhesive sales | -1.20% | Europe, North America, China, South Korea | Short term (≤ 2 years) |
| Global shortage of senior adhesive formulators slowing commercialization cycles | -0.60% | Global | Medium term (2-4 years) |
| Nano-safety toxicological concerns for reactive hybrid adhesives | -0.30% | Europe, North America | Long term (≥ 4 years) |
| Source: Mordor Intelligence | |||
Escalating VOC and Chemicals Regulation Curbing Solvent-Borne Adhesive Sales
In 2024, Europe added dichloromethane and NMP to its REACH Authorization List, mandating a phase-out of these solvent staples by 2027. In 2025, California’s South Coast Air Quality district reduced VOC limits for architectural adhesives, effectively instituting a ban on legacy contact cements. Meanwhile, China set a cap on VOCs in packaging adhesives under GB 38507-2020. These collective regulations reduced the solvent-borne share, steering formulators toward water-borne, hot-melt, and reactive alternatives. While some applications turned to faster-evaporating acetone and ethyl acetate for compliance, this shift came at the cost of reduced open time and bond strength.
Nano-Safety Toxicological Concerns for Reactive Hybrid Adhesives
While additives like silica, carbon nanotubes, and graphene oxide can boost shear strength, they also raise concerns over inhalation and skin exposure. Under EU REACH regulations, each nanoform is now recognized as a separate substance, leading to dossier costs and a preparation time stretching to years. In the U.S., the TSCA mandates extra pre-manufacture notifications specifically for nanoscale materials. Research published in peer-reviewed journals has identified certain particles crossing the blood-brain barrier, intensifying demands for tighter workplace exposure regulations. Although encapsulating nanoparticles within polymer matrices can mitigate the risks of free-particle exposure, it simultaneously complicates the process and inflates costs.
*Our forecasts treat driver/restraint impacts as directional, not additive. The impact forecasts reflect baseline growth, mix effects, and variable interactions.
Segment Analysis
By Resin: Acrylic Versatility Anchors Market Share
Acrylic adhesives represented 22.66% of 2025 revenue, reflecting broad use across packaging, construction, and automotive bonding. Meanwhile, VAE/EVA systems are projected to maintain a 6.33% CAGR through 2031, driven by flexible packaging and tile applications, while balancing affordability with reduced VOC content. In the automotive and footwear sectors, polyurethane grades are preferred for their superior elongation properties. High-temperature silicones have maintained their niche in engine-gasket and sensor encapsulation, while epoxy chemistries remain essential in aerospace composite bonding, particularly where high shear requirements and fuel resistance are critical. Additionally, cyanoacrylates continue to see increased use in medical devices and consumer electronics due to their instant fixture capabilities.
Water-borne acrylic emulsions now dominate the adhesives market, replacing solvent grades due to stringent VOC regulations. Bio-acrylic pathways have enhanced sustainability efforts, benefiting from supportive programs in Europe and California. In footwear, polyurethane reactive hot-melts are increasingly replacing solvent-based contact cements, eliminating the need for costly ventilation. Epoxies incorporating bio-based epichlorohydrin have strengthened their green credentials without sacrificing performance. Lastly, UV-cured acrylic systems are gaining ground in the electronics sector, challenging cyanoacrylates by eliminating bloom and significantly reducing assembly times.


By Technology: Water-Borne Dominance Challenged by Hot-Melt Surge
Water-borne platforms controlled 42.32% of 2025 turnover, driven by construction, woodworking, and pressure-sensitive-tape usage. Hot-melt formulations, however, are growing fastest at 6.67% CAGR through 2031 as fulfillment centers chase cycle-time reduction and energy savings. Notably, polyurethane and polyolefin hot-melts can secure cartons in less than 10 seconds and operate at reduced pot temperatures, slashing line energy costs. In the automotive and aerospace sectors, reactive technologies, such as two-part epoxies, polyurethanes, and silane-modified polymers, are favored for their ability to provide structural integrity without the need for mechanical fasteners. Additionally, UV-cured chemistries, a niche market in 2023, utilize LED lamps for instant bonding of electronics and medical devices, all while maintaining a minimal thermal load.
As VOC caps tighten in the adhesives industry, the share of solvent-borne products has diminished over the years. In response, formulators are crafting acetone-rich blends that adhere to regulations, albeit at the cost of open time. While water-borne grades continue to lead in flooring and joinery due to their extended open-time window for repositioning, the quicker-setting reactive hot-melts are increasingly capturing market share, especially where conveyor line speed is prioritized over latency.
By End-User Industry: Packaging Leads, Automotive Accelerates
Packaging absorbed 42.56% of global demand in 2025, powered by flexible food wraps and e-commerce cartons. Converters are turning to PFAS-free, low-migration water-borne grades to comply with EU Regulation 10/2011 and U.S. FDA Food-Contact rules. Automotive adhesive consumption is forecast to post the highest growth of 6.31% CAGR through 2031, on rising BEV output and lightweighting imperatives. Each battery pack depends on thermally conductive epoxies and polyurethanes for bonding and insulation. Global infrastructure stimulus is bolstering demand for construction adhesives, which utilize high-modulus polyurethane and acrylic grades for curtain-wall panels and flooring. While aerospace applications may be smaller in volume, they command premium pricing for epoxy and polyurethane systems due to stringent FAA/EASA certification. The demand landscape is further enriched by healthcare, woodworking, footwear, and electronics, all seeking specialized biocompatible, low-formaldehyde, and instant-set solutions.
Geography Analysis
Asia-Pacific held 36.41% of 2025 revenue, bolstered by China's robust electronics assembly and India's ambitious infrastructure budget for 2024-2025. Chinese VOC caps in packaging adhesives are driving a shift towards hot-melt and water-borne solutions. Meanwhile, Japanese and South Korean silicon expansions are catering to the burgeoning demands of EV batteries and chip applications. Southeast Asian nations, spearheaded by Vietnam and Thailand, are seizing the opportunity as flexible-packaging capacities migrate from China, leading to a surge in VAE emulsions consumption.
Europe is projected to grow quickest at 6.42% CAGR through 2031 in the adhesives industry as Green Deal policies demand circular-economy solutions. The revamped End-of-Life Vehicles Regulation is spotlighting debonding-by-design adhesives. Suppliers boasting thermally reversible systems stand to gain a significant first-mover advantage. Noteworthy acquisitions, such as Henkel's takeover of Stahl and Sika's acquisition of Akkim, are broadening portfolios into leather, facades, and construction substrates in the Middle-East, solidifying their regional dominance.
North America is capitalizing on an infrastructure act and a tariff on aromatics in the adhesives industry. The infrastructure act is spurring a heightened demand for structural epoxies, especially for bridge restorations. Concurrently, the aromatic tariff is incentivizing the establishment of domestic acrylic monomer plants, leading to reduced lead times and stabilized feedstock prices. In Canada, green-housing incentives are driving a surge in demand for low-VOC polyurethanes. Simultaneously, Mexico's burgeoning automotive corridor is luring adhesive capacity expansions from industry giants Henkel and Sika, aiming to cater to nearby OEMs. South America, albeit starting from a smaller base, is witnessing growth primarily driven by construction upgrades in Brazil, even as macroeconomic volatility tempers capital expenditures. In the Middle-East, ambitious projects like the NEOM megacity and the Riyadh Expo 2030 are fueling heightened consumption of polyurethanes and silicones. Meanwhile, Africa's emerging market is finding its footing, with notable traction in South African mining and construction sectors.

Competitive Landscape
The adhesives market is moderately fragmented. Henkel, Sika, 3M, H.B. Fuller, and Dow together account for a significant portion of the market revenue, leaving ample opportunities for regional or bio-based competitors. In February, Henkel acquired Stahl to bolster its specialty coatings and leather adhesives segment. Earlier, in January, Henkel deepened its focus on electronics tapes by purchasing ATP Adhesive Systems. Furthermore, in October last year, Henkel partnered with Dow to co-develop hot-melts using bio-based polyols, a move that qualifies them for California carbon credits.
Sika is on the verge of finalizing its deal for Akkim, a move that would enhance its foothold in the Middle-East within the adhesives market. Both Sika and Akkim are pursuing ISO 11600 compliance and exploring thermally reversible chemistries, strategies aimed at securing public-sector construction bids and contracts in the automotive circular economy within the adhesives industry. Dow is signaling its intent to hedge against tariff risks with its new acrylic-acid line in Freeport, showcasing a move towards vertical integration. Meanwhile, LG Chem's pilot project for bio-acrylic acid, operational since the second quarter of last year, positions the Korean giant as a potential disruptor in the realm of sustainable packaging adhesives.
Regional players like Pidilite from India and Japan's Aica Kogyo are capitalizing on local distribution and services, successfully courting mid-tier construction and woodworking clients in the adhesives market. Leading suppliers are now standardizing AI-driven formulation toolkits, expediting the rollout of PFAS-free products. Henkel, for instance, boasts a digital-twin library that can simulate thousands of resin pairs, a capability that significantly reduces traditional lab expenses. Since 2024, there's been a notable surge in patent filings for thermally reversible polyurethanes, crucial for the upcoming EU ELV regulations, with Henkel, Sika, and Dow emerging as frontrunners. However, the steep costs associated with certifications and VOC compliance present significant hurdles, particularly for smaller entrants in the adhesives market.
Adhesives Industry Leaders
3M
H.B. Fuller Company
Henkel AG & Co. KGaA
Sika AG
Arkema
- *Disclaimer: Major Players sorted in no particular order

Recent Industry Developments
- February 2026: Sika has finalized an agreement to acquire Akkim, one of the leading Turkish manufacturers of adhesives and sealants. This acquisition enhances Sika's position in the global adhesives and sealants market, creating significant growth opportunities through an expanded distribution network and broader geographic reach.
- January 2026: Henkel finalized an agreement to acquire ATP Adhesive Systems, a Switzerland-based company, from Arsenal Capital Partners. ATP Adhesive Systems is recognized for its expertise in high-performance, water-based specialty tapes, serving a wide range of end-markets, including automotive, electronics, medical, building and construction, and graphics applications.


Global Adhesives Market Report Scope
Adhesives are substances that join or bond two or more surfaces together by sticking to them. They are a type of material that provides cohesion between different substrates, creating a durable and often permanent bond. Adhesives are used in various applications, from everyday household use to industrial and technological processes.
The adhesives market is segmented by resin, technology, end-user industry, and geography. By resin, the market is segmented into polyurethane, epoxy, acrylic, silicone, cyanoacrylate, VAE/EVA, silicone, and other resins. By technology, the market is segmented into water-borne, solvent-borne, reactive, hot melt, and UV-cured adhesives. By end-user industry, the market is segmented into building and construction, packaging, automotive, aerospace, woodworking and joinery, footwear and leather, healthcare, and other end-user industries.The report also covers the market size and forecasts for adhesives in 22 countries across major regions. For each segment, the market sizing and forecasts have been done on the basis of value (USD).
By Resin
| Polyurethane |
| Epoxy |
| Acrylic |
| Cyanoacrylate |
| VAE/EVA |
| Silicone |
| Other Resins |
By Technology
| Water-borne |
| Solvent-borne |
| Reactive |
| Hot Melt |
| UV Cured Adhesives |
By End-user Industry
| Building and Construction |
| Packaging |
| Automotive |
| Aerospace |
| Woodworking and Joinery |
| Footwear and Leather |
| Healthcare |
| Other End-user Industries |
By Geography
| Asia-Pacific | China |
| Japan | |
| India | |
| South Korea | |
| Australia | |
| Indonesia | |
| Malaysia | |
| Singapore | |
| Thailand | |
| Rest of Asia-Pacific | |
| North America | United States |
| Canada | |
| Mexico | |
| Europe | Germany |
| United Kingdom | |
| France | |
| Italy | |
| Spain | |
| Russia | |
| Rest of Europe | |
| South America | Brazil |
| Argentina | |
| Rest of South America | |
| Middle-East and Africa | Saudi Arabia |
| South Africa | |
| Rest of Middle-East and Africa |
| By Resin | Polyurethane | |
| Epoxy | ||
| Acrylic | ||
| Cyanoacrylate | ||
| VAE/EVA | ||
| Silicone | ||
| Other Resins | ||
| By Technology | Water-borne | |
| Solvent-borne | ||
| Reactive | ||
| Hot Melt | ||
| UV Cured Adhesives | ||
| By End-user Industry | Building and Construction | |
| Packaging | ||
| Automotive | ||
| Aerospace | ||
| Woodworking and Joinery | ||
| Footwear and Leather | ||
| Healthcare | ||
| Other End-user Industries | ||
| By Geography | Asia-Pacific | China |
| Japan | ||
| India | ||
| South Korea | ||
| Australia | ||
| Indonesia | ||
| Malaysia | ||
| Singapore | ||
| Thailand | ||
| Rest of Asia-Pacific | ||
| North America | United States | |
| Canada | ||
| Mexico | ||
| Europe | Germany | |
| United Kingdom | ||
| France | ||
| Italy | ||
| Spain | ||
| Russia | ||
| Rest of Europe | ||
| South America | Brazil | |
| Argentina | ||
| Rest of South America | ||
| Middle-East and Africa | Saudi Arabia | |
| South Africa | ||
| Rest of Middle-East and Africa | ||


Market Definition
- End-user Industry - Building & Construction, Packaging, Automotive, Aerospace, Woodworking & Joinery, Footwear & Leather, Healthcare, and Others are the end-user industries considered under the adhesives market.
- Product - All adhesive products are considered in the market studied
- Resin - Under the scope of the study, resins like Polyurethane, Epoxy, Acrylic, Cyanoacrylate, VAE/EVA, and Silicone are considered
- Technology - For the purpose of this study, Water-borne, Solvent-borne, Reactive, Hot Melt, and UV Cured adhesive technologies are taken into consideration.
| Keyword | Definition |
|---|---|
| Hot-melt Adhesive | Hot melt adhesives are generally 100% solid formulations, based on thermoplastic polymers. They are solid at room temperature and are activated upon heating above their softening point, at which stage they are liquid, and hence, can be processed. |
| Reactive Adhesive | A reactive adhesive is made up of monomers that react in the adhesive curing process and do not evaporate from the film during use. Instead, these volatile components become chemically incorporated into the adhesive. |
| Solvent-borne Adhesive | Solvent-borne adhesives are mixtures of solvents and thermoplastic, or slightly cross-linked polymers, such as polychloroprene, polyurethane, acrylic, silicone, and natural and synthetic rubbers (elastomers). |
| Water-borne Adhesive | Water-borne adhesives use water as a carrier or diluting medium to disperse a resin. They are set by allowing the water to evaporate or be absorbed by the substrate. These adhesives are compounded with water as a diluent, rather than a volatile organic solvent. |
| UV Cured Adhesive | UV curing adhesives induce curing and create a permanent bond without heating by using ultraviolet (UV) light or other radiation sources. An aggregation of monomers and oligomers is cured or polymerized by ultraviolet (UV) or visible light in a UV adhesive. Because UV is a radiating energy source, UV adhesives are often referred to as radiation curing or rad-cure adhesives. |
| Heat-resistant Adhesive | Heat-resistant Adhesives refer to those that do not break down under high temperatures. One aspect of a complicated system of circumstances is the adhesive's capacity to withstand disintegration brought on by high temperatures. As the temperature rises, adhesives may liquefy. They can withstand stresses resulting from differing coefficients of expansion and contraction, which might be an additional advantage. |
| Reshoring | Reshoring is the practice of moving commodity production and manufacturing back to the nation where the business was founded. Onshoring, inshoring, and back shoring are further terms used. Offshoring, the practice of producing items abroad to lower labor and manufacturing costs, is the opposite of this. |
| Oleochemicals | Oleochemicals are compounds produced from biological oils or fats. They resemble petrochemicals, which are substances made from petroleum. The oleochemical business is built on the hydrolysis of oils or fats. |
| Nonporous Materials | Nonporous materials are substances that do not permit the passage of liquid or air. Nonporous materials are those that are not porous, such as glass, plastic, metal, and varnished wood. Since no air can get through, less airflow is required to raise these materials, negating the requirement for high airflow. |
| EU-Vietnam Free Trade Agreement | A trade agreement and an investment protection agreement were concluded between the European Union and Vietnam on June 30, 2019. |
| VOC content | Compounds with limited solubility in water and high vapor pressure are known as Volatile Organic Compounds (VOCs). Many VOCs are human-made chemicals that are used and produced in the manufacture of paints, pharmaceuticals, and refrigerants. |
| Emulsion Polymerization | Emulsion polymerization is a method of producing polymers or connected groups of smaller chemical chains known as monomers, in a water solution. The method is often used to make water-based paints, adhesives, and varnishes, in which the water stays with the polymer and is marketed as a liquid product. |
| 2025 National Packaging Targets | In 2018, the Australian Environment Ministry set the following 2025 National Packaging Targets: 100% of the packaging must be reusable, recyclable, or compostable by 2025, 70% of plastic packaging must be recycled or composted by 2025, 50% of average recycled content must be included in packaging by 2025, and problematic and unnecessary single-use plastic packaging must be phased out by 2025. |
| Russian Government’s Import Substitution Policy | The Western sanctions suspended the distribution of several high-tech items to Russia, including those required by the raw material export sectors and the military-industrial complex. In response, the government launched an "import substitution" scheme, appointing a special commission to oversee its implementation in early 2015. |
| Paper Substrate | Paper substrates are paper sheets, reels, or boards with a base weight of up to 400 g/m2 that has not been converted, printed or otherwise altered. |
| Insulation Material | A material that inhibits or blocks heat, sound, or electrical transmission is known as Insulation Material. The variety of insulation materials includes thick fibers like fiberglass, rock and slag wool, cellulose, and natural fibers as well as stiff foam boards and sleek foils. |
| Thermal Shock | A temperature change known as thermal shock generates stress in a material. It commonly results in material breakdown and is especially prevalent in brittle materials like ceramics. When there is a quick temperature change, either from hot to cold or vice versa, this process occurs abruptly. It occurs more frequently in materials with poor heat conductivity and insufficient structural integrity. |


Research Methodology
Mordor Intelligence follows a four-step methodology in all our reports.
- Step-1: Identify Key Variables: The quantifiable key variables (industry and extraneous) pertaining to the specific product segment and country are selected from a group of relevant variables & factors based on desk research & literature review; along with primary expert inputs. These variables are further confirmed through regression modeling (wherever required).
- Step-2: Build a Market Model: In order to build a robust forecasting methodology, the variables and factors identified in Step-1 are tested against available historical market numbers. Through an iterative process, the variables required for market forecast are set and the model is built on the basis of these variables.
- Step-3: Validate and Finalize: In this important step, all market numbers, variables and analyst calls are validated through an extensive network of primary research experts from the market studied. The respondents are selected across levels and functions to generate a holistic picture of the market studied.
- Step-4: Research Outputs: Syndicated Reports, Custom Consulting Assignments, Databases & Subscription Platforms


