Floating LNG Power Plant Market Size and Share
Market Overview
| Study Period | 2021 - 2031 |
|---|---|
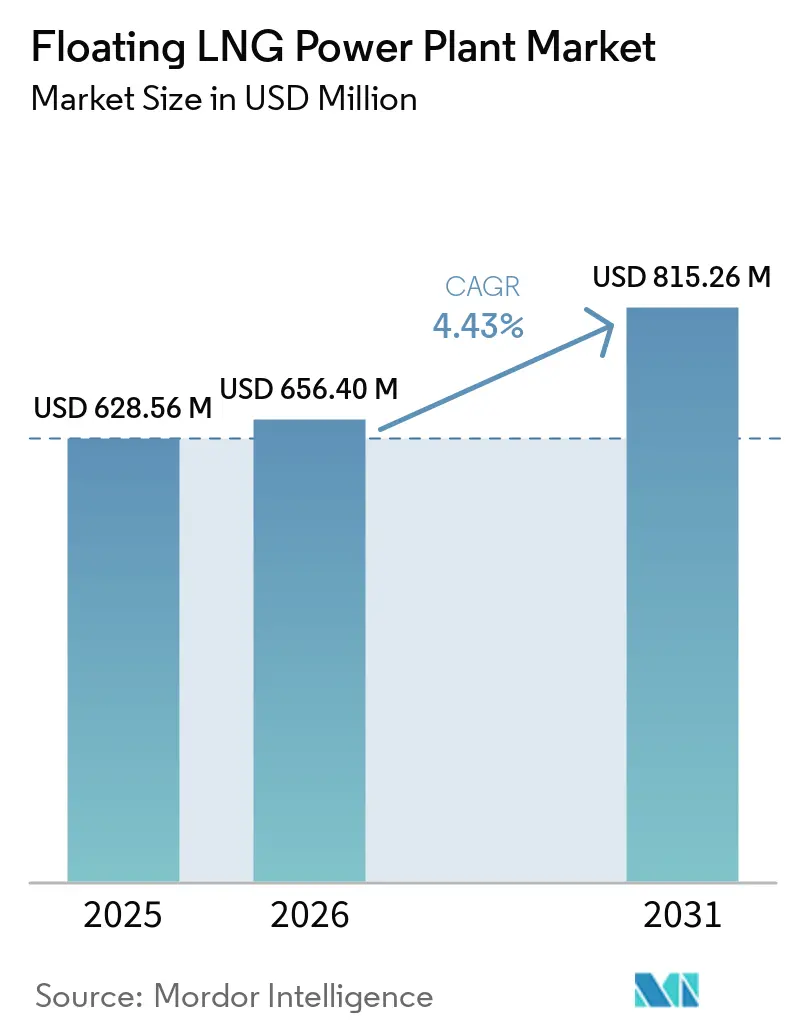
| Market Size (2026) | USD 656.40 Million |
| Market Size (2031) | USD 815.26 Million |
| Growth Rate (2026 - 2031) | 4.43% CAGR |
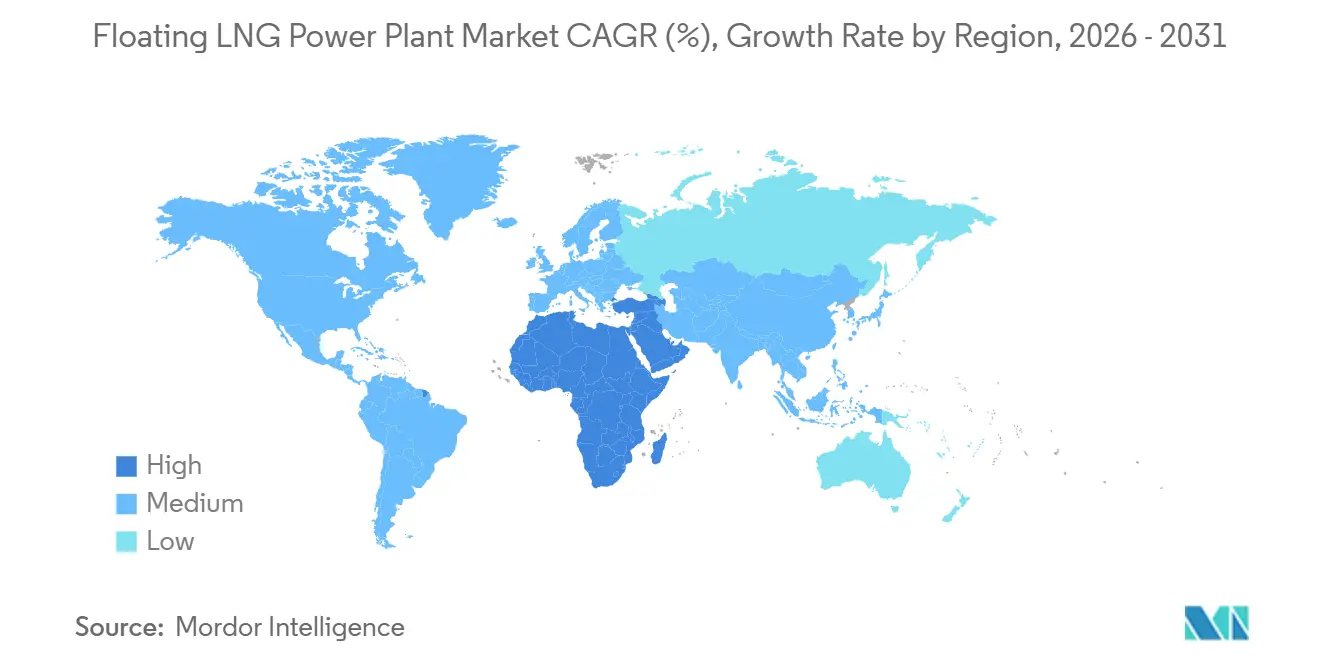
| Fastest Growing Market | Middle East and Africa |
| Largest Market | Asia Pacific |
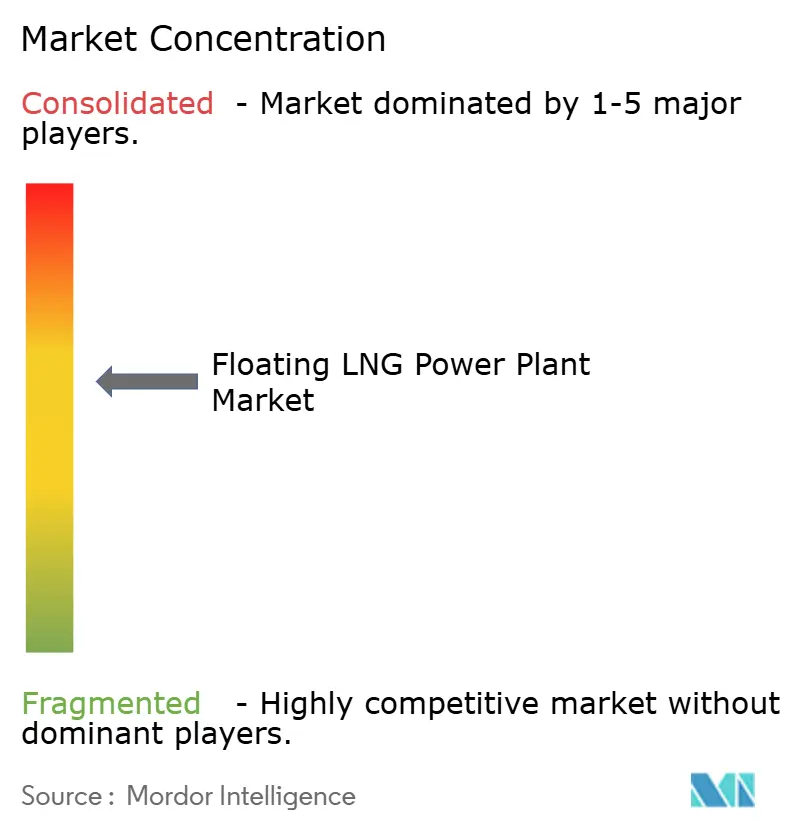
| Market Concentration | Medium |
Major Players *Disclaimer: Major Players sorted in no particular order Image © Mordor Intelligence. Reuse requires attribution under CC BY 4.0. | |
Floating LNG Power Plant Market Analysis by Mordor Intelligence
The floating LNG power vessel market is expected to grow from USD 628.56 million in 2025 to USD 656.40 million in the same year and is projected to reach USD 815.26 million by 2031, registering a CAGR of 4.43% during the forecast period of 2025-2031. This market continues to benefit from the significant fuel-cost gap between LNG and diesel in island and off-grid systems. For instance, studies on Indonesian island power plants indicate delivered natural gas costs of USD 10.4-11.3 per MMBtu compared to high-speed diesel at USD 25.5 per MMBtu.[1]Rahmanta et al., “Integrated Floating Storage Regasification and Power Plant Economics in Indonesian Island Systems,” Energies, mdpi.com The market is also being influenced by stricter shipping emissions regulations. The April 2025 IMO framework established a clear trajectory for increasing penalties on higher-emission marine assets starting in 2028, driving a shift toward gas-fired vessel designs. Asia-Pacific remains the primary region for current demand, driven by diesel-displacement programs and ongoing regasification infrastructure developments. Meanwhile, the Middle East and Africa are emerging as key growth regions, supported by expanding gas-to-power demand and FSRU deployments across multiple countries. Additionally, a secondary growth driver is emerging as data center developers and commercial users seek fast, mobile power solutions to bypass delays in onshore grid interconnections. This trend is particularly pronounced in areas where AI-related energy demand is outpacing grid approval processes. Competitive conditions in the floating LNG power vessel market remain moderate to high. The next phase of market development will be influenced by factors such as engine selection, methane-slip mitigation, retrofit schedules, and the ability to provide integrated LNG-to-power solutions rather than standalone vessels.
Key Report Takeaways
- By type, power barges accounted for 59.6% of revenue in 2025, while power ships are anticipated to achieve the highest CAGR of 5.1% during the forecast period through 2031.
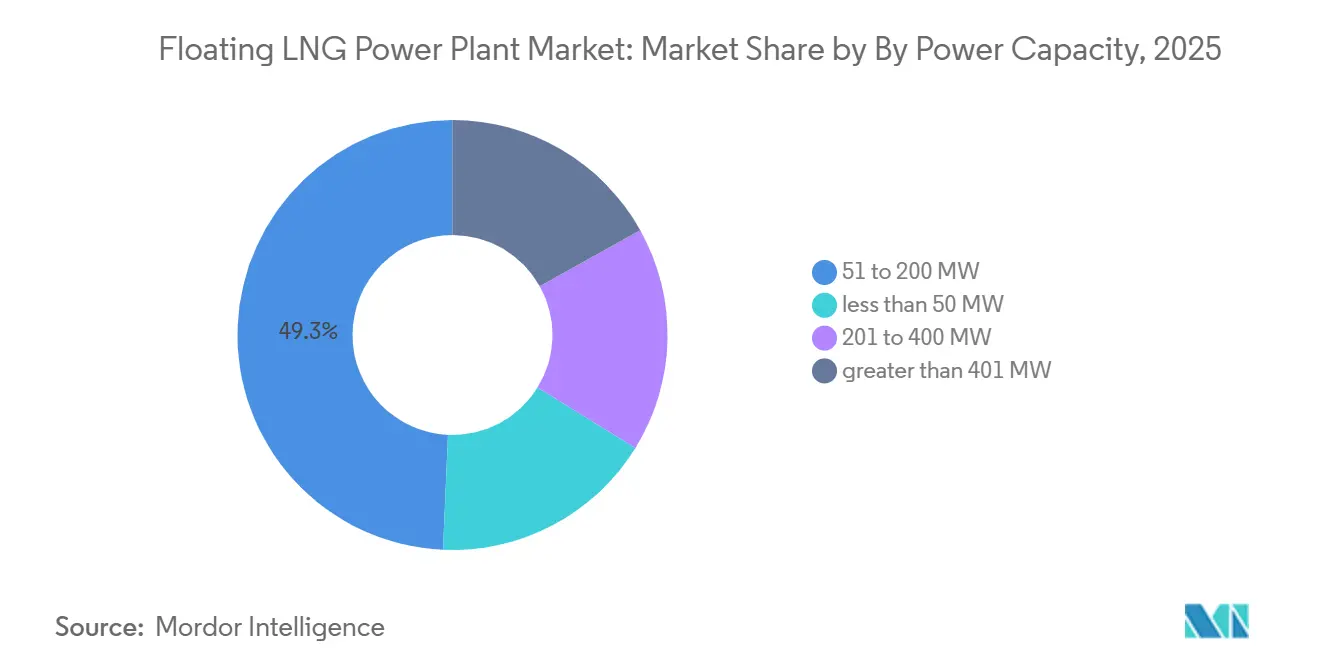
- By power capacity, the 51-200 MW capacity segment represented 49.3% of revenue in 2025, whereas the ≥ 401 MW segment is expected to grow at a CAGR of 5.9% through 2031.
- By application, base-load supply dominated with a 52.4% share in 2025, while the emergency and disaster relief segment is projected to grow at the fastest CAGR of 6.2% through 2031.
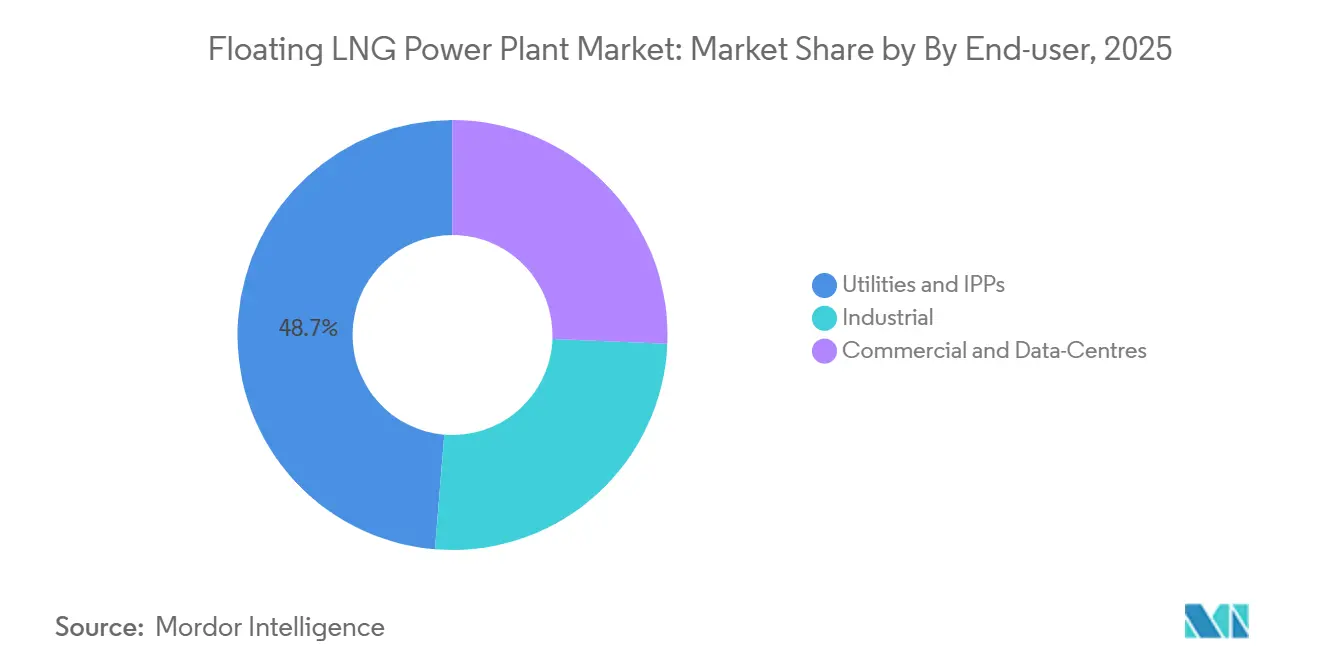
- By end-user, utilities and Independent Power Producers (IPPs) held a 48.7% share in 2025, while the commercial and data center segment is forecast to grow at a CAGR of 7.1% through 2031.
- By geography, Asia-Pacific led the market with a 36.1% share in 2025, while the Middle East and Africa is expected to register the highest CAGR of 4.6% through 2031.
Note: Market size and forecast figures in this report are generated using Mordor Intelligence’s proprietary estimation framework, updated with the latest available data and insights as of January 2026.
Global Floating LNG Power Plant Market Trends and Insights
Drivers Impact Analysis*
| Driver | (~) % Impact on CAGR Forecast | Geographic Relevance | Impact Timeline |
|---|---|---|---|
| Mainstream LNG Price Advantage Versus Diesel In Island Grids | +1.80% | APAC core, including Indonesia, the Philippines, and Pacific islands, with spillover to the Caribbean | Short term (≤ 2 years) |
| IMO CII And EEXI Pushing Gas-Fired Marine Assets | +0.70% | Global, with early gains in the EU and North Asia | Medium term (2-4 years) |
| African Gas-To-Power Tenders Favor Redeployable Vessels | +1.00% | Sub-Saharan Africa, North Africa, and the MSGBC Basin | Medium term (2-4 years) |
| AI-Driven Load-Balancing Software Unlocks Hybrid Barges | +0.50% | North America, the EU, Singapore, and APAC data-center hubs | Long term (≥ 4 years) |
| Ageing Steam-Turbine LNG Carriers Ripe For Power-Plant Conversion | +0.60% | Global fleet, with redeployment potential to South America and the Middle East and Africa | Medium term (2-4 years) |
| Modular Cryogenic BOP Packages Cut Barge CAPEX 25% | +0.40% | Global new-build markets and APAC shipyards | Medium term (2-4 years) |
| Source: Mordor Intelligence | |||


LNG Price Advantage Over Diesel Remains the Sharpest Commercial Driver
The floating LNG power vessel market continues to rely on a strong fuel-cost advantage, as evidenced in 2026 when UHERO reported delivered LNG prices at USD 17.9 per MMBtu compared to LSFO at USD 22.2 per MMBtu under Brent-linked conditions.[2]University of Hawaii Economic Research Organization, “Hawaii LNG and Power Cost Analysis,” UHERO, uhero.hawaii.edu A similar cost dynamic was observed in Indonesia, where peer-reviewed research published in April 2025 indicated natural gas delivered to island plants at USD 10.4-11.3 per MMBtu, significantly lower than high-speed diesel at USD 25.5 per MMBtu, maintaining a 55-60% cost advantage for natural gas. This price differential is driving project activity in the floating LNG power vessel market. For instance, PLN EPI announced a USD 1.5 billion small-scale LNG program in March 2025, targeting 41 island plants with a combined capacity of 2,148 MW and aiming for annual diesel savings of USD 300 million.
Integrated floating storage, regasification, and power vessels offer an additional cost advantage over separated assets. Research by Rahmanta and co-authors highlighted that hub-and-spoke supply-chain costs can account for 30-40% of the delivered gas price when FSRU and generation assets are procured separately. This underscores the benefits of a bundled vessel solution, which eliminates an intermediate cost node in the LNG-to-power supply chain. Consequently, the floating LNG power vessel market benefits not only from lower fuel costs but also from a streamlined delivery model. Procurement strategies that separate regasification and generation in tenders risk undervaluing the commercial benefits of an integrated solution, favoring operators capable of delivering fuel intake, storage, regasification, and power generation through a single platform.
IMO CII And EEXI Are Accelerating Fleet Transition Toward Gas-Fired Vessels
The floating LNG power vessel market is influenced by regulatory developments and fuel economics. The April 2025 IMO MEPC 83 outcome introduced a two-tier GHG fuel-intensity framework, requiring reductions of 4-17% by 2028 and 30-43% by 2035 compared to 2008 baselines. Within this framework, LNG vessels equipped with high-pressure diesel-cycle engines, which have a methane slip near 0.2%, are commercially better positioned than Otto medium-speed alternatives with significantly higher slip rates. This has already impacted vessel specifications in the market. For instance, Wärtsilä announced in January 2026 that its NextDF technology can reduce methane slip in four-stroke dual-fuel engines to below 1%, aligning newer designs more closely with compliance requirements.
Cost pressures are particularly pronounced in Europe, where the EU ETS expanded its scope to include methane and nitrous oxide starting in 2026. Operators calling at EU ports must surrender allowances for 70% of their 2025 vessel emissions in 2026. This regulatory shift is creating a divide within the floating LNG power vessel market. Newer fleets capable of maintaining charter economics are better positioned, while older Otto-cycle assets face significant retrofit or retirement decisions by the end of the decade. Vessel owners who invest early in methane-abatement measures can safeguard rechartering opportunities during the 2026-2031 period. Conversely, those who delay such investments are likely to encounter reduced vessel valuations and diminished pricing power.
African Gas-To-Power Tenders Are a Structural Demand Catalyst
The floating LNG power vessel market presents significant opportunities in Africa due to simultaneous demand growth and infrastructure gaps. The African Energy Chamber projects a 60% increase in the continent's natural gas demand by 2050. This long-term demand is already translating into operational projects, such as Karpowership’s integrated LNG-to-power system off Dakar, which commenced commercial operations in 2025. With a capacity of 335 MW, it can meet up to 25% of Senegal’s electricity needs. This project is notable for the floating LNG power vessel market as it demonstrated the feasibility of ship-to-ship regasification and floating power generation without requiring onshore gas infrastructure, thereby reducing project lead times in financially constrained environments. However, financial challenges remain a key limitation. For instance, by May 2026, Ghana’s Karpowership receivables exceeded USD 370 million despite progress in payment terms, highlighting the impact of sovereign collection risks on vessel deployment. Nevertheless, new investments continue to flow into the market. In February 2026, Vitol joined a South African gas-to-power consortium with ACWA Power, signaling that major commodity traders now regard floating LNG power as a viable infrastructure investment rather than a temporary solution. The combination of growing demand, offshore gas availability, and modular deployment positions Africa as a key growth region for the floating LNG power vessel market during the forecast period.
AI-Driven Load-Balancing Software Is Redefining Barge Operational Economics
The floating LNG power vessel market is expanding its applications in flexible power generation, driven by advancements in software, battery integration, and mobile gas turbines, which enhance the responsiveness of floating assets to variable grid conditions. GE Vernova's launch of the 34 MW TM2500 DLE unit in March 2025 exemplified this shift, offering a five-minute fast-start cycle, 39% efficiency, and near-zero methane slip, making it suitable for rapid-response dispatch scenarios. A significant commercial development occurred in July 2025 when Kinetics and Mitsui O.S.K. Lines signed a memorandum of understanding (MOU) for an integrated floating data-center platform. This platform features 20-73 MW of IT load, seawater cooling, and a Karadeniz Powership as its primary power source. The concept aligns with the operational needs of AI workloads, which require high uptime and location flexibility, while addressing the challenges of slow interconnection and permitting processes in onshore grids across North America, Europe, and Southeast Asia. According to Financial Post, referencing Dell’Oro Group analysis, seawater cooling can enhance data-center energy efficiency by up to 25% compared to air-cooled land-based facilities, bolstering the commercial viability of vessel-based designs in densely populated coastal regions. Consequently, the floating LNG power vessel market is no longer limited to utility offtake agreements. Operators leveraging dispatch software, battery buffering, and floating gas supply can now target behind-the-meter contracts, which offer higher margins compared to traditional spot power sales.
Restraints Impact Analysis*
| Restraint | (~) % Impact on CAGR Forecast | Geographic Relevance | Impact Timeline |
|---|---|---|---|
| LNG shipping over-capacity keeps charter rates volatile | -1.4% | Global; particularly APAC spot markets and South America | Short to medium term (≤ 4 years) |
| High methane-slip regulations threaten dual-fuel engines | -0.8% | EU-port exposure globally; North Asia; emerging APAC | Medium to long term (2–6 years) |
| Insurance premiums for cyclone-prone moorings | -0.3% | Southeast Asia (Bay of Bengal, South China Sea), Caribbean, Gulf of Mexico | Medium term (2–4 years) |
| Limited berth availability at congested coal terminals | -0.2% | South and Southeast Asia (India, Indonesia, Vietnam); Sub-Saharan Africa | Short to medium term (≤ 4 years) |
| Source: Mordor Intelligence | |||
Charter Rate Volatility Creates Financing Risk Across The Value Chain
The floating LNG power vessel market experiences financing challenges when charter pricing fluctuates significantly, as vessel economics, fuel pass-through terms, and tariff recovery are closely tied to the rate cycle at the time of contract signing. FSRU charter rates, which averaged USD 80,000-120,000 per day before 2022, surged to USD 180,000-200,000 per day following the European energy crisis and stabilized at approximately USD 130,000-150,000 per day for converted vessels by mid-2024, according to the analysis referenced in the draft. A key issue for the market is the difficulty in structuring long-term Power Purchase Agreements (PPAs) in a declining LNG and charter market. Pass-through clauses transfer volatility to off-takers, while fixed-price structures reduce operator margins. For instance, the draft highlights Brazil, where charter contracts for eight FSRUs were estimated at nearly USD 1 million per day, amounting to USD 1.5 billion over four years, with costs passed through regulated tariffs. Operators who secured charters during the 2022-2023 peak now face disadvantages in rebidding, competing against lower-cost vessels in a softer market. While this does not eliminate demand for floating LNG power vessels, it increases challenges related to financing, refinancing, and tariff approvals throughout the value chain.
Methane-Slip Regulation Is Narrowing The Operational Life Of Older Dual-Fuel Fleets
Methane-slip regulations are emerging as a significant structural constraint on the floating LNG power vessel market, as they impact the economic viability of existing dual-fuel fleets rather than solely focusing on future newbuilds. The IMO's adoption of MEPC.402(83) in April 2025 established formal guidelines for test-bed and onboard methane-slip measurement, elevating methane from a technical performance issue to a compliance and cost consideration. This regulatory shift is evident in user-supplied data, where Otto medium-speed engines with a 3.1% methane slip generate a GHG fuel intensity of 91.03 gCO2e/MJ, exceeding the IMO 2028 base target of 89.57 gCO2e/MJ. The EU ETS further intensifies cost pressures, as methane and nitrous oxide were included in its coverage in 2026, requiring EU-port callers to surrender allowances tied to 70% of their 2025 emissions. In January 2026, Wärtsilä announced that retrofit kits for 34DF, 46FDF, and 50DF engines could reduce methane slip by up to 65%, while Spark Gas conversion for 50DF engines could achieve a 75% reduction. However, older vessels with fewer than 10 years of remaining charter life may not justify the cost of retrofitting, likely leading to a sharper division in the floating LNG power vessel market between upgradeable assets and those approaching obsolescence.
*Our forecasts treat driver/restraint impacts as directional, not additive. The impact forecasts reflect baseline growth, mix effects, and variable interactions.
Segment Analysis
By Type: Power Barges Lead Current Deployment While Power Ships Gain On Speed And Flexibility
Power barges accounted for 59.6% of the floating LNG power vessel market share in 2025, while power ships are projected to grow at a compound annual growth rate (CAGR) of 5.1% through 2031. The dominance of power barges is attributed to their simpler structural design, which reduces hull costs and provides additional deck space for turbines, heat recovery systems, and control equipment. This design advantage typically lowers total capital expenditure (CAPEX) by 15-20% compared to similar power ships, making barges a cost-effective option in price-sensitive tenders. In the floating LNG power vessel market, the lower construction costs of barges align well with base-load contracts where mobility is less critical, and installation efficiency and stable output are prioritized.
Power ships are gaining market share more rapidly due to their self-propulsion capabilities, which enable redeployment within weeks of a contract award. This feature is particularly advantageous in emergency tenders and short-notice capacity auctions. For instance, ST Engineering’s October 2025 contract for Estrella del Mar IV, a 145 MW floating combined-cycle plant equipped with onboard lithium-ion battery storage, highlights the increasing integration of mobility with hybrid dispatch capabilities. This flexibility allows vessels to transition between base-load and peak support roles, expanding revenue opportunities while maintaining their core gas-to-power function within the floating LNG power vessel market. While power barges are expected to remain the dominant format over the forecast period, power ships are poised to gain traction in scenarios where governments prioritize rapid response times, contract flexibility, and the ability to relocate capacity across borders with minimal civil infrastructure requirements.
By Power Capacity: Mid-Sized Units Anchor Demand While Utility-Scale Vessels Gain Ground
The 51-200 MW range represented 49.3% of the floating LNG power vessel market size in 2025, highlighting its suitability for island grids, remote industrial loads, and smaller urban systems. At this capacity, combined-cycle gas turbine configurations become feasible on floating platforms, achieving net efficiency levels of 50-55%, compared to 35-42% for simple-cycle open-frame systems. This range offers a balance between manageable vessel size and improved fuel efficiency, making it a key segment for applications requiring steady output without the capacity to accommodate large single-vessel installations.
The ≥ 401 MW category is projected to be the fastest-growing segment, with a compound annual growth rate (CAGR) of 5.9% through 2031. This growth is driven by utilities prioritizing single-vessel solutions to minimize coordination risks associated with multiple units. This trend is particularly evident in South Asia and Africa, where large-scale utility procurement increasingly favors larger floating plants over modular additions. By May 2026, Karpowership’s fleet had surpassed 8,500 MW across 45 vessels, demonstrating the commercial viability of large-scale deployments. Meanwhile, the ≤ 50 MW range remains significant for emergency backup and small-island applications, while the 201-400 MW range continues to serve mining operations, offshore oil-field supply, and remote industrial power needs, where mid-sized vessels are advantageous due to fuel logistics and grid absorption considerations.


By Application: Base-Load Supply Holds The Core While Emergency Demand Expands Faster
Base-load supply accounted for 52.4% of the floating LNG power vessel market in 2025, indicating that these assets are primarily utilized as primary grid capacity rather than for short-duration backup. This dominance is attributed to long-term power purchase agreements (PPAs) spanning 5-25 years, which provide the revenue visibility necessary for project financing and vessel conversion economics. As a result, base-load remains the most stable application in the floating LNG power vessel market, particularly in systems where intermittent renewable energy cannot yet replace thermal supply at a utility scale. Additionally, this explains the continued appeal of integrated LNG intake and power output in countries with underdeveloped onshore gas infrastructure.
The emergency and disaster relief segment is projected to grow at a compound annual growth rate (CAGR) of 6.2% through 2031, making it the fastest-growing application. For instance, Guyana’s March 2026 extension of its Karpowership contract, valued at nearly USD 235,000 per day, highlights how short-term emergency reliance can extend when onshore gas projects face repeated delays. Peak power also remains a significant niche, particularly in grids where daytime solar generation creates a trough before evening demand surges, necessitating fast-start thermal support. Furthermore, the report distinguishes LNG floating assets from diesel genset solutions, as LNG vessels equipped with onboard regasification can sustain utility-scale supply for weeks, whereas conventional emergency gensets typically offer only 3-7 days of fuel autonomy.
By End-user: Utilities Remain Dominant While Data-Centre Contracts Open A Higher-Growth Niche
Utilities and Independent Power Producers (IPPs) accounted for a 48.7% market share in 2025, maintaining their position as the largest end-user group in the floating LNG power vessel market. This dominance is attributed to government-backed offtake structures prevalent in regions such as Sub-Saharan Africa, Southeast Asia, and South America, where state entities or regulated utilities continue to influence grid access and auction frameworks. Industrial users, including those in mining, oil and gas, and desalination, represent the next significant demand segment. These industries rely on floating LNG power vessels due to the high costs of diesel logistics and limited access to transmission infrastructure in remote locations. Consequently, the market remains heavily reliant on public or quasi-public procurement to achieve scale, even as commercial users gradually expand the demand base.
The commercial and data-center segment is the fastest-growing end-user group, with a projected compound annual growth rate (CAGR) of 7.1% through 2031. Regulatory developments, such as Singapore's mandate requiring new or repowered gas plants to be at least 30% hydrogen-compatible by volume, and agreements like Bridge Data Centres' March 2026 memorandum of understanding (MOU) with Concord New Energy for barge-based power supply, highlight the shift of floating power solutions into more stringent commercial environments. Unlike utility power purchase agreements (PPAs), contracts in this segment cater to hyperscalers demanding at least 99.99% uptime, stricter voltage quality, and shorter contract durations. These requirements influence both vessel design and service structures. Operators capable of meeting these conditions are positioned to secure a premium in the floating LNG power vessel market by offering reliability and rapid deployment in addition to power generation capacity.
Geography Analysis
Asia-Pacific accounted for 36.1% of the floating LNG power vessel market share in 2025, making it the largest regional base for current demand. The region benefits from a combination of island electrification needs, dense coastal load centers, and a mature LNG supply chain across countries such as Indonesia, Malaysia, Japan, and South Korea. Indonesia remains a key market, with PLN EPI launching a USD 1.5 billion small-scale LNG program in March 2025 to support 41 island plants. A peer-reviewed analysis highlighted that integrated FSRPP structures reduce costs by eliminating a supply-chain link that can account for 30-40% of the delivered gas price when assets are separated. Additionally, the region is expanding beyond established markets, as evidenced by the Haiphong FSRU project in Vietnam and JERA’s proposed Hawaii FSRU-linked program, demonstrating that Asia-Pacific expertise is being exported to adjacent island-power corridors.
The Middle East and Africa are projected to grow at a 4.6% CAGR through 2031, making it the fastest-expanding region in the floating LNG power vessel market. This growth is supported by the African Energy Chamber’s projection that natural gas demand across Africa will increase by 60% by 2050. Senegal’s Dakar project exemplifies this trend with a 335 MW integrated LNG-to-power system capable of meeting up to 25% of national demand without requiring onshore gas infrastructure. Egypt is further solidifying its role as a floating gas hub, with Höegh Evi’s 10-year charter for the Hoegh Gandria expected to add up to 1,000 mmscfd of peak regasification capacity at Port of Sumed starting in Q4 2026. Similarly, Jordan’s decision in May 2026 to lease a new FSRU for Aqaba underscores the growing reliance on floating regasification as a standard component of grid gas supply security in the region.
While Europe and the Americas currently represent smaller markets in terms of scale, they remain strategically significant for the floating LNG power vessel market. These regions combine reserve-power needs, gas-security concerns, and selective large-capacity procurement. In Brazil, the 2026 reserve capacity auction contracted nearly 8.5 GW of LNG-fired thermal capacity, attracting an estimated BRL 48 billion (USD 9.6 billion) in investment to support new or expanded FSRU infrastructure across multiple states. In the Americas, Mexico’s Yucatán deployment and JERA’s Hawaii proposal highlight opportunities in both frontier and regulated systems where dispatchable power is required before onshore infrastructure becomes operational. In Europe, supply security remains a priority, with Congo LNG output reaching 3 million tonnes per year in early 2026, providing an additional floating supply source for utilities aiming to reduce reliance on Russian gas.

Competitive Landscape
The floating LNG power vessel market is moderately concentrated, with Karpowership maintaining a significantly larger installed-capacity base compared to other competitors. As of May 2026, Karpowership had over 8,500 MW installed across 45 vessels in 14 countries, providing the company with a scale advantage in execution, redeployment, and charter credibility. The competitive landscape below Karpowership is divided among shipbuilders, turbine suppliers, regasification specialists, and conversion yards, including Siemens Energy, Wärtsilä, GE Vernova, MAN Energy Solutions, and Seatrium. Seatrium plays a critical role, having executed over 90% of global FSRU conversions and securing a March 2026 contract for the eighth Karpowership-linked conversion, the LNGT Karadeniz, which has a regasification capacity of up to 600 mmscfd.
The floating LNG power vessel market retains competitive opportunities in the ≥ 401 MW class and in floating data-center power, where technical complexity and contract design are more challenging to replicate. Wison New Energies enhanced its market position in August 2025 with the successful deployment of FLNG Nguya after 33 months. The company also advanced a 230 MW floating barge concept for Nigerian assets following a December 2024 FEED announcement. Chinese yards, such as Hanwha Ocean and CMHI Haimen, are emerging as cost-effective newbuild options. However, they are not yet at Seatrium’s level of expertise in specialized FSRU conversions. Intellectual property is becoming a key competitive differentiator, particularly in low-methane-slip combustion systems and modular regasification engineering, where upgrade capabilities are increasingly important as compliance costs rise.
A broader strategic trend is evident in the floating LNG power vessel market. Karpowership’s August 2025 Letter of Intent (LOI) with Seatrium for four new floating power plants and three FSRU conversions, along with its acquisition of a Texas shipyard, indicates a deliberate strategy to internalize more hull integration and fabrication costs. This shift highlights the growing importance of bundled capabilities in the market. Competitive advantage in the floating LNG power vessel market is evolving beyond vessel ownership to encompass integrated capabilities. Operators that can offer a comprehensive package, including LNG sourcing, storage, regasification, generation, and dispatch optimization, are likely to capture a larger share of the market compared to those focusing on individual technical components. Additionally, methane-slip performance and engine configuration are becoming critical aspects of competitive positioning, as buyers increasingly prioritize compliance durability throughout the forecast period. While the market supports a dominant operator like Karpowership, there remains room for specialized players that excel in areas such as conversion speed, emissions control, hybrid dispatch, or integrated project delivery.
Floating LNG Power Plant Industry Leaders
Karpowership
Siemens Energy
Wärtsilä
MODEC
Kawasaki Heavy Industries
- *Disclaimer: Major Players sorted in no particular order

Recent Industry Developments
- May 2026: Karpowership has announced its entry into Mexico with a 250 MW project designed to enhance the peninsular electricity subsystem. The project will be executed in partnership with SENER, CENACE, CFE, and the government of Quintana Roo. Under the agreement, Karpowership will deploy a 250 MW Powership along with an LNG Terminal Ship (LNGTS) to deliver reliable and dispatchable electricity to the peninsular subsystem.
- May 2026: Italian energy company Eni is considering the installation of a third floating liquefied natural gas (FLNG) platform off the coast of Mozambique. In October of the previous year, Eni concluded its investment decision for the second platform, Coral North. This facility is projected to increase Mozambique's LNG production capacity to over seven million tonnes per annum by 2028.
- May 2026: Jordan's National Electric Power Company has entered into an agreement with Excelerate Energy to lease a new Floating Storage and Regasification Unit (FSRU) for the Sheikh Sabah LNG Terminal in Aqaba. This arrangement ensures a continuous supply of natural gas until the completion of an onshore regasification unit.
- February 2026: Vitol Group joined a consortium to develop a gas-to-power project in South Africa targeting replacement of ageing coal-fired generation, with ACWA Power identified as the potential developer


Global Floating LNG Power Plant Market Report Scope
A floating LNG power plant (FLNG) is an LNG power plant assembled on a ship or a barge with LNG storage and offloading facilities. The floating LNG power plant market is segmented by component type, such as gas engines or gas turbines, IC engines, and steam turbines and generators. The market is segmented by vessel type, such as power barge and power ship.
The Global Floating LNG Power Plant Market is segmented into type, power capacity, application, end-user, and geography. By type, the market is segmented into power barge and power ship. By power capacity, the market is segmented into ≤ 50 MW, 51–200 MW, 201–400 MW, and ≥ 401 MW. By application, the market is segmented into peak power supply, base-load supply, and emergency/disaster relief. By end-user, the market is segmented into utilities and independent power producers (IPPs), industrial sectors including mining, oil and gas, and desalination, and commercial and data-centers. The report also covers the market size and forecasts for the floating LNG power plant market in 24 countries across major region For each segment, the market sizing and forecasts have been done on the basis of value (USD).
| Power Barge |
| Power Ship |
| less than 50 MW |
| 51 - 200 MW |
| 201 - 400 MW |
| more than 401 MW |
| Peak Power Supply |
| Base-Load Supply |
| Emergency / Disaster Relief |
| Utilities & IPPs |
| Industrial (Mining, O&G, Desalination) |
| Commercial & Data-Centres |
| North America | United States |
| Canada | |
| Mexico | |
| Europe | United Kingdom |
| Germany | |
| France | |
| Spain | |
| Nordic Countries | |
| Russia | |
| Rest of Europe | |
| Asia-Pacific | China |
| India | |
| Japan | |
| South Korea | |
| Malaysia | |
| Thailand | |
| Indonesia | |
| Vietnam | |
| Australia | |
| Rest of Asia-Pacific | |
| South America | Brazil |
| Argentina | |
| Colombia | |
| Rest of South America | |
| Middle East and Africa | United Arab Emirates |
| Saudi Arabia | |
| South Africa | |
| Egypt | |
| Rest of Middle East and Africa |
| By Type | Power Barge | |
| Power Ship | ||
| By Power Capacity | less than 50 MW | |
| 51 - 200 MW | ||
| 201 - 400 MW | ||
| more than 401 MW | ||
| By Application | Peak Power Supply | |
| Base-Load Supply | ||
| Emergency / Disaster Relief | ||
| By End-user | Utilities & IPPs | |
| Industrial (Mining, O&G, Desalination) | ||
| Commercial & Data-Centres | ||
| By Geography | North America | United States |
| Canada | ||
| Mexico | ||
| Europe | United Kingdom | |
| Germany | ||
| France | ||
| Spain | ||
| Nordic Countries | ||
| Russia | ||
| Rest of Europe | ||
| Asia-Pacific | China | |
| India | ||
| Japan | ||
| South Korea | ||
| Malaysia | ||
| Thailand | ||
| Indonesia | ||
| Vietnam | ||
| Australia | ||
| Rest of Asia-Pacific | ||
| South America | Brazil | |
| Argentina | ||
| Colombia | ||
| Rest of South America | ||
| Middle East and Africa | United Arab Emirates | |
| Saudi Arabia | ||
| South Africa | ||
| Egypt | ||
| Rest of Middle East and Africa | ||


Key Questions Answered in the Report
What is the 2026 to 2031 growth outlook for floating LNG power vessels?
The global floating LNG power vessel market is projected to grow from USD 656.4 million in 2026 to USD 815.3 million by 2031 at a 4.4% CAGR.
Why is LNG gaining over diesel for floating power use?
The key reason is fuel economics. User-supplied research showed delivered natural gas at USD 10.4-11.3 per MMBtu in Indonesian island systems versus USD 25.5 per MMBtu for high-speed diesel.
Which region leads current demand?
Asia-Pacific led with 36.1% share in 2025, supported by island electrification, LNG supply-chain depth, and diesel-displacement programs.
Which region is growing fastest through 2031?
The Middle East and Africa is forecast to grow fastest at a 4.6% CAGR, helped by gas-to-power demand, FSRU deployment, and expanding African gas consumption.
Which vessel type and use case dominate today?
Power barges led by type with 59.6% share in 2025, while base-load supply led by application with 52.4% share.
What is the main regulatory risk for operators?
Methane-slip exposure is the main regulatory risk, because older Otto-cycle dual-fuel engines face rising compliance costs under IMO rules and the EU ETS from 2026 onward.
Page last updated on:


