Market Overview
| Study Period | 2021 - 2031 |
|---|---|
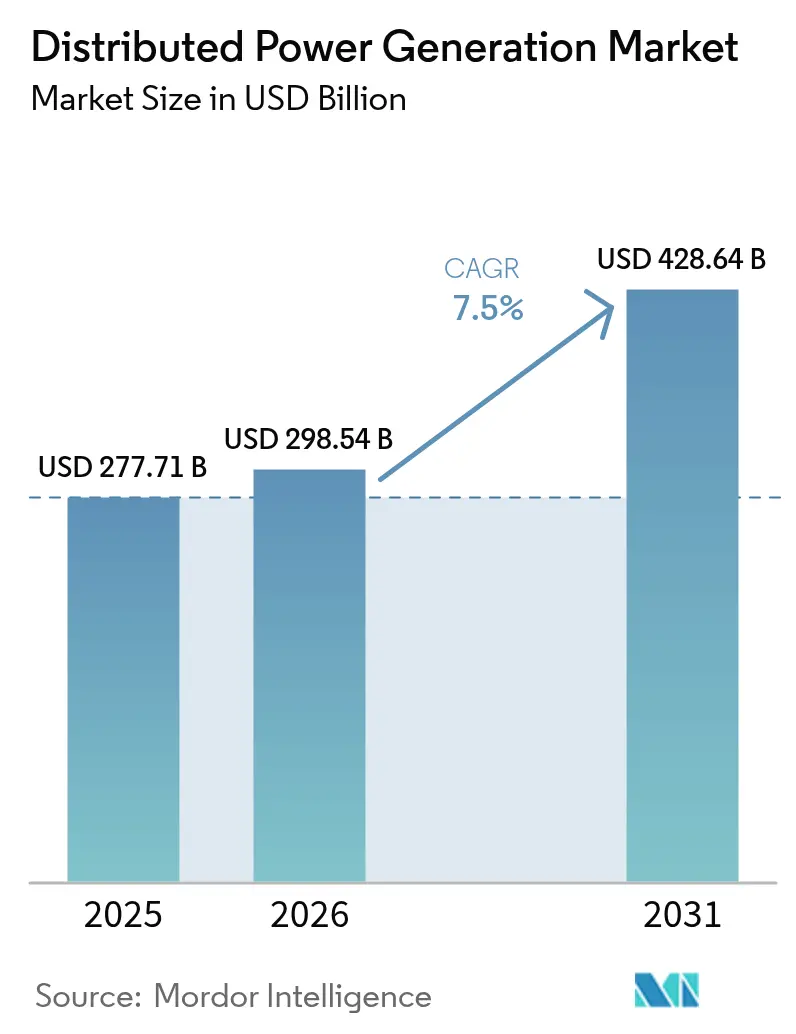
| Market Size (2026) | USD 298.54 Billion |
| Market Size (2031) | USD 428.64 Billion |
| Growth Rate (2026 - 2031) | 7.50% CAGR |
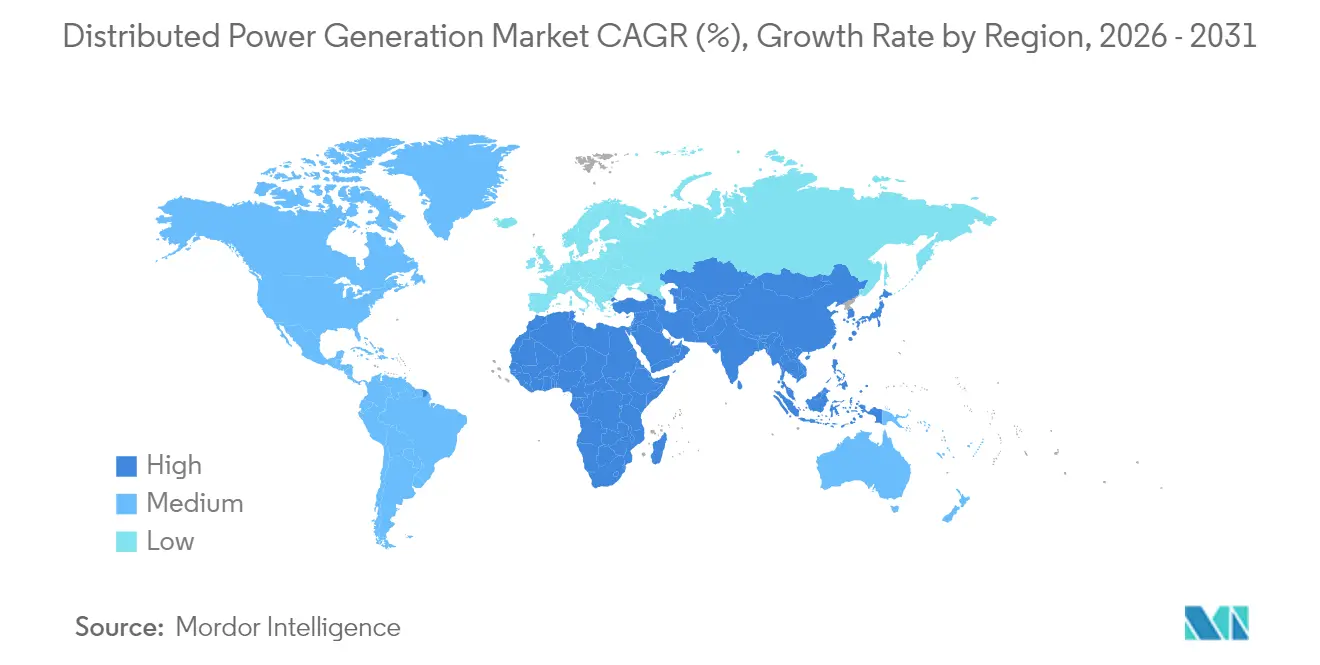
| Fastest Growing Market | Asia Pacific |
| Largest Market | Asia Pacific |
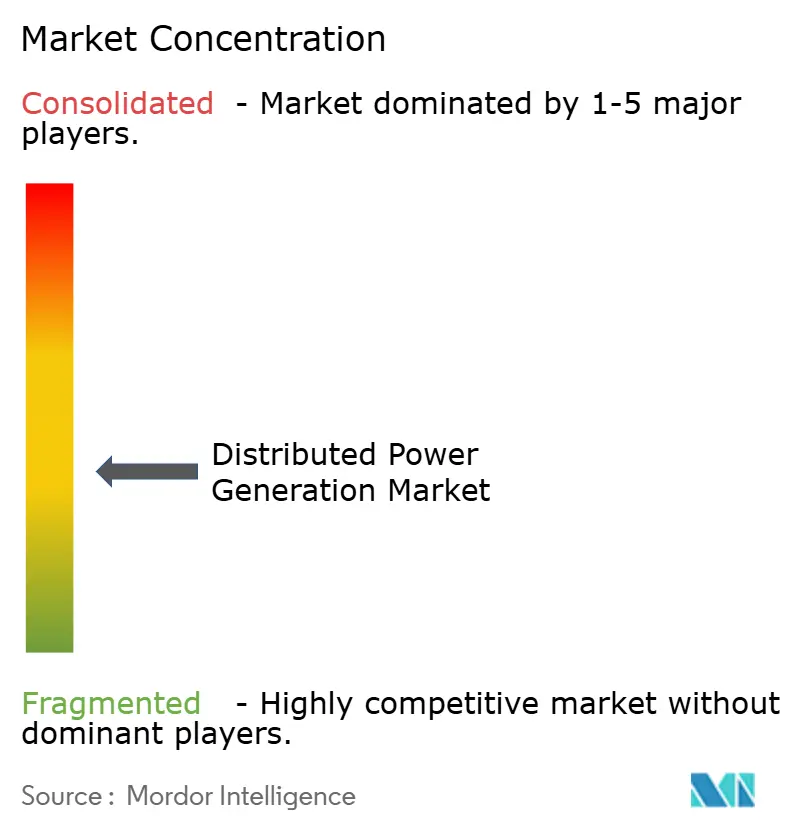
| Market Concentration | Medium |
Major Players *Disclaimer: Major Players sorted in no particular order Image © Mordor Intelligence. Reuse requires attribution under CC BY 4.0. | |
Distributed Power Generation Market Analysis by Mordor Intelligence
The Distributed Power Generation market size is expected to grow from USD 277.71 billion in 2025 to USD 298.54 billion in 2026 and is forecast to reach USD 428.64 billion by 2031 at 7.5% CAGR over 2026-2031.
The expansion reflects a structural move from centralized supply toward local assets that combine solar, fuel-flexible engines, and digital controls. Widespread equipment cost reductions, pro-renewable regulations, and rising grid-resilience needs are the main accelerants. Asia-Pacific anchors volume and momentum, while North America leverages abundant gas, and Europe focuses on energy security. Technology competition revolves around hydrogen-ready fuel cells and integrated microgrid offerings that bundle storage, software, and services. At the same time, interconnection bottlenecks, energy-storage capital needs, and tightening emission caps shape investment risk.
Key Report Takeaways
- By Technology, solar photovoltaics led with 34.62% revenue share in 2025, whereas fuel cells are forecast to expand at 11.25% CAGR through 2031.
- By Power rating, the 0-100 kW band accounted for 46.28% of the distributed power generation market share in 2025; systems above 1,000 kW are set to advance at a 9.85% CAGR to 2031.
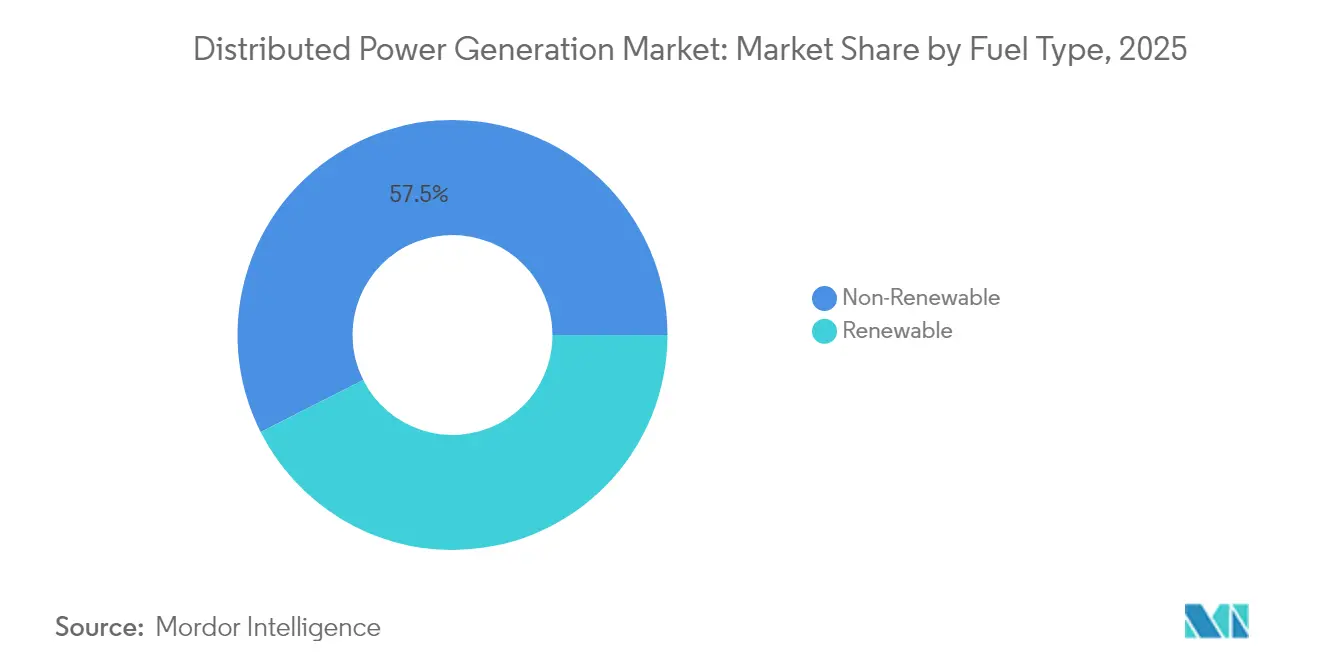
- By Fuel Type, non-renewable commanded a 57.45% share in 2025, while renewable is the fastest-growing with a 12.98% CAGR through 2031.
- By Connectivity, on-grid projects captured 64.38% of revenues in 2025; off-grid schemes are growing at a 10.45% CAGR as remote microgrids scale.
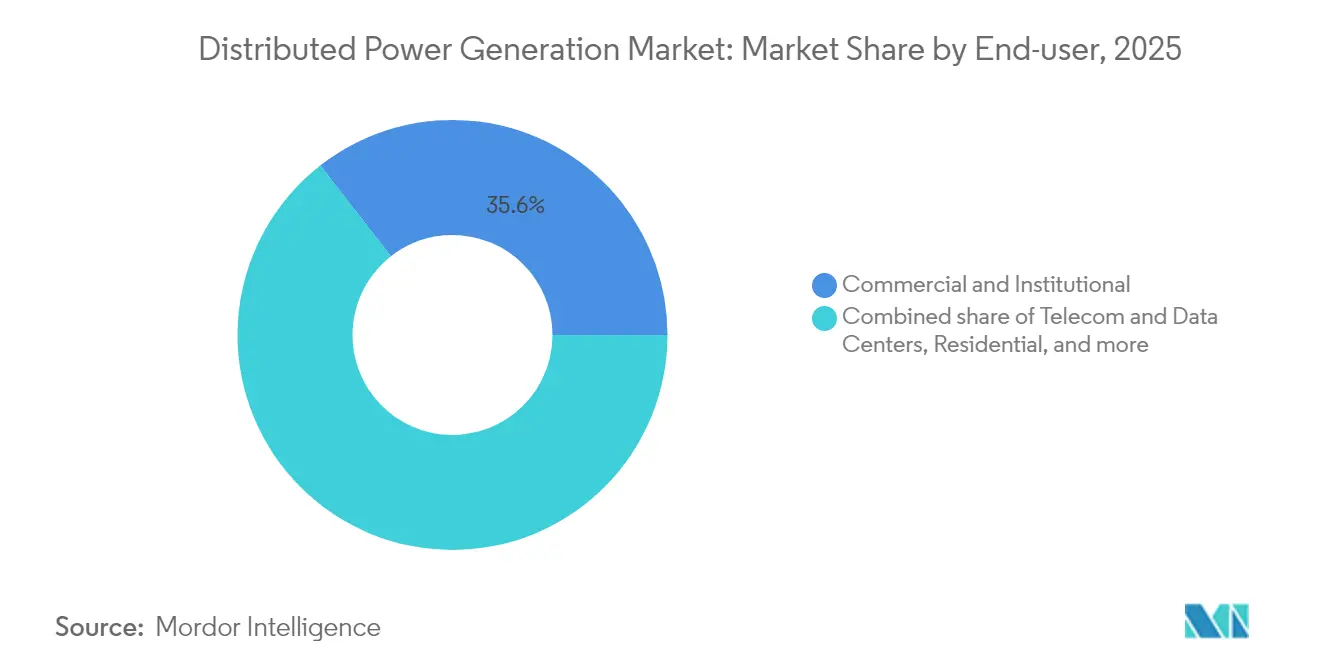
- By End-user, commercial and institutional facilities held 35.55% of demand in 2025, while telecom and data-center installations are rising at a 11.95% CAGR during the outlook period.
- By Geography, Asia-Pacific commanded a 43.55% share in 2025 and remains the fastest-growing region with a 10.7% CAGR through 2031.
Note: Market size and forecast figures in this report are generated using Mordor Intelligence’s proprietary estimation framework, updated with the latest available data and insights as of 2026.
Global Distributed Power Generation Market Trends and Insights
Drivers Impact Analysis*
| Driver | (~) % Impact on CAGR Forecast | Geographic Relevance | Impact Timeline |
|---|---|---|---|
| Rapid decline in small-scale solar-PV LCOE | +2.80% | Asia-Pacific core; spill-over to MEA | Medium term (2-4 years) |
| Booming commercial & industrial behind-the-meter installations | +2.10% | Europe & North America | Short term (≤ 2 years) |
| Microgrid adoption for telecom towers | +1.90% | Africa, Middle East, island nations | Long term (≥ 4 years) |
| Natural-gas price volatility shifting demand toward biogas gensets | +1.40% | North America | Medium term (2-4 years) |
| Mandated renewable portfolio standards for municipal utilities | +1.60% | United States | Long term (≥ 4 years) |
| Hydrogen-ready fuel-cell pilots in data centers | +1.30% | Middle East, global data centers | Long term (≥ 4 years) |
| Source: Mordor Intelligence | |||
Rapid Decline in Small-Scale Solar-PV LCOE
Chinese TOPCon module prices fell to USD 0.16 per watt in 2024, driving a region-wide drop in levelized electricity costs and reshaping distributed economics.(1)Source: International Renewable Energy Agency, “Renewable Power Generation Costs in 2024,” irena.org Installation labor standardization, low-cost inverters, and concessional finance amplify the effect, positioning Asia-Pacific as the global benchmark for small-scale PV. Governments streamline permitting and grid-code rules, further shortening project cycles. The price pressure forces suppliers elsewhere to differentiate on efficiency and application-specific design.
Booming Commercial & Industrial Behind-the-Meter Installations
European firms accelerate on-site generation to hedge volatile wholesale prices and meet corporate decarbonization pledges. Record rooftop additions in Germany follow EU rules that require solar on new commercial buildings from 2026, broadening to retrofits by 2028.(2)Source: European Parliament, “Directive on Solar Energy in Buildings,” europarl.europa.eu Battery systems paired with PV allow load shifting and ancillary service income, making distributed assets a financial and environmental tool. North American businesses replicate the model, spurred by federal tax incentives and state clean-energy mandates.
Microgrid Adoption for Telecom Towers across Africa & Islands
Reliable power for mobile networks is mission-critical, yet diesel logistics inflate costs in remote areas. Solar-plus-battery microgrids now underpin multi-site rollouts, with operators such as IHS Nigeria and CrossBoundary Energy proving bankability for tower clusters. Integration of satellite backhaul and IoT monitoring reduces on-site intervention, improving uptime. Development finance institutions channel concessional capital, extending microgrid designs to adjacent communities and reinforcing energy-access goals.
Natural-Gas Price Volatility Shifting Demand toward Biogas Gensets
U.S. natural gas spot prices averaged USD 4.15 per MMBtu in Q1 2025 and remain exposed to LNG export swings.(3)Source: U.S. Energy Information Administration, “Short-Term Energy Outlook June 2025,” eia.gov Distributed operators mitigate price risk by deploying dual-fuel gensets able to switch to biogas or renewable natural gas. Long-term power-purchase contracts capture renewable energy credits, improving project returns. Data centers in constrained grids favor the approach, pairing reciprocating engines with low-carbon fuel pathways.
Restraints Impact Analysis*
| Restraint | (~) % Impact on CAGR Forecast | Geographic Relevance | Impact Timeline |
|---|---|---|---|
| Distribution-network interconnection barriers | −1.8% | Emerging economies worldwide | Medium term (2-4 years) |
| Capital-intensive energy-storage pairing | −2.2% | Global | Short term (≤ 2 years) |
| Stringent NOx/PM limits on diesel gensets | −1.1% | Europe; spreading globally | Long term (≥ 4 years) |
| Complex permitting for rooftop PV in historic centers | −0.9% | Europe; select global cities | Medium term (2-4 years) |
| Source: Mordor Intelligence | |||
Distribution-Network Interconnection Barriers in Emerging Economies
Renewables waiting in global interconnection queues exceed 3,000 GW, and 80% of applications are withdrawn due to escalating costs or long studies.(4)Federal Energy Regulatory Commission, “Final Rule on Generator Interconnection Improvement,” ferc.gov Emerging grids lack modern standards and workforce capacity, so small projects face disproportionate delays. Although a “first-ready, first-served” reform is underway, progress outside advanced markets remains slow, restraining near-term deployment.
Capital-Intensive Energy-Storage Pairing for Intermittent DG
Battery system prices declined to USD 148 per kWh in 2024, yet the up-front spending still strains sub-100 kW projects. Even with Investment Tax Credit bonuses, the levelized cost of 4-hour lithium-ion storage hovers around USD 124 per MWh. Long-duration thermal or compressed-air designs trend lower for 8-hour duty cycles but demand site-specific engineering. Until capital markets accept merchant-storage risk at scale, many distributed schemes limit renewable penetration to avoid oversizing batteries.
*Our forecasts treat driver/restraint impacts as directional, not additive. The impact forecasts reflect baseline growth, mix effects, and variable interactions.
Segment Analysis
By Technology: Fuel Cells Move from Pilot to Portfolio
The solar segment commanded 34.62% of 2025 revenues, anchored by residential and light-commercial rooftops that capitalize on simplified mounting and inverter kits. Solar’s share of the distributed power generation market size for 2025 stood at USD 96.13 billion. Though smaller today, fuel cells deliver the highest 11.25% CAGR, led by projects at data-center campuses where operators seek diesel-free uptime. Caterpillar validated a 1.5 MW hydrogen fuel-cell backup system that met a 99.999% service-level target for a hyperscale facility in Wyoming. Wind micro-turbines and reciprocating gas engines round out the mix, serving niche sites that value either land-use efficiency or combined heat-and-power capability. Competitive dynamics now center on integrating storage and power electronics rather than standalone generation hardware.


By Power Rating: Scale Economics at Both Ends
Household and small-business systems in the 0-100 kW bracket captured 46.28% of 2025 demand, reflecting kit-based procurement and turnkey installation models. The segment accounted for the largest distributed power generation market share in unit terms. At the other extreme, Above 1,000 kW solutions will record a 9.85% CAGR through 2031 as industrial campuses opt for on-site generation to bypass grid constraints. Vendors differentiate through digital twins and O&M analytics that fine-tune dispatch against utility tariffs. Mid-range 101-1,000 kW packages serve hospitals and university estates, balancing standardized skids with limited custom engineering.
By Fuel Type: Renewables to Drive the Market
Non-renewables supplied 57.45% of output in 2025; however, renewables are projected to drive the demand by 12.98% CAGR through 2031 and capture a share of some non-renewable fuel types. Solar and wind still dominate the renewable block, but biogas engines and biomass CHP plants broaden the mix in agri-industrial zones. Natural gas remains the preferred bridging fuel where pipeline access exists, thanks to quick-start capability and lower NOx. Hybrid arrays blend PV or wind with gas engines, steering toward emissions compliance while securing resilience.
By Connectivity: Grid-Interactive Assets Dominate
On-grid assets delivered 64.38% of 2025 revenue, leveraging net-metering, feed-in premiums, and ancillary-service payments. These systems now feature bidirectional inverters and software that monetize frequency and voltage support, extending revenue beyond simple energy exports. Off-grid capacity, growing 10.45% annually, remains essential for island communities and remote mines. Residential “microgrid-in-a-box” solutions that combine solar, a 10-15 kWh battery, and vehicle-to-home EV charging emerged in 2025, offering up to 60% bill savings while enabling grid-service participation when connected.
By End-User: Digital Infrastructure Pulls Ahead
Commercial and institutional users held a 35.55% share in 2025. That bracket includes campuses, healthcare, and municipal buildings, all of which prize cost certainty and resiliency. Datacenter and telecom facilities will post a 11.95% CAGR, rising from modest baselines as AI workloads multiply power density. Vantage Data Centers’ 1 GW microgrid deal with VoltaGrid underscores the trend toward multi-gigawatt-hour gas-plus-battery platforms that sidestep grid delays. Residential adoption benefits from financing innovations such as subscription-based energy-as-a-service that bundles equipment, maintenance, and software in a single bill.
Geography Analysis
Asia-Pacific dominated the distributed power generation market with a 43.55% revenue share in 2025 and continues to post the fastest 10.7% CAGR to 2031. Regional leadership rests on mass-manufactured PV modules, extensive policy incentives, and surging electricity demand. China’s rooftop program alone realized more than 50 GW of new capacity in 2024, while India’s distribution utilities aggregate rooftop installations into virtual power plants. Several Southeast Asian governments are formalizing net-billing regimes, unlocking behind-the-meter investment.
North America ranks second in absolute value and combines an abundant natural gas supply with favorable tax credits. American Municipal Power’s 20 MW behind-the-meter program in Michigan typifies how municipal utilities leverage local generation for peak shaving. Thirty state-level renewable portfolio standards catalyze solar-plus-storage at schools and municipal facilities. Data-center clusters in Virginia, Texas, and Alberta drive early adoption of dual-fuel or hydrogen-ready engines, further lifting the region’s demand profile.
Europe’s distributed strategy aligns with energy-security imperatives following geopolitical gas disruptions. The EU Solar Standard obliges new commercial buildings to integrate PV from 2026, pushing developers toward distributed layouts. France mandates 50% solar coverage on parking lots over 1 500 m², with fines up to EUR 40 000 for non-compliance, accelerating commercial-real-estate retrofits. Germany simplified the registration of “balcony power plants” up to 800 W, broadening household participation. Heritage-site constraints and lengthy city-level permitting temper growth in historic urban cores.

Regulatory Landscape
Distributed power generation regulations are increasingly shaped by interconnection reform and market rules that allow distributed energy resources (DERs) to provide grid services. In the United States, the Federal Energy Regulatory Commission (FERC) set an Order 2222 implementation timeline for November 1, 2026, which clarifies how DER aggregation can participate in wholesale energy and ancillary services markets, while also raising requirements for telemetry, coordination, and measurement and verification across ISO/RTO frameworks.
At the state level, grid-connection process updates are tightening technical and procedural expectations for projects up to small-commercial scale. New York Department of Public Service updated its Standardized Interconnection Requirements (SIR) for distributed generators and energy storage up to 5 MW, effective February 9, 2026, standardizing application steps and equipment requirements. In parallel, Colorado HB26-1225 requires utilities with more than 500,000 customers to convene a working group by August 15, 2026, aimed at accelerating distributed generation interconnection outcomes. In Asia, policy is shifting from export-driven approaches toward self-consumption-oriented rules, including Chinas May 2025 Management Measures for Distributed Photovoltaics, where some provinces apply minimum self-consumption thresholds for projects up to 6 MW.
Competitive Landscape
The distributed power generation market features a balanced mix of diversified industrial OEMs and specialized technology vendors. Caterpillar, Cummins, and Siemens draw on global service networks and multi-fuel engine portfolios, ensuring strong incumbency in larger power classes. Generac’s residential leadership is reinforced by its acquisition of MOTORTECH, adding advanced gaseous-engine controls that enhance product breadth.
Strategic consolidation is accelerating. Deutz purchased Blue Star Power Systems to secure a North American generator share, targeting USD 100 million in incremental revenue. Siemens partnered with EnergyHub to integrate distributed-energy-resource management software, positioning the group for grid-orchestrated value streams. OEMs increasingly bundle storage, controls, and long-term service agreements, reflecting buyer preference for turnkey resilience solutions.
White-space innovation centers on hydrogen fuel cells and island-able microgrids. Ballard Power Systems signed a supply deal with Sierra Northern Railway to repower diesel locomotives, highlighting technology spillovers into heavy transport. Fuel-cell suppliers court data-center operators that require zero-emission backup yet insist on five-nine reliability. Market participants able to orchestrate generation, storage, and load via cloud-based platforms are best positioned to capture premium margins.
Distributed Power Generation Industry Leaders
Ansaldo Energia SpA
Ballard Power Systems Inc.
Caterpillar Inc.
Siemens AG
General Electric Co.
- *Disclaimer: Major Players sorted in no particular order

Market Opportunities and Future Outlook
Regulatory openings that formalize export compensation and grid access create whitespace for on-grid behind-the-meter projects, particularly in emerging markets where DG adoption has been limited by tariff uncertainty. Nigerias Net Billing Regulations 2026 (commenced June 2026 by the Nigerian Electricity Regulatory Commission) establish a mechanism for eligible consumers to generate renewable power and export surplus using bidirectional net metering, supporting commercial and institutional sites that can pair rooftop PV with storage and controls to optimize self-consumption and bill credits.
A second opportunity area is software-led integration and planning, which can reduce technical friction as DG penetration rises and interconnection becomes more demanding. Peer-reviewed methods have identified measurable gains from decentralized coordination and multi-stage optimization for distribution expansion and DER co-location, including cost reductions and improved investor revenue outcomes in modeled networks. This aligns with a shift toward bundled solutions that combine generation, storage, and control software (including DERMS and microgrid controllers), targeting integrated microgrids, grid-interactive inverters, and data-center and telecom resilience deployments where operational performance and dispatch optimization are key buying criteria.
Recent Industry Developments
- June 2026: Ballard Power Systems entered into a definitive agreement to acquire UK-based GeoPura, a provider of hydrogen-based zero-emission power solutions, for an enterprise value of about GBP 301.1 million. The agreement expands Ballards presence beyond fuel-cell stacks into integrated power offerings and services. It also strengthens its positioning in distributed and off-grid applications where customers procure uptime as a packaged solution.
- June 2026: Ballard Power Systems received an order for 15 MW of fuel cell systems for stationary off-grid power generation, with deliveries starting in the second half of 2026. The award reinforces commercial pull for hydrogen-based distributed power in applications that prioritize diesel displacement and high availability.
- June 2025: Ballard Power Systems agreed to supply 1.5 MW of fuel-cell engines to Sierra Northern Railway for hydrogen locomotive retrofits. While the end-use is rail, the contract supports scale-up of fuel-cell power modules and supply chains that also serve stationary distributed generation deployments.


Research Methodology Framework and Report Scope
Market Definition and Coverage
This market covers revenue generated from distributed power generation systems that produce electricity close to where it is used, including equipment and related system sales tied to these installations across major regions.
Scope exclusions: Large, centralized utility scale generation plants and bulk transmission infrastructure are excluded from this sizing.
Segmentation Overview
- By Technology
- Solar Photovoltaic (Rooftop & Ground-Mounted ≤5 MW)
- Wind Turbines (≤5 MW)
- Microturbines
- Gas Turbines (≤50 MW)
- Fuel Cells (PEMFC, SOFC, Others)
- Diesel Gensets
- Natural-Gas Gensets
- Hydrokinetic and Small Hydro (≤10 MW)
- Others (Biomass CHP, Stirling Engines)
- By Power Rating
- 0 to 100 kW
- 101 to 1,000 kW
- Above 1,000 kW
- By Fuel Type
- Renewable
- Non-Renewable
- By Connectivity
- On-Grid
- Off-Grid and Remote
- By End-user
- Residential
- Commercial and Institutional
- Industrial and Manufacturing
- Utility and IPP Peaking/Reserve
- Telecom and Data Centers
- By Geography
- North America
- United States
- Canada
- Mexico
- Europe
- United Kingdom
- Germany
- France
- Spain
- Nordic Countries
- Russia
- Rest of Europe
- Asia-Pacific
- China
- India
- Japan
- South Korea
- Malaysia
- Thailand
- Indonesia
- Vietnam
- Australia
- Rest of Asia-Pacific
- South America
- Brazil
- Argentina
- Colombia
- Rest of South America
- Middle East and Africa
- United Arab Emirates
- Saudi Arabia
- South Africa
- Egypt
- Rest of Middle East and Africa
- North America
Data Sources, Market Sizing, and Validation
Desk Research
Desk research was used to build an outside-in view of demand and policy signals that influence distributed generation adoption, then to anchor key assumptions like average system sizes and cost direction. We leaned on public sources such as International Energy Agency publications, US Energy Information Administration data, World Bank energy indicators, International Renewable Energy Agency statistics, and UN Comtrade trade series for relevant equipment categories.
Along with these, we reviewed company filings and investor presentations to understand technology mix and regional exposure, and we checked reputable press and industry association websites for policy changes and project announcements. Where needed, paid subscriptions for company financials and intelligence, news and financials, patent databases, and shipment-level import and export records were used to cross-check supplier activity and pricing movement, rather than relying on any single data point. The sources listed above are illustrative only, and many other references were also used to collect data, validate assumptions, and clarify open questions.
Primary Interviews and Surveys
Primary work focused on validating what qualifies as distributed generation in real purchase decisions, and on checking how pricing, lead times, and interconnection timelines are shifting by region. We spoke with a mix of manufacturers, integrators, and EPC teams, plus utilities and regulators, and we also included large end users across APAC, EMEA, and the Americas so the desk findings could be corrected, gaps could be filled, and final assumptions could be stress-tested against current ordering behavior.
Distribution of primary research fieldwork respondents
| Company type | Respondent position | Region |
|---|---|---|
| Top tier: 33% | CXOs: 13% | APAC: 43% |
| Mid tier: 49% | Functional/Unit leaders: 36% | EMEA: 37% |
| Smaller Players: 18% | Managers: 51% | Americas: 20% |
Market-Sizing & Forecasting
Sizing starts from a top-down build that reconstructs the addressable distributed generation spend using country level electricity demand growth, distributed capacity additions, and technology cost curves, then adjusts for regional policy and interconnection realities. To keep totals realistic, the outputs are corroborated with selective bottom-up checks, such as rolling up a sample of supplier revenues, channel checks with installers, and an ASP times volume approximation for key equipment types.
Inputs that matter in this market include grid reliability and outage frequency (which affects backup and resilience buys), fuel and power price spreads versus local tariffs, permitting and interconnection cycle times, incentives for onsite renewables and CHP, and the installed base replacement cycle for gensets and small turbines. When a bottom-up proxy is incomplete, gaps are handled by applying adoption ratios from similar markets, then reviewing with primary respondents so the implied penetration stays aligned with what is being ordered.
For forecasting, scenario analysis is used to reflect policy and grid conditions that can shift adoption quickly, and the scenarios are shaped by expert views on expected renewable cost direction, gas price ranges, and regional reliability investments. The final forecast path is selected only after the implied utilization and deployment pace stays consistent with past trend lines and the near-term project pipeline signals gathered during interviews.
Data Validation & Update Cycle
Validation is done through triangulation across independent signals, so model totals are checked against capacity additions, trade and shipment patterns, and supplier commentary on order books. If any region shows an unusual jump, the drivers are re-tested, and follow-up calls are used to confirm whether it is a one-time project effect or a structural shift.
Before sign-off, the work goes through multi-step analyst reviews that look for logic breaks in assumptions, inconsistent currency conversions, and mismatches between pricing and volume trends. The report is refreshed annually, and interim updates are made when material events occur, after which a final pre-delivery check is completed so the client receives the latest view.
Mordor Intelligence's Distributed Power Generation Market Size Compared Against Other Published Estimates
Published market sizes for distributed power generation can look far apart even when the topic label sounds the same, because the included technologies, the treatment of grid connected versus off grid systems, and the pricing basis can change across studies. Differences also show up when one estimate relies more on capacity metrics and another relies more on revenue, which can move in opposite directions during cost declines.
Large, centralized utility scale generation is outside Mordor Intelligence's scope, which is one reason the 2026 value can differ from estimates that blend utility scale build-outs into the same total. The spread is also driven by whether a study counts only equipment revenue at the point of sale, or also includes recurring services, installation labor, and broader microgrid infrastructure, followed by how aggressively future ASP compression is modeled and which currency year is applied in conversions.
Benchmark comparison
| Source | Market Size | Gaps in Research Methodology |
|---|---|---|
| Mordor Intelligence | USD 298.54 B (2026) | |
| Global Consultancy A | USD 312.40 B (2024) | Uses an earlier base year and a broad technology list that can implicitly pull in adjacent distributed energy topics, and the revenue build may rely more on stated totals than on region-by-region adoption and price checks. |
| Industry Publisher B | USD 321.46 B (2023) | Anchors sizing on a different base year and segment map, and the definition may blend multiple power sources and connectivity types without consistently separating distributed systems from larger generation or from services-heavy scope. |
The table shows that the biggest differences come from what gets counted as distributed generation, the year used for the starting point, and how price evolution is handled during the forecast. By keeping the scope tied to systems located near the load and by checking the implied volume and pricing against independent signals, the final number stays traceable to clear inputs that can be re-tested when market conditions shift.


Key Questions Answered in the Report
What is the current distributed power generation market size?
The distributed power generation market size stands at USD 298.54 billion in 2026 and is on track to reach USD 428.64 billion by 2031.
Which region leads the distributed power generation market?
Asia-Pacific holds the lead with a 43.55% revenue share in 2025, driven by low-cost solar manufacturing and rapid electricity-demand growth.
What technology segment is growing fastest?
Fuel cells post the highest 11.25% CAGR to 2031, propelled by data-center and hydrogen-economy investments.
Why are data centers adopting distributed generation?
Data-center operators deploy on-site microgrids to ensure n-five-nine reliability, hedge volatile power prices, and achieve decarbonization pledges.
How do interconnection delays affect the market?
A global queue of 3,000 GW and rising study costs push many distributed projects to adopt hybrid or off-grid configurations while regulators work on queue-reform measures.
Page last updated on:


