Fire Testing Market Size and Share
Market Overview
| Study Period | 2020 - 2031 |
|---|---|
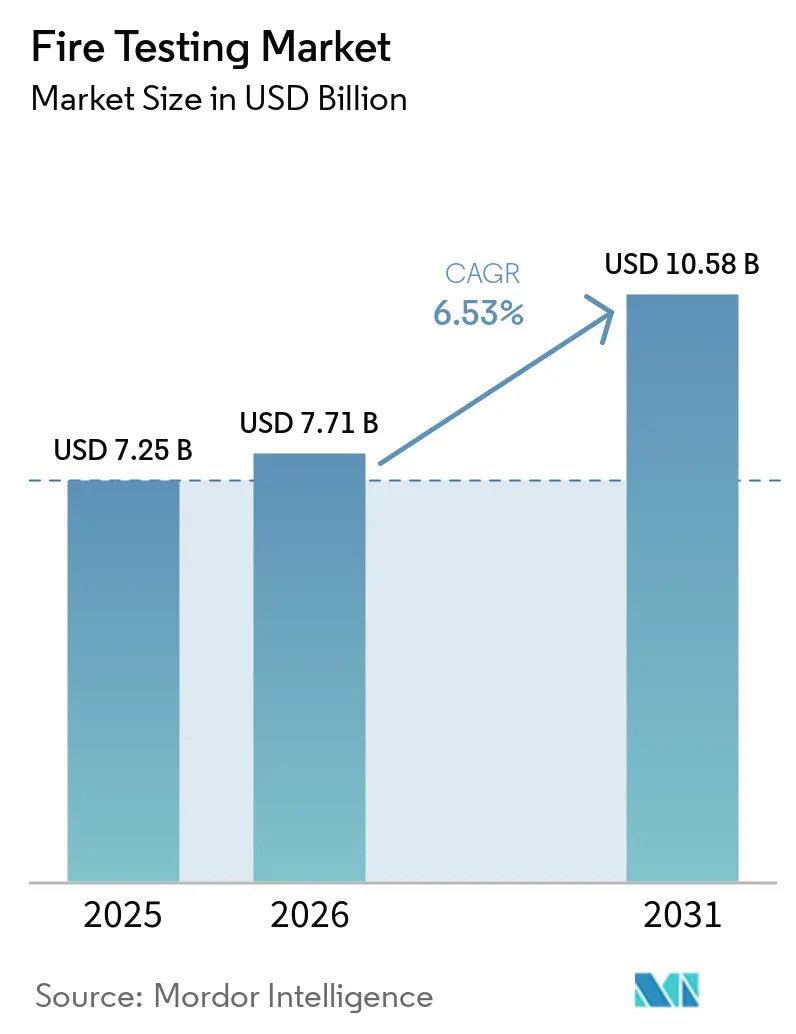
| Market Size (2026) | USD 7.71 Billion |
| Market Size (2031) | USD 10.58 Billion |
| Growth Rate (2026 - 2031) | 6.53% CAGR |
| Fastest Growing Market | Asia Pacific |
| Largest Market | North America |
| Market Concentration | Medium |
Major Players *Disclaimer: Major Players sorted in no particular order Image © Mordor Intelligence. Reuse requires attribution under CC BY 4.0. | |
Fire Testing Market Analysis by Mordor Intelligence
The fire testing market size is expected to grow from USD 7.25 billion in 2025 to USD 7.71 billion in 2026 and is forecast to reach USD 10.58 billion by 2031 at 6.53% CAGR over 2026-2031. The fire testing market is being supported by tighter safety rules, active construction pipelines, and new fire validation needs tied to transport electrification. Demand is also being sustained by private risk control decisions, as insurers, lenders, and developers increasingly require third-party certification before underwriting or approving projects. This keeps the fire testing market more resilient than a pure construction-cycle business because compliance demand now comes from both regulation and capital providers. Competition remains intense, yet larger accredited groups are strengthening their position by offering multi-standard testing across regions and by expanding through acquisitions and new laboratory capacity. The main opportunity lies in faster-growing needs around smoke toxicity, battery systems, and simulation-led workflows, while the main operational risk remains a shortage of accredited large-scale furnace capacity.
Key Report Takeaways
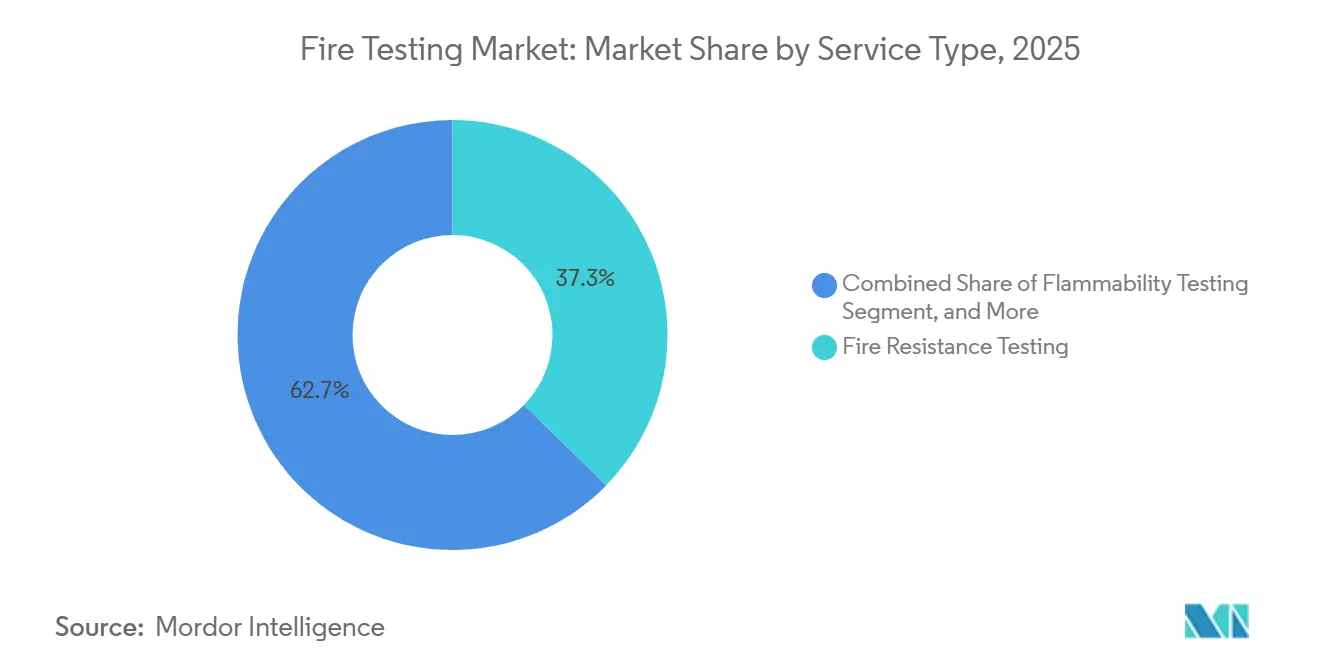
- By service type, fire resistance testing held 37.32% of the fire testing market share in 2025, while smoke and toxicity testing is forecast to expand at 7.27% CAGR through 2031.
- By testing method, full-scale furnace testing accounted for 40.51% of the fire testing market size in 2025, while computer simulation and modelling is projected to grow at 7.41% CAGR through 2031.
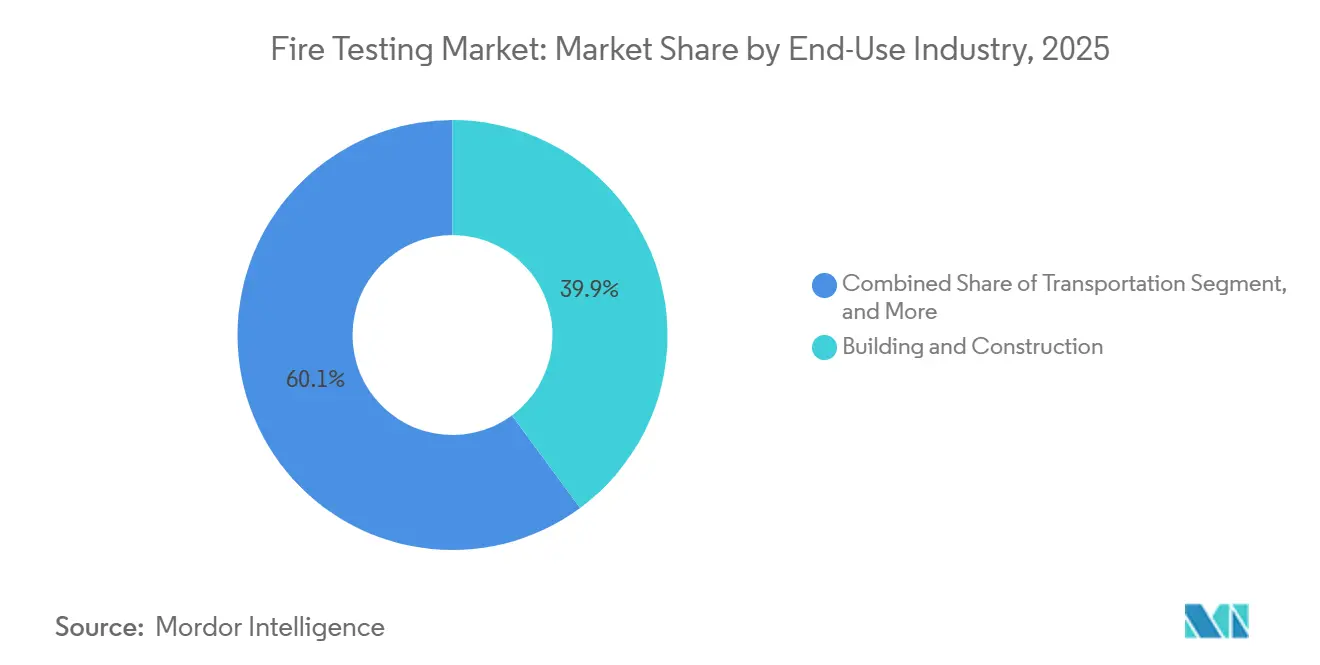
- By end-use industry, building and construction represented 39.88% of the fire testing market size in 2025, while transportation is expected to record the highest CAGR at 7.11% through 2031.
- By material / sample type, structural components represented 30.23% of the fire testing market size in 2025, while polymers and plastics are expected to record the highest CAGR at 6.71% through 2031.
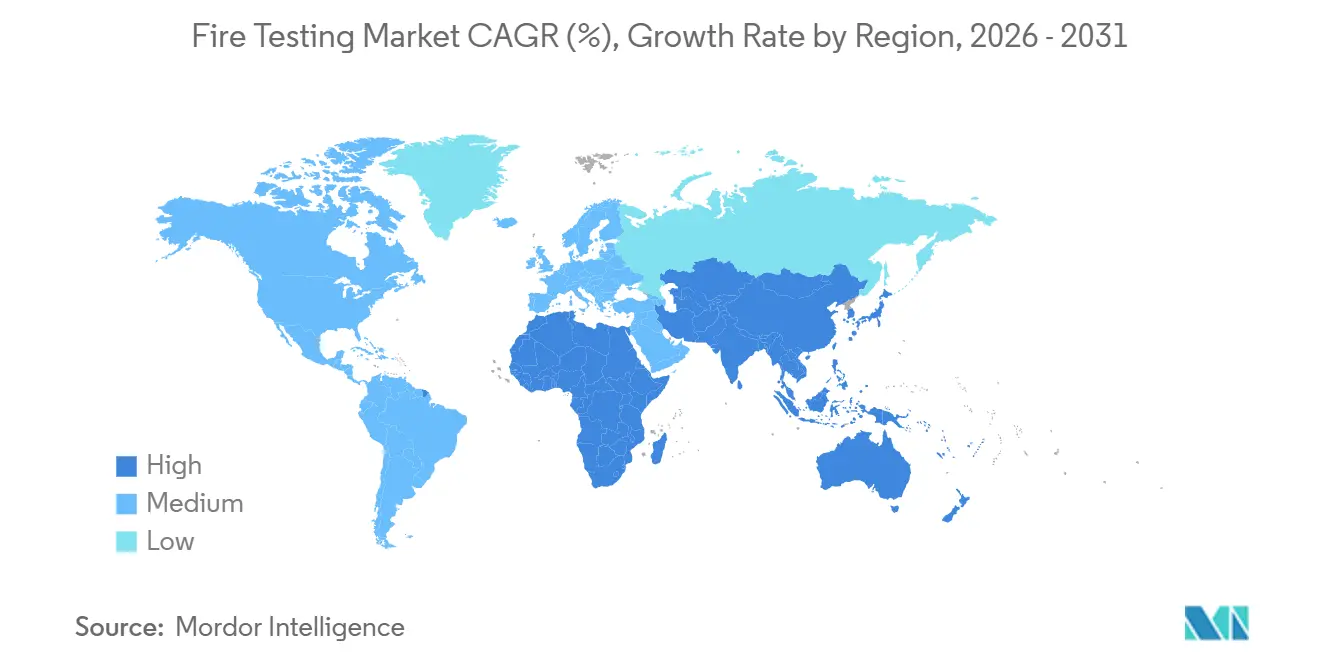
- By geography, North America held 32.95% of the fire testing market share in 2025, while Asia-Pacific is forecast to advance at 7.35% CAGR through 2031.
Note: Market size and forecast figures in this report are generated using Mordor Intelligence’s proprietary estimation framework, updated with the latest available data and insights as of January 2026.
Global Fire Testing Market Trends and Insights
Drivers Impact Analysis*
| Driver | (~) % Impact on CAGR Forecast | Geographic Relevance | Impact Timeline |
|---|---|---|---|
| Stricter Fire Safety Regulations and Code Enforcement | +2.0% | Global, early gains in EU, North America, and APAC | Medium term (2-4 years) |
| Rising Construction and Infrastructure Retrofit Activity | +1.5% | Global, concentrated in APAC, North America, and Middle East | Long term (≥ 4 years) |
| Higher Fire-Safety Validation Needs in Automotive and Transportation Systems | +1.1% | Global, concentrated in China, EU, and North America | Short term (≤ 2 years) |
| Growing Outsourcing of Accredited Third-Party Fire Testing | +0.9% | Global, concentrated in APAC manufacturing hubs and North America | Long term (≥ 4 years) |
| UL 9540A Edition 5 Expanding Battery Energy Storage System Fire Testing Scope | +0.6% | North America and APAC, spill-over to EU | Short term (≤ 2 years) |
| UK Shift Toward EN-Based System Testing for External Wall Assemblies | +0.3% | EU and United Kingdom, spill-over to Commonwealth markets | Medium term (2-4 years) |
| Source: Mordor Intelligence | |||
Stricter Fire Safety Regulations and Code Enforcement
Stricter fire rules across North America, Europe, and Asia-Pacific remain the strongest structural force supporting the fire testing market. The 2026 edition of NFPA 855 now mandates large-scale fire testing under ANSI/CAN/UL 9540A for battery energy storage systems, which pushes buyers toward installation-level validation instead of narrower product-level checks.[1]UL Solutions, “Installation Codes and Requirements for Energy Storage Systems,” UL Solutions, ul.com Europe has also tightened fire classification and fire resistance rules for construction products through updated delegated regulations tied to the Construction Products Regulation framework.[2]Council of the European Union, “Commission Delegated Regulation on Fire Resistance Classes for Construction Products,” Council of the European Union, data.consilium.europa.eu ISO 834-1:2025 updated the general requirements for fire resistance testing in May 2025, which means laboratories and manufacturers must align with revised procedures, instrumentation checks, and reporting practices. ISO/IEC 17025 remains the gatekeeping accreditation standard, so laboratories without recognized accreditation cannot issue test results with regulatory standing in many applications. This combination supports steady demand and firmer pricing because the fire testing market increasingly depends on documented performance evidence rather than checklist-based declarations alone.
Rising Construction and Infrastructure Retrofit Activity
Rising construction and retrofit work are sustaining demand across the fire testing market, but retrofit projects are creating a different workload than new buildings. Existing towers, residential blocks, and commercial properties often need broad retesting when cladding systems, partitions, doors, coatings, or insulation packages are changed. The Grenfell Tower Inquiry Phase 2 report, published in September 2024, exposed systemic failures in external wall fire testing and intensified remediation activity across the United Kingdom. That shift has increased demand for large-scale facade system evaluation, especially where owners and regulators now want proof that system performance reflects real installation conditions rather than isolated material claims. The revised EU framework for construction products is also sustaining recurring test demand as manufacturers seek continued compliance for CE-marked products. Intertek’s May 2025 acquisition of TESIS in Brazil showed that leading TIC groups see construction-led testing demand in South America as a durable, long-cycle growth opportunity rather than a short-lived rebound.
Higher Fire-Safety Validation Needs in Automotive and Transportation Systems
Transportation electrification is creating a fresh demand layer for the fire testing market across road vehicles, rail systems, aircraft cargo, and marine applications. Rail requirements became more formalized with the publication of ISO 9828-1:2025, which established a first-edition framework for fire protection on railway vehicles and increased requalification work for suppliers and rolling stock manufacturers. Aviation cargo also faces tighter performance needs after ISO 19281:2025 updated design, performance, and testing requirements for fire-resistant containers used in civil transport aircraft compartments. Marine demand is also expanding because IMO resolution changes that entered into force in January 2026 added new fire detection requirements and restricted firefighting foams containing PFOS. Battery system validation is becoming a particularly important growth pocket, and DEKRA’s 2025 launch of its Battery Test Center at the Lausitzring reflects the need for dedicated thermal runaway and fire propagation capability. These shifts matter because the fire testing market is no longer tied only to buildings, as mobility systems now require multi-stage validation for cells, packs, enclosures, and full assemblies.
Growing Outsourcing of Accredited Third-Party Fire Testing
Manufacturers are outsourcing a larger share of compliance work to accredited specialists, which continues to widen the addressable base of the fire testing market. The economics are becoming harder to justify for in-house facilities because equipment, staffing, maintenance, and accreditation costs keep rising as test scopes become broader. SGS expanded its ISO/IEC 17025-accredited fire testing scope at Farmingdale, New York, in February 2024, adding aviation, textile, and building materials flammability capability. This outsourcing trend is especially visible in APAC manufacturing hubs, where exporters often need parallel compliance across GB, IEC, and UL frameworks to serve multi-region customers. SGS reinforced this direction by closing its USD 460 million acquisition of Applied Technical Services in January 2026, which added specialized testing and forensics capacity in North America. Applus+ Laboratories also showed how accreditation investment can unlock cross-border demand when its Guadalajara fire laboratory secured ENAC ISO/IEC 17025 recognition and strengthened its standing with Gulf market authorities.
Restraints Impact Analysis*
| Restraint | (~) % Impact on CAGR Forecast | Geographic Relevance | Impact Timeline |
|---|---|---|---|
| High Cost and Complexity of Full-Scale Compliance Testing | -1.3% | Global, particularly acute in emerging markets | Long term (≥ 4 years) |
| Lack of Cross-Laboratory Standard Harmonization | -0.9% | Global, particularly EU-North America cross-border | Medium term (2-4 years) |
| Australia Fire Testing Capacity Loss From the CSIRO North Ryde Closure | -0.4% | Australia, spill-over to APAC and New Zealand | Short term (≤ 2 years) |
| Standards Gaps in Fire Stopping, Structural Timber, and Smoke Toxicity | -0.3% | Global, particularly EU, UK, and North America | Medium term (2-4 years) |
| Source: Mordor Intelligence | |||
High Cost and Complexity of Full-Scale Compliance Testing
Full-scale compliance work remains the clearest operational brake on the fire testing market because both providers and customers face high capital and preparation costs. ANSI/CAN/UL 9540A 6th Edition, published in March 2026, introduced mandatory large-scale deflagration testing under Annex C for battery energy storage scenarios where enclosure design and gas composition create explosion risk. SGS noted in May 2026 that the new Edition also makes early-stage CFD work a practical prerequisite for some programs, which adds planning time before a physical test can even be booked.[3]SGS, “Navigating the Shift Key Technical Updates in UL 9540A 6th Edition,” SGS, sgs.com The cost burden is even heavier where manufacturers need large furnaces, advanced instrumentation, multiple mockups, and repeated setup verification. Certification queues in several major markets already stretch into multi-year windows, which means delay costs can become nearly as damaging as the direct testing bill. That pressure tends to favor large incumbents with stronger balance sheets and longer product planning horizons, while smaller challengers face a higher risk of commercialization delays.
Lack of Cross-Laboratory Standard Harmonization
Lack of harmonization across laboratories and jurisdictions continues to slow the fire testing market because one accepted result often does not travel cleanly into another region. European Accreditation has worked to align how EN ISO/IEC 17025 is applied to fire classification and extended application work, yet the need for that effort shows how fragmented interpretation has remained.[4]European Accreditation, “EN ISO/IEC 17025 for Fire Testing Laboratories,” European Accreditation, european-accreditation.org North American UL standards, European EN methods, and Chinese GB approaches often use different specimen preparation rules, temperature curves, geometries, and pass-fail logic. This problem is especially acute in cables and wires, where manufacturers may need separate approvals under IEC, UL, and national Chinese standards to serve infrastructure customers in several regions. The same issue affects facade systems, where large-scale test methods and classification rules differ enough that duplicate programs remain common. As a result, manufacturers seeking global access often face several independent test programs instead of one transferable evidence package, which raises both cost and time to market.
*Our forecasts treat driver/restraint impacts as directional, not additive. The impact forecasts reflect baseline growth, mix effects, and variable interactions.
Segment Analysis
By Service Type: Fire Resistance Testing Anchors Revenue, Smoke and Toxicity Gains Urgency
Fire resistance testing held a 37.32% share of the fire testing market by service type in 2025, which confirms its role as the baseline requirement for many building products and passive protection systems. Fire resistance work remains central because walls, floors, doors, partitions, columns, and other structural elements often cannot move into regulated projects without recognized furnace-based validation. ISO 834-1:2025 reinforced that central role by updating the global testing procedure for elements of building construction in May 2025. Flammability testing remained the second-largest service area because textiles, polymers, cables, and construction materials still need reaction screening across consumer and industrial uses. Fire detection system testing is also seeing stronger demand from data centers, where dense equipment layouts require proof that detection and suppression systems perform as intended under specific thermal and spatial conditions.
Smoke and toxicity testing is forecast to grow at a 7.27% CAGR from 2026 to 2031, which makes it the fastest-expanding service line in the fire testing market. The UK Building Safety Regulator published a major review in September 2025 that highlighted the gap between current regulatory practice and the combustion gas hazards created by synthetic polymers used in modern buildings. That issue is even more visible in rail and transit, where operators have long treated smoke toxicity as a practical safety issue even when national building rules were less explicit. The result is a growing two-test pattern for newer materials, because clients increasingly need both structural fire resistance evidence and combustion gas assessment before approving a product. Specialized capacity for smoke and toxicity work is not scaling at the same pace, which gives this sub-segment a stronger strategic position within the fire testing market over the next several years.


By Testing Method: Full-Scale Furnace Testing Holds Share, Simulation Sets the Pace
Full-scale furnace testing retained a 40.51% share of the testing method segment in 2025, which shows that physical validation remains the core method in the fire testing market. Most major building codes and certification pathways still require direct furnace evidence for assemblies and components that are used in occupied structures. That requirement creates a high barrier to entry because accredited large furnaces need large capital budgets, specialized staff, and multiple orientations for different product categories. Warringtonfire’s Birchwood Park laboratory opened in January 2025 as a USD 30 million facility with major planned furnace capacity, and the site was designed to raise European fire resistance throughput by 80% versus its prior Holmesfield Road operation. Small-scale and bench testing remain important because cone calorimeter, Bunsen burner, and related methods help manufacturers screen materials before moving into more expensive full-scale programs.
Computer simulation and modeling are forecast to record the fastest CAGR at 7.41% from 2026 to 2031 within the testing method segment. Southwest Research Institute has shown how CFD fire modeling can reduce costly test iterations by identifying hazard patterns before full physical validation begins. That role is becoming more formal inside certification workflows because the 6th Edition of UL 9540A makes early-stage modeling a practical part of large-scale deflagration risk preparation for some battery energy storage programs. Reaction-to-fire testing remains the smallest method category by revenue, yet it is gaining traction in cable and furniture applications as voluntary classification is used more often as a market entry signal. Within the fire testing industry, the method mix is shifting from physical-only validation toward hybrid programs that use simulation to improve scheduling, design choices, and first-time pass rates.
By End-Use Industry: Building and Construction Commands Share, Transportation Climbs Fastest
Building and construction represented a 39.88% share of the fire testing market by end-use industry in 2025, which keeps it firmly ahead of other demand centers. This leadership reflects the fact that building codes embed fire testing into a very broad range of residential, commercial, and public infrastructure projects. Demand is also changing in quality because retrofit programs are now generating large testing volumes in markets where older assets no longer meet current safety expectations. The revised EU Construction Products Regulation framework continues to support recurring EN-compliant testing as manufacturers maintain or update product qualification for CE-related pathways. Electrical and electronics, industrial manufacturing, and oil and gas remain solid mid-tier users, with demand linked more to certification cycles and facility safety reviews than to project-by-project construction waves.
Transportation is forecast to be the fastest-growing end-use industry at a 7.11% CAGR from 2026 to 2031, which makes it the clearest expansion pocket in the fire testing market. Battery electric vehicle validation is a major part of that shift, as regulators and manufacturers move toward tougher thermal propagation and pack-level safety proof. The UN Working Party on Passive Safety has advanced amendments to Global Technical Regulation No. 20 that add new protocol details for electric vehicle safety testing. DEKRA’s Battery Test Center, which entered operation in 2025, highlights how providers are investing in dedicated capacity for this workload. Rail demand is also rising after ISO 9828-1:2025, while aviation retains a smaller but high-value niche through ISO 19281:2025 and its focus on fire-resistant cargo containers.
By Material/Sample Type: Structural Components Lead, Fire-Protective Coatings Gain Strategic Relevance
Structural components represented a 30.23% share of material and sample type in the global fire testing market. Their leading position reflects the mandatory need to classify walls, floors, columns, beams, and composite assemblies under major regulatory frameworks. The updated ISO 834 series, including ISO 834-7:2025 for columns, shows that structural fire testing remains active as construction methods and material combinations continue to change. Fire-protective coatings are becoming more strategically important because intumescent and reactive systems are now being specified across buildings, offshore assets, rolling stock, and battery enclosures. Warringtonfire’s repositioning of Holmesfield Road as a center for smaller-scale reaction-to-fire activity also supports more specialized throughput for coatings and related products.
Polymers and plastics represent the highest growth opportunity with 6.71% CAGR within this material mix because they are spreading across construction, electric mobility, and consumer electronics, where combustion behavior must be characterized carefully. Cables and wires remain one of the most complex compliance areas because they often need parallel alignment with IEC, EN, UL, and national requirements. The EU CPR framework keeps cable testing active through EN 13501-6 classification requirements for products used in construction works. Fabrics and textiles continue to generate routine demand in aircraft, rail, marine, and furniture applications, where fire performance remains a recurring approval requirement. Within the fire testing industry, this material mix shows that growth is spreading from traditional structural assemblies into engineered materials whose smoke, heat release, and surface spread behavior can no longer be treated as secondary issues.
Geography Analysis
North America held 32.95% of the global fire testing market in 2025, which made it the largest regional contributor. The United States supports that position through a dense framework of NFPA codes, UL standards, and the International Building Code that creates recurring test obligations across buildings, industry, and transport. Canada adds steady demand through CSA-linked standards and certification pathways, while Mexico is benefiting from manufacturing expansion tied to nearshoring and related compliance needs. DEKRA Certification Inc. received OSHA recognition for 32 additional test standards effective December 31, 2025, which shows how aggressively accredited bodies are competing to widen recognized scope in the region. North America is also at the forefront of battery energy storage testing demand after NFPA 855 moved large-scale fire testing into the installation code pathway for 2026.
Europe remained one of the most developed laboratory clusters within the fire testing market, even though a regional share was not disclosed in the input. Germany, the United Kingdom, and France form the core national markets because CE-related product pathways and EN-based methods create a dense testing environment. The Grenfell Tower Inquiry Phase 2 report accelerated external wall and facade system testing demand in the United Kingdom, and that effect has flowed into both BS 8414 and EN-linked activity. Europe also benefits from a relatively high concentration of accredited laboratories, which helps it serve both domestic compliance and cross-border product qualification. South America is still a smaller regional base, but Brazil stands out as the main growth anchor after Intertek entered the market through its May 2025 acquisition of TESIS in São Paulo.
Asia-Pacific is forecast to be the fastest-growing region in the fire testing market at a 7.35% CAGR from 2026 to 2031. China, India, Japan, South Korea, and Southeast Asian economies are all tightening building rules while also expanding manufacturing-linked certification demand, which supports growth across service types. Australia faces a near-term capacity constraint as the CSIRO North Ryde consolidation progresses, and Jensen Hughes is well placed to capture redirected demand after rebranding the former Warringtonfire Australia business in late 2024. The Middle East and Africa region remains tied to GCC construction programs, where Saudi Arabia’s Vision 2030 projects and UAE smart-city developments continue to require compliance under international and Gulf-referenced standards.

Competitive Landscape
The fire testing market shows moderate consolidation at the top end, where a limited group of large TIC providers competes for the most complex accredited programs. Intertek Group plc, SGS SA, Bureau Veritas, UL LLC, Element Materials Technology, TÜV SÜD, and TÜV Rheinland form the most visible upper tier across multi-standard testing. Their advantage comes less from simple laboratory count and more from accreditation breadth, geographic coverage, and the ability to bundle testing with certification and broader TIC services. Element Materials Technology illustrates this model clearly by running Warringtonfire as a specialist fire brand while using a wider TIC platform to serve construction and infrastructure clients. ISO/IEC 17025 compliance remains the basic competitive requirement, yet scale matters because clients increasingly prefer providers that can handle several jurisdictions and service lines through a single relationship.
Strategic expansion has remained active across the fire testing market. SGS closed its USD 460 million acquisition of Applied Technical Services in January 2026, which strengthened its North American testing footprint and added technical depth in specialized services. Intertek expanded into Brazil’s building products testing space through its USD 120 million TESIS acquisition in May 2025, which gave it a direct foothold in South America’s largest construction market. Warringtonfire’s Birchwood Park investment and TÜV SÜD America’s April 2026 application for broader OSHA NRTL recognition show that both physical capacity and certification scope remain central competitive levers.
White space still exists in three areas: integrated performance-based modeling tied directly to physical test scheduling, advanced battery chemistries beyond traditional lithium-ion, and underserved accredited capacity in parts of Southeast Asia and Sub-Saharan Africa. Those gaps matter because clients increasingly want faster program design, fewer failed iterations, and one provider that can combine digital analysis with booked furnace or propagation testing. Southwest Research Institute occupies a distinct position in this landscape because its nonprofit structure and strong CFD fire modeling capability make it a credible alternative for defense, government, and technically complex hazardous-material programs. Even with consolidation at the top, the fire testing market still includes a long tail of regional laboratories and specialists, which keeps competition active below the leading tier.
Fire Testing Industry Leaders
Intertek Group plc
SGS SA
UL LLC
Applus+ Laboratories
Bureau Veritas
- *Disclaimer: Major Players sorted in no particular order

Recent Industry Developments
- May 2026: SGS published detailed technical guidance on UL 9540A 6th Edition key updates for BESS, including the transition of Annex C, large-scale deflagration testing, from informative to mandatory status and the new passive-first requirement for outdoor ground-mounted systems, establishing SGS's advisory position ahead of demand concentration from the 2026 NFPA 855 compliance cycle.
- April 2026: TÜV SÜD America, Inc. submitted an application to OSHA for expansion of its NRTL recognition, targeting broader product safety certification scope in the North American market to compete more directly with UL LLC and DEKRA in multi-standard US certification programs.
- March 2026: UL Standards and Solutions published the 6th Edition of ANSI/CAN/UL 9540A, superseding Edition 5, March 2025, with a mandatory large-scale fire test for non-residential BESS under Section 10 and mandatory Annex C large-scale deflagration testing, aligning with the 2026 edition of NFPA 855 for installation-level safety validation.
- January 2026: SGS closed its acquisition of Applied Technical Services, ATS, a North American specialized testing, inspection, calibration, and forensics firm with approximately 2,100 employees and projected USD 460 million in 2026 revenues, delivering approximately 80% of SGS's stated goal to more than double its North American sales by 2027.


Global Fire Testing Market Report Scope
The Fire Testing Market is Segmented by Service Type (Fire Resistance Testing, Flammability Testing, Smoke and Toxicity Testing, Fire Detection System Testing, and Other Service Types), Testing Method (Full-Scale Furnace Testing, Small-Scale and Bench Testing, Computer Simulation and Modelling, and Reaction-to-Fire Testing), End-Use Industry (Building and Construction, Transportation (Automotive, Aerospace, Rail, and Marine), Electrical and Electronics, Industrial Manufacturing, Consumer Goods and Furniture, Oil and Gas and Mining, Other End-Use Industries), Material / Sample Type (Structural Components, Fire-Protective Coatings, Cables and Wires, Fabrics and Textiles, Polymers and Plastics, and Other Materials / Sample Types), and Geography (North America, South America, Europe, Asia-Pacific, MEA). The Market Forecasts are Provided in Terms of Value (USD).
| Fire Resistance Testing |
| Flammability Testing |
| Smoke and Toxicity Testing |
| Fire Detection System Testing |
| Other Service Types |
| Full-Scale Furnace Testing |
| Small-Scale and Bench Testing |
| Computer Simulation and Modelling |
| Reaction-to-Fire Testing |
| Building and Construction | |
| Transportation | Automotive |
| Aerospace | |
| Rail | |
| Marine | |
| Electrical and Electronics | |
| Industrial Manufacturing | |
| Consumer Goods and Furniture | |
| Oil and Gas and Mining | |
| Other End-Use Industries |
| Structural Components |
| Fire-Protective Coatings |
| Cables and Wires |
| Fabrics and Textiles |
| Polymers and Plastics |
| Other Materials / Sample Types |
| North America | United States | |
| Canada | ||
| Mexico | ||
| South America | Brazil | |
| Argentina | ||
| Rest of South America | ||
| Europe | Germany | |
| United Kingdom | ||
| France | ||
| Italy | ||
| Spain | ||
| Rest of Europe | ||
| Asia-Pacific | China | |
| Japan | ||
| India | ||
| South Korea | ||
| ASEAN | ||
| Rest of Asia-Pacific | ||
| Middle East and Africa | Middle East | Saudi Arabia |
| United Arab Emirates | ||
| Turkey | ||
| Rest of the Middle East | ||
| Africa | South Africa | |
| Nigeria | ||
| Rest of Africa | ||
| By Service Type | Fire Resistance Testing | ||
| Flammability Testing | |||
| Smoke and Toxicity Testing | |||
| Fire Detection System Testing | |||
| Other Service Types | |||
| By Testing Method | Full-Scale Furnace Testing | ||
| Small-Scale and Bench Testing | |||
| Computer Simulation and Modelling | |||
| Reaction-to-Fire Testing | |||
| By End-Use Industry | Building and Construction | ||
| Transportation | Automotive | ||
| Aerospace | |||
| Rail | |||
| Marine | |||
| Electrical and Electronics | |||
| Industrial Manufacturing | |||
| Consumer Goods and Furniture | |||
| Oil and Gas and Mining | |||
| Other End-Use Industries | |||
| By Material / Sample Type | Structural Components | ||
| Fire-Protective Coatings | |||
| Cables and Wires | |||
| Fabrics and Textiles | |||
| Polymers and Plastics | |||
| Other Materials / Sample Types | |||
| By Geography | North America | United States | |
| Canada | |||
| Mexico | |||
| South America | Brazil | ||
| Argentina | |||
| Rest of South America | |||
| Europe | Germany | ||
| United Kingdom | |||
| France | |||
| Italy | |||
| Spain | |||
| Rest of Europe | |||
| Asia-Pacific | China | ||
| Japan | |||
| India | |||
| South Korea | |||
| ASEAN | |||
| Rest of Asia-Pacific | |||
| Middle East and Africa | Middle East | Saudi Arabia | |
| United Arab Emirates | |||
| Turkey | |||
| Rest of the Middle East | |||
| Africa | South Africa | ||
| Nigeria | |||
| Rest of Africa | |||


Key Questions Answered in the Report
What is the current and forecast value of the global fire testing sector?
The fire testing market size stands at USD 7.71 billion in 2026 and is forecast to reach USD 10.58 billion by 2031, growing at a 6.53% CAGR over 2026-2031.
Which region leads global demand for fire testing services?
North America led in 2025 with a 32.95% share, supported by extensive code frameworks across the United States and steady demand from Canada and Mexico.
Which testing method generates the most revenue today?
Full-scale furnace testing led the testing method segment with a 40.51% share in 2025 because most building and product certification pathways still require physical validation.
Why is simulation becoming more important in fire validation work?
Computer simulation and modelling is forecast to grow at 7.41% CAGR through 2031 because it helps reduce failed iterations, improves program design, and is becoming more embedded in battery-related testing workflows.
Which end-use area is expanding the fastest?
Transportation is forecast to grow at 7.11% CAGR through 2031 as electric vehicles, rail systems, aviation cargo, and marine applications create new fire validation needs.
What is the main operational bottleneck for laboratories and clients?
The biggest constraint is limited accredited full-scale capacity, especially for furnace and battery propagation work, which raises costs and extends certification queues in major markets.
Page last updated on:


