North America Fire Sprinkler Systems Market Size and Share
Market Overview
| Study Period | 2023 - 2031 |
|---|---|
| Forecast Data Period | 2026 - 2031 |
| Historical Data Period | 2023 - 2024 |
| Market Size (2026) | USD 2.81 Billion |
| Market Size (2031) | USD 3.07 Billion |
| Growth Rate (2026 - 2031) | 1.79% CAGR |
| Market Concentration | Medium |
Major Players *Disclaimer: Major Players sorted in no particular order Image © Mordor Intelligence. Reuse requires attribution under CC BY 4.0. | |

North America Fire Sprinkler Systems Market Analysis by Mordor Intelligence
The North America fire sprinkler systems market size is estimated at USD 2.81 billion in 2026, and is expected to reach USD 3.07 billion by 2031, at a CAGR of 1.79% during the forecast period (2026-2031). This trajectory reflects a mature installed base where replacement cycles, retrofit mandates, and modest greenfield activity together dictate demand. The enforcement of the 2025 edition of NFPA 13, new annexes on seismic bracing, and the 2024 update of the International Building Code are forcing legacy properties to upgrade or risk non-compliance, while insurer-led premium discounts are strengthening the return-on-investment argument for both commercial landlords and residential developers. Pockets of faster growth are appearing in data-center pre-action installations, single-family residential construction in wildfire-prone states, and nearshoring-driven industrial projects in Mexico. In parallel, national wholesalers are stabilizing supply chains by bundling pipe, heads, and valves into turnkey kits, which helps contractors navigate a patchwork of local codes and short-cycle project schedules. Strategic divestitures by Carrier and Johnson Controls are also reshaping supplier dynamics, funneling investment into IoT-enabled monitoring platforms that bundle sprinklers, detection, and access control under a single pane of glass.
Key Report Takeaways
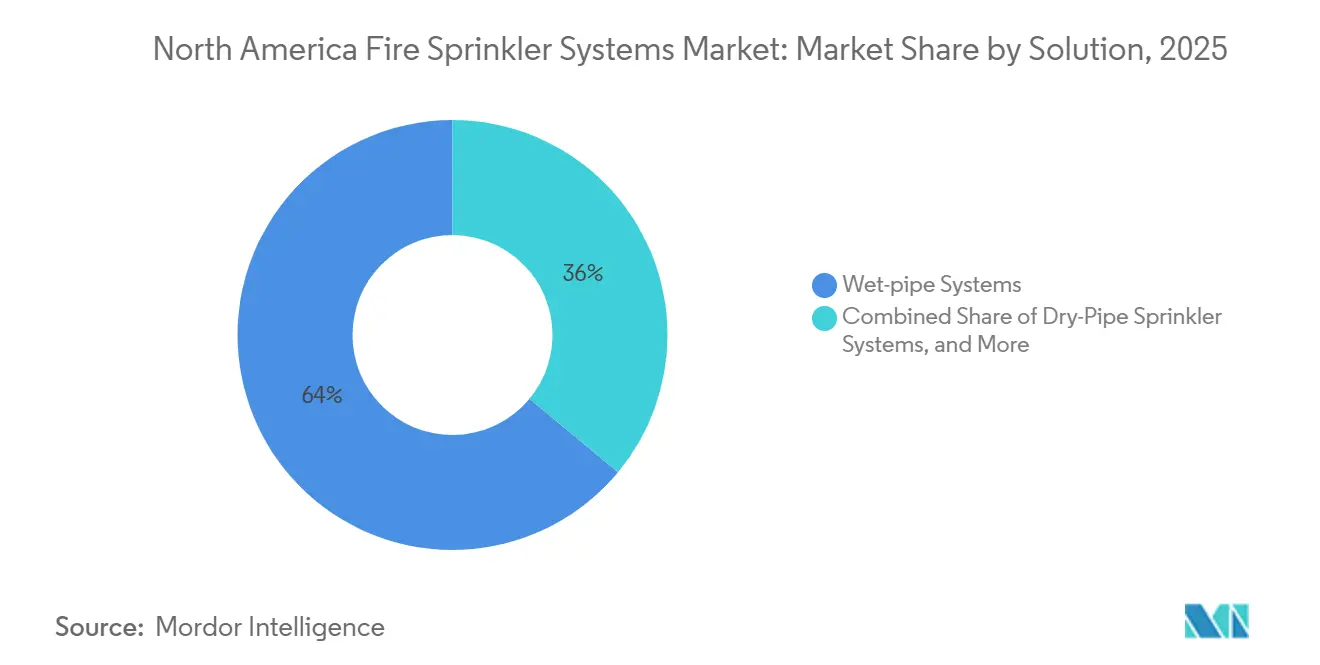
- By solution, wet-pipe systems led with 63.98% of 2025 revenue, while pre-action systems are projected to grow at a 3.57% CAGR through 2031.
- By component, sprinkler heads held 31.42% of 2025 revenue, while sensors and detectors are forecast to expand at a 2.31% CAGR through 2031.
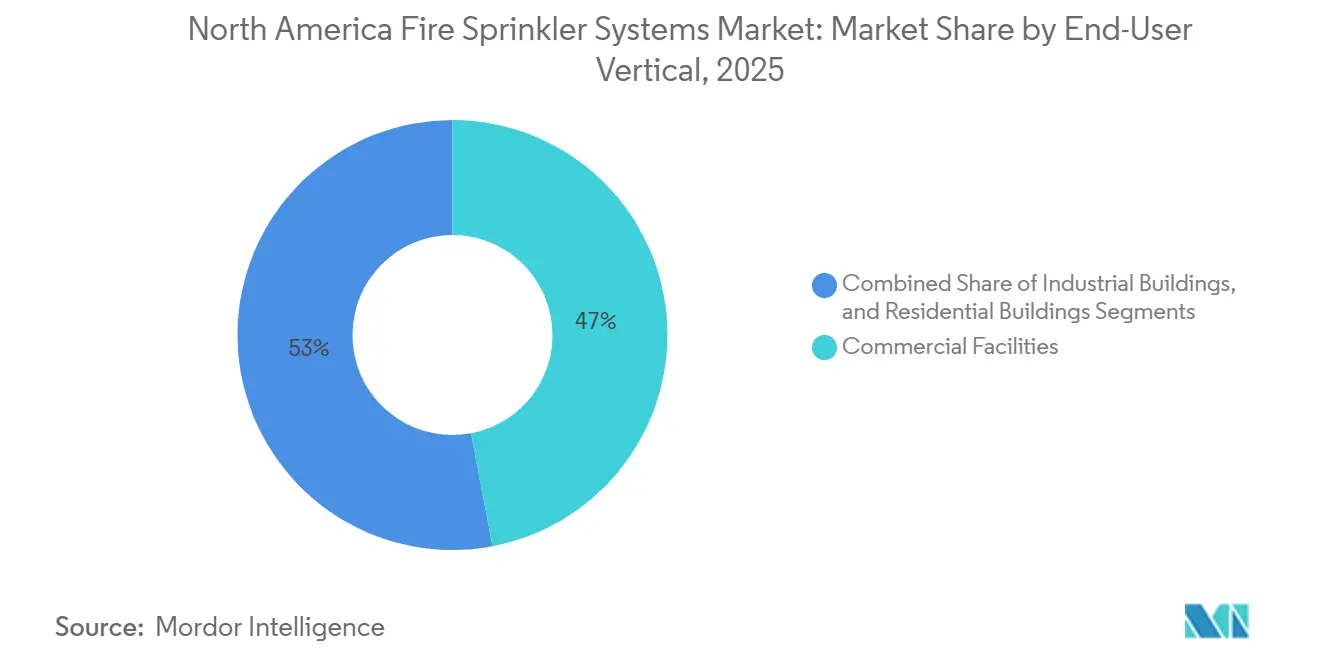
- By end-user, commercial buildings accounted for 47.02% of demand in 2025, whereas residential installations are expanding at a 3.01% CAGR to 2031.
- By distribution channel, distributor sales captured 44.06% of 2025 revenue, and the same channel is forecast to rise at a 2.89% CAGR through 2031.
- By geography, the United States controlled 79.03% of regional revenue in 2025, while Mexico is on track for a 2.91% CAGR through 2031.
Note: Market size and forecast figures in this report are generated using Mordor Intelligence’s proprietary estimation framework, updated with the latest available data and insights as of January 2026.
North America Fire Sprinkler Systems Market Trends and Insights
Drivers Impact Analysis*
| Driver | (~) % Impact on CAGR Forecast | Geographic Relevance | Impact Timeline |
|---|---|---|---|
| Stringent Government Regulations and Mandates | +0.4% | United States, Canada, Mexico growing adoption | Long term (≥ 4 years) |
| Rising Commercial Construction Spending | +0.3% | United States, Mexico, selected Canadian logistics hubs | Medium term (2-4 years) |
| Insurance Premium Incentives for Installation | +0.2% | United States, Canada, early adoption in Mexico | Short term (≤ 2 years) |
| Implementation of NFPA 915 Remote Inspections | +0.2% | United States, Canada, pilots in Mexico City | Medium term (2-4 years) |
| AI-Based Predictive Maintenance Integration | +0.2% | United States hyperscale data centers, gradual uptake in Canada | Long term (≥ 4 years) |
| Corporate ESG Reporting Pressures | +0.1% | United States, Canada, multinational campuses in Mexico | Long term (≥ 4 years) |
| Source: Mordor Intelligence | |||
Stringent Government Regulations And Mandates
The 2025 text of NFPA 13 tightened head spacing for quick-response and residential sprinklers, added seismic-bracing rules, and widened requirements for atriums and covered malls, causing owners to trigger retrofits each time a certificate of occupancy is renewed. Maryland’s single-family mandate inspired California to extend sprinklers to all new houses in wildfire zones, while Ontario’s 2025 Building Code now obliges retrofits in pre-1974 towers. Because each state or province layers amendments on the base standard, national integrators with multi-state engineering teams gain an execution edge. At the same time, NFPA 25 keeps retrofits lucrative by specifying quarterly valve checks, annual flow tests, and five-year internal inspections, effectively locking in decades of recurring service revenue. The International Code Council aligned its 2024 code with NFPA 13, shrinking the exemption for Group B occupancies and adding thousands of small offices and shops to the regulated universe.
Rising Commercial Construction Spending
United States non-residential construction reached USD 1.02 trillion in August 2025, a 4.2% year-over-year rise that dovetails directly with sprinkler installations in new hotels, hospitals, and offices.[1]U.S. Census Bureau, “Monthly Construction Spending, August 2025,” census.gov Nearshoring added 106 industrial parks to Mexico’s 469 existing facilities, each required to meet FM Global specifications that favor deluge or pre-action systems in electronics assembly lines. Canadian warehouse projects around Toronto and Vancouver are embracing early-suppression fast-response (ESFR) heads to protect high-piled inventory, lifting per-project spend even as square footage remains. Mass-timber codes are expanding, but because wood is combustible, engineers specify closer head spacing, which increases the material count per building. Collectively, these factors convert macro-level construction dollars into unit sales of valves, pipe, and heads.
Insurance Premium Incentives For Sprinkler Installation
State Farm and USAA offer 5-15% discounts on properties equipped with NFPA 13-compliant systems, making payback periods clear to owners who value lower operating costs. The Home Fire Sprinkler Coalition reports a 96% reduction in fire-death rates and an installation cost of USD 1.61 per square foot, data points that actuaries used to underwrite broader incentives.[2]Home Fire Sprinkler Coalition, “Installing Home Fire Sprinklers,” homefiresprinkler.org California’s Wildfire Safety Advisory Board now links credits to sprinklers in high-risk ZIP codes, effectively turning sprinkler adoption into a requirement for affordable coverage. On the commercial side, FM Global and Zurich have tied premiums to quarterly NFPA 25 inspection compliance, creating predictable work for service contractors. As insurance pricing becomes granular, sprinkler installation migrates from compliance expense to financial strategy.
Implementation Of NFPA 915 Remote Inspections Accelerating Renovations
Published in 2024, NFPA 915 allows certified inspectors to accept live video feeds for quarterly valve checks and annual testing, reducing travel time and enabling same-day compliance for multi-site portfolios.[3]National Fire Sprinkler Association, “U.S. Retrofit Market Analysis,” nfsa.org A national retailer with 800 stores can now centralize oversight and trim inspection costs by double-digit percentages. Early pilots in New York and Los Angeles cut inspection-related downtime by 22%, a result that is prompting owners to add IoT valves and pressure sensors that broadcast real-time data to cloud dashboards. Shorter project punch-lists mean fewer schedule delays, and contractors can close out permits faster in jurisdictions that have adopted the standard. As adoption spreads, remote inspections are likely to become embedded in renovation budgets, supporting volume growth for smart valves, cameras, and data plans.
Restraints Impact Analysis*
| Restraint | (~) % Impact on CAGR Forecast | Geographic Relevance | Impact Timeline |
|---|---|---|---|
| High Cost of Retrofitting Existing Buildings | -0.3% | United States aging stock, Canadian high-rise towers | Medium term (2-4 years) |
| Supply-Chain Volatility For Piping Materials | -0.2% | Cross-border projects in the region | Short term (≤ 2 years) |
| Skilled Labor Shortages In Sprinkler Fitters | -0.2% | United States, Canada, limited Mexican training | Long term (≥ 4 years) |
| Liability Concerns Over False Activations | -0.1% | United States offices, Canadian data centers | Medium term (2-4 years) |
| Source: Mordor Intelligence | |||
High Cost Of Retrofitting Existing Buildings
Upgrading a pre-1980 office tower can cost USD 3-7 per square foot, a figure that competes with HVAC and elevator modernization for landlords’ limited capital budgets. Structural barriers, from missing vertical chases to asbestos abatement, can increase totals by 20-30%. Because tenant disruption is significant, owners must negotiate rent abatements or schedule night shifts, both of which erode project returns. Financing assistance is scarce, as most green-building incentives ignore fire-safety upgrades. Consequently, only a fraction of the retrofit opportunity moves forward each year, capping the incremental unit demand that could otherwise accelerate the North America fire sprinkler systems market.
Supply-Chain Volatility For Piping Materials
Steel-pipe indices peaked at 185.3 in mid-2022 before slipping to 162.1 in September 2025, yet monthly swings of 3-5% persist, complicating lump-sum bids. Copper prices bounced between USD 4.20 and USD 4.80 per pound in 2025, driven by Chilean mine disruptions and shifting Chinese demand. Viking Corporation passed a 6% price hike through the channel in April 2025, underscoring supplier pricing power. Cross-border projects in Mexico face tariff hurdles and limited domestic mill capacity, which push lead times to three months and force contractors to carry more working capital. Until material volatility stabilizes, contractors will continue adding escalators to bids, delaying some discretionary starts and tempering the overall CAGR for the North America fire sprinkler systems market.
*Our forecasts treat driver/restraint impacts as directional, not additive. The impact forecasts reflect baseline growth, mix effects, and variable interactions.
Segment Analysis
By Solution: Wet-Pipe Dominance With Rising Pre-Action Preference
Wet-pipe systems accounted for 63.98% of 2025 revenue, securing the largest market share among all system configurations in the North America fire sprinkler systems market. Pre-action setups, favored in mission-critical environments such as hyperscale data centers and semiconductor fabs, are forecast to advance at a 3.57% CAGR through 2031, making them the fastest-growing solution subset. Dry-pipe networks remain common in unheated warehouses across the northern United States and Canada, but slower activation and compressor upkeep limit their expansion. Deluge systems fill high-hazard niches such as aircraft hangars and petrochemical racks, where blanket water deployment is mandated.
End users increasingly select technology by risk profile, which reinforces the practical segmentation of the North America fire sprinkler systems market. Codes now stipulate dual-interlock pre-action valves for spaces housing energized equipment, aligning capex priorities with uptime mandates. Manufacturers are responding by bundling quick-response heads, electronic release panels, and low-pressure switches as integrated kits, simplifying the design process for consulting engineers. As a result, the fire sprinkler systems market size for pre-action solutions is expected to widen by 2031, even though absolute dollars remain materially lower than wet-pipe revenue.


By Component: Sensors And Detectors Outpace Commoditized Pipe And Heads
Sprinkler heads represented 31.42% of component revenue in 2025, fueled by the steady replacement of legacy fusible-link designs with quick-response models that activate at lower temperatures. Sensors and detectors, however, are growing at a 2.31% CAGR, outstripping the broader North America fire sprinkler systems market growth thanks to IoT gateway adoption that pushes real-time data to building-management dashboards. Pipes, valves, and fittings continue to dominate on a cost-basis, but innovation is minimal and pricing remains sensitive to raw-material indices.
Victaulic grooved couplings, which remove field welding, are lowering labor hours by up to 40% and are becoming standard in large commercial projects. RFID-tagged control valves now simplify NFPA 25 inspections by auto-populating serial numbers in digital checklists, a trend that folds predictive maintenance into the fire sprinkler systems industry roadmap. As smart components migrate downstream, the North America fire sprinkler systems market size for connected sensors will keep expanding, with aftermarket retrofits offering a secondary revenue stream when owners integrate legacy systems into cloud monitoring platforms.
By End-User Vertical: Residential Growth Outstrips Commercial Base
Commercial facilities commanded 47.02% of 2025 demand, yet growth tracks overall construction spending rather than discretionary retrofits, keeping the segment close to the headline CAGR. Residential installations, though smaller in absolute terms, are set to grow 3.01% annually through 2031 as Maryland, California, and several wildfire-prone western states embed sprinklers into state building codes. The combination of insurer discounts and verified safety records is shrinking buyer hesitation, especially in new single-family construction where installation costs average USD 1.61 per square foot.
Industrial demand is concentrated in Mexico’s nearshoring corridor, where multinational tenants require FM Global-approved pre-action or deluge systems to protect high-value electronics lines. Automated warehouses are adopting early-suppression fast-response heads to safeguard robotic picking equipment, which drives custom engineering fees that exceed traditional line-item material costs. The shifting risk matrix keeps residential momentum strong, but it also positions industrial retrofits as a lucrative niche within the broader North America fire sprinkler systems market.
By Distribution Channel: Distributors Hold Their Ground Amid Direct-Sale Expansion
Distributors captured 44.06% of revenue in 2025, retaining the largest fire sprinkler systems market share at the channel level. Same-day delivery and the packaging of project-specific kits make regional wholesalers indispensable to contractors working under compressed schedules. Direct sales account for about 35% of turnover as design-build giants negotiate volume rebates straight from Johnson Controls, Tyco, and Reliable. Online marketplaces remain a nascent channel, constrained by licensing rules that require certified fitters to install equipment.
Ferguson Enterprises and HD Supply leverage national footprints to offer price stability when steel or copper indices spike, demonstrating that value-added logistics trump pure e-commerce in this sector. As integrators shift toward bundled HVAC, access, and fire-safety contracts, OEM packaged deals are expected to creep above 15% of the North America fire sprinkler systems market size by 2031. Even so, distributors’ ability to stage pipe, heads, and valves within one truck roll ensures that the channel’s CAGR, though moderate, remains positive at 2.89%.
Geography Analysis
The United States generated 79.03% of regional revenue in 2025. Updated codes have tightened head-count thresholds for Group B occupancies, effectively sweeping thousands of small offices into the regulated pool. Non-residential construction tallied USD 1.02 trillion in August 2025, which sustains baseline demand, while residential mandates in wildfire zones add incremental volume. Maturity limits upside, but replacement cycles and NFPA 25 service contracts maintain a consistent revenue floor for the North America fire sprinkler systems market.
Canada represented roughly 15% of North American revenue in 2025. Ontario’s 2025 retrofitting requirement for towers built before 1974 introduced a multi-year upgrade pipeline, although owner funding gaps and tenant logistics slow execution. October 2024 construction investment grew 0.3% month-over-month, powered by logistics warehouses in Toronto and Vancouver that specify ESFR protection. Emerging mass-timber projects push up headcounts per floor, keeping per-building spend elevated even as national square footage plateaus.
Mexico is the growth standout, advancing at a 2.91% CAGR through 2031 on the back of nearshoring, which is adding 106 new industrial parks to 469 existing sites. FM Global standards drive pre-action and deluge adoption, but contractors wrestle with eight-to-twelve-week pipe lead times because of domestic mill shortages. October 2025 construction data showed a 3.8% monthly uptick despite lumpy year-over-year swings, indicating that capital spending remains sensitive to foreign direct investment flows. Affordable-housing initiatives specify NFPA 13D systems in mid-rise multifamily projects, yet enforcement outside major metros remains inconsistent, limiting near-term penetration. Overall, asymmetric regulatory timelines create growth pockets that lift aggregate demand above what headline GDP figures would imply, reinforcing Mexico’s role as the North America fire sprinkler systems market demand engine within the region.
Competitive Landscape
North America’s supplier landscape is moderately concentrated: the top five vendors, Johnson Controls, Carrier (pre-divestiture), Viking Corporation, Tyco Fire Products, and Reliable Automatic Sprinkler, control roughly 40-45% of shipments. Carrier’s USD 1.425 billion divestiture of its Industrial Fire business and Johnson Controls’ USD 8.1 billion sale of its Residential and Light Commercial HVAC unit both closed in 2024, directing capital toward connected-building platforms where sprinklers, detection, and access share a single data layer. The carve-outs opened space for mid-market manufacturers and private-equity roll-ups to capture orphaned floor space in distributors’ warehouses.
Technology integration is now a primary differentiator. Johnson Controls’ OpenBlue aggregates valve position, temperature, and flow alerts into its building-management suite, while Siemens’ Smart Fire Sprinkler Service, launched in March 2025, benchmarks alarm frequency against peer buildings to flag outliers. Viking’s April 2025 6% list-price increase confirmed that raw-material pass-through remains viable for market leaders, even in a cost-sensitive environment. UL 1626 and FM approvals continue to limit disruption, yet prefabricated spool fabrication is lowering the engineering barrier for smaller contractors.
Recurring revenue from NFPA 25 inspections is attracting private capital. Service-focused acquirers are stitching together regional contractors to build national footprints that lock in quarterly and annual testing fees, which often carry 200-300 basis-point margin premiums over hardware. As IoT penetrates valves and heads, software-as-a-service pricing is emerging, enabling suppliers to monetize data analytics on top of traditional equipment. Competitive intensity will stay moderate, but digital services could raise the industry’s effective switching costs, nudging concentration modestly higher by 2031.
North America Fire Sprinkler Systems Industry Leaders
Fireline Corporation
Reliable Automatic Sprinkler Co. Inc
Control Fire Inc.
Vanguard Fire & Security systems
Johnson Controls International PLC (Tyco)
- *Disclaimer: Major Players sorted in no particular order


Recent Industry Developments
- May 2025: Siemens launched its Smart Fire Sprinkler Service, integrating IoT-enabled control valves with cloud analytics that benchmark each building’s alarm profile against peer cohorts.
- April 2025: Viking Corporation imposed a 6% price increase across sprinkler heads, valves, and pipe fittings, citing persistent raw-material inflation.
- July 2024: Carrier completed the USD 1.425 billion sale of its Industrial Fire unit to Apollo Global Management, pivoting toward HVAC and building-automation software.
- July 2024: Johnson Controls closed the USD 8.1 billion divestiture of its Residential and Light Commercial HVAC division to Bosch to fund OpenBlue development.


North America Fire Sprinkler Systems Market Report Scope
Fire sprinkler systems are widely used in many applications for the purpose of safety and precaution. The study covers the demand dynamics of fire sprinklers, which form an active component of a domestic or commercial building's fire protection system. These systems are installed in ceilings or sidewalls and consist of a water supply, a water distribution piping system, and sprinkler heads. The study is focused on analyzing the market adoption across the United States and Canada, with an end-user focus on residential, commercial, industrial, and institutional verticals.
The North America Fire Sprinkler Systems Market Report is Segmented by Solution (Systems including Wet-Pipe, Dry-Pipe, Pre-Action, and Deluge Sprinkler Systems, and Services), Component (Sprinkler Heads, Pipes and Fittings, Control Valves, Alarm Valves, Sensors and Detectors, and Accessories), End-User Vertical (Commercial, Industrial, and Residential Buildings), Distribution Channel (Direct Sales, Distributor Sales, Online/Third-Party, and OEM Packaged Deals), and Geography (United States, Canada, and Mexico). Market Forecasts are Provided in Terms of Value (USD).
| Systems | Wet-Pipe Sprinkler System |
| Dry-Pipe Sprinkler System | |
| Pre-Action Sprinkler System | |
| Deluge Sprinkler System | |
| Services |
| Sprinkler Heads |
| Pipes and Fittings |
| Control Valves |
| Alarm Valves |
| Sensors and Detectors |
| Accessories |
| Commercial Buildings |
| Industrial Buildings |
| Residential Buildings |
| Steel |
| CPVC |
| Copper |
| Other Pipe Materials |
| Direct Sales |
| Distributor Sales |
| Online/Third-Party |
| OEM Packaged Deals |
| By Solution | Systems | Wet-Pipe Sprinkler System |
| Dry-Pipe Sprinkler System | ||
| Pre-Action Sprinkler System | ||
| Deluge Sprinkler System | ||
| Services | ||
| By Component | Sprinkler Heads | |
| Pipes and Fittings | ||
| Control Valves | ||
| Alarm Valves | ||
| Sensors and Detectors | ||
| Accessories | ||
| By End-User Vertical | Commercial Buildings | |
| Industrial Buildings | ||
| Residential Buildings | ||
| By Pipe Material | Steel | |
| CPVC | ||
| Copper | ||
| Other Pipe Materials | ||
| By Distribution Channel | Direct Sales | |
| Distributor Sales | ||
| Online/Third-Party | ||
| OEM Packaged Deals |


Key Questions Answered in the Report
What is the current value of the North America fire sprinkler systems market?
The market generated USD 2.81 billion in 2026 and is projected to reach USD 3.07 billion by 2031.
Which solution type leads regional revenue?
Wet-pipe systems maintain the highest share with 63.98% of 2025 revenue.
Which geography is expanding the fastest in North America?
Mexico is forecast to grow at a 2.91% CAGR through 2031 on the back of nearshoring investments.
How do insurer incentives influence adoption?
State Farm and USAA offer 5-15% premium discounts for NFPA 13-compliant properties, shortening payback periods on new installations.
What role do remote inspections play in future growth?
NFPA 915 allows certified technicians to conduct video-based valve checks, reducing inspection costs and accelerating renovation schedules.
Which companies dominate smart sprinkler monitoring?
Johnson Controls with OpenBlue and Siemens with its Smart Fire Sprinkler Service lead the shift toward IoT-enabled predictive maintenance.
Page last updated on:


