Fire Suppression Systems Market Size and Share
Market Overview
| Study Period | 2020 - 2031 |
|---|---|
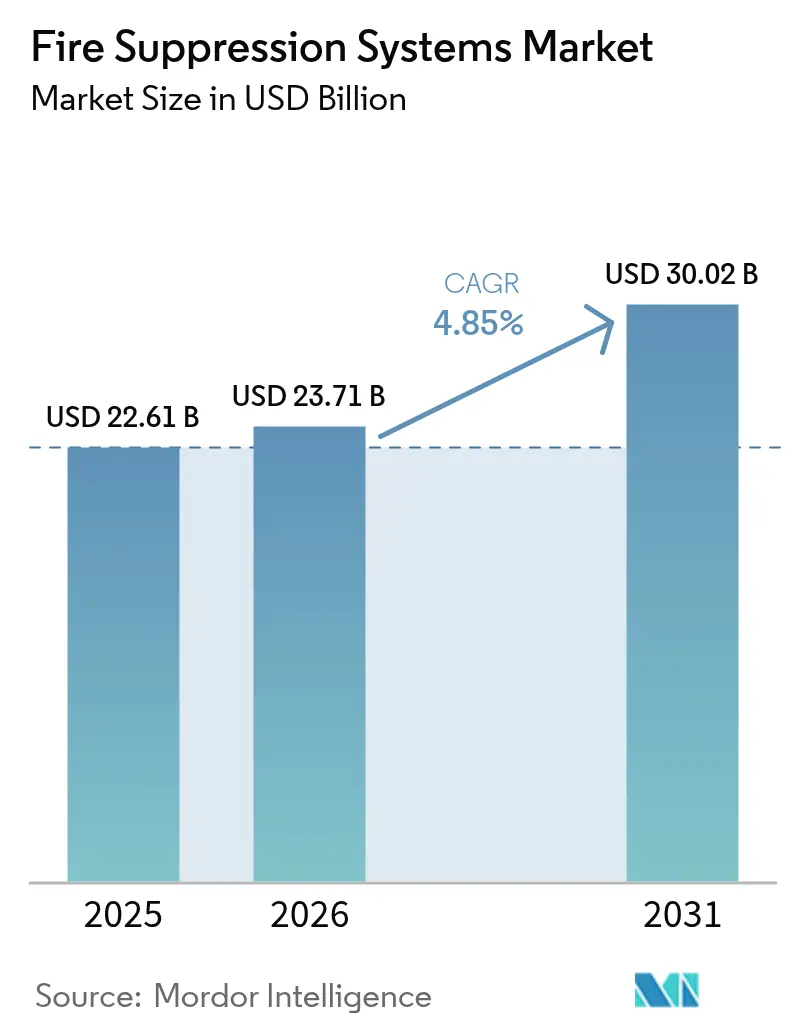
| Market Size (2026) | USD 23.71 Billion |
| Market Size (2031) | USD 30.02 Billion |
| Growth Rate (2026 - 2031) | 4.85% CAGR |
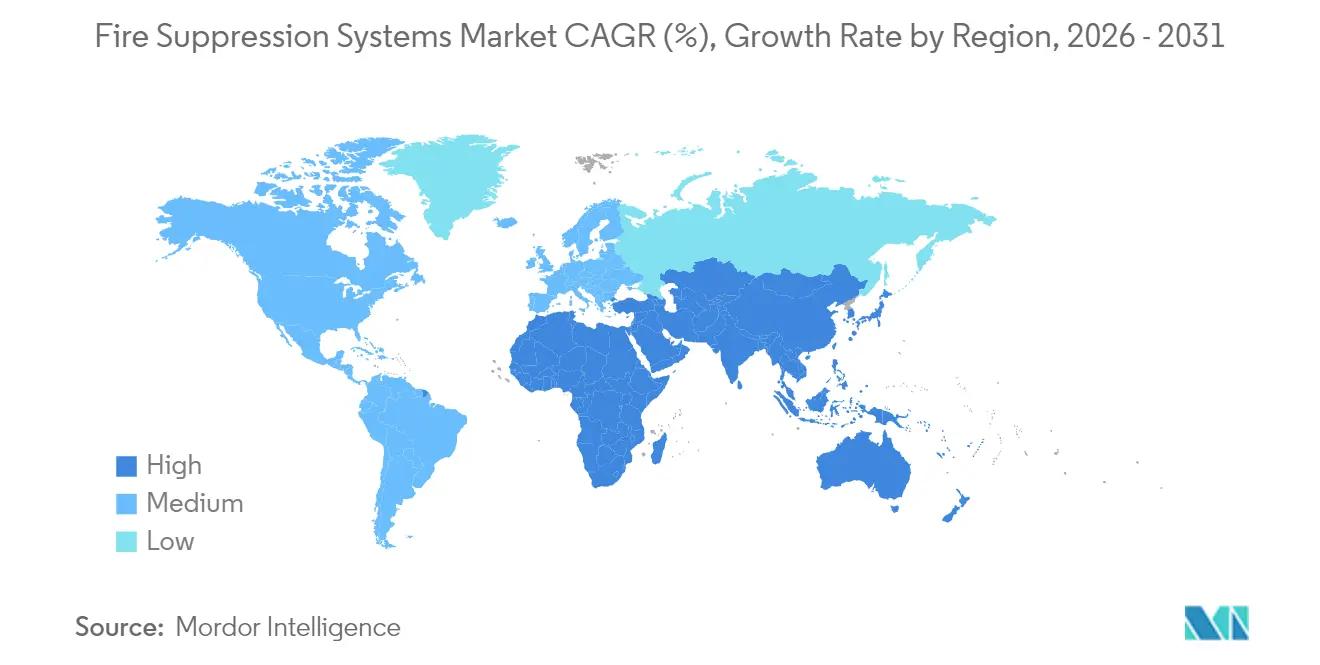
| Fastest Growing Market | Middle East and Africa |
| Largest Market | Asia Pacific |
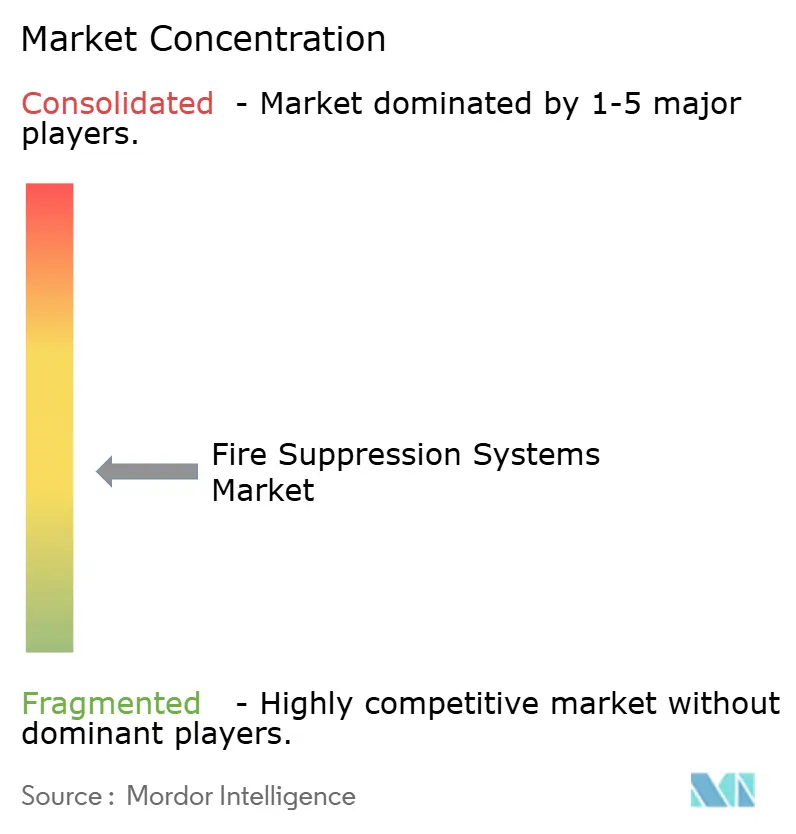
| Market Concentration | Medium |
Major Players *Disclaimer: Major Players sorted in no particular order Image © Mordor Intelligence. Reuse requires attribution under CC BY 4.0. | |
Fire Suppression Systems Market Analysis by Mordor Intelligence
The fire suppression systems market size was valued at USD 22.61 billion in 2025 and estimated to grow from USD 23.71 billion in 2026 to reach USD 30.02 billion by 2031, at a CAGR of 4.85% during the forecast period (2026-2031). Heightened regulatory scrutiny, the migration toward environmentally benign clean agents, and sustained infrastructure spending in data centers, energy, and high-rise construction collectively underpin the growth path of the fire suppression systems market. Water-based sprinklers retain cost leadership, yet clean-agent platforms are scaling quickly on halon-replacement demand. Asia-Pacific, propelled by hyperscale data center buildouts and factory additions, already contributes the largest regional revenue slice. Meanwhile, portfolio optimization by leading OEMs and integrators signals a maturing but still consolidating competitive arena.
Key Report Takeaways
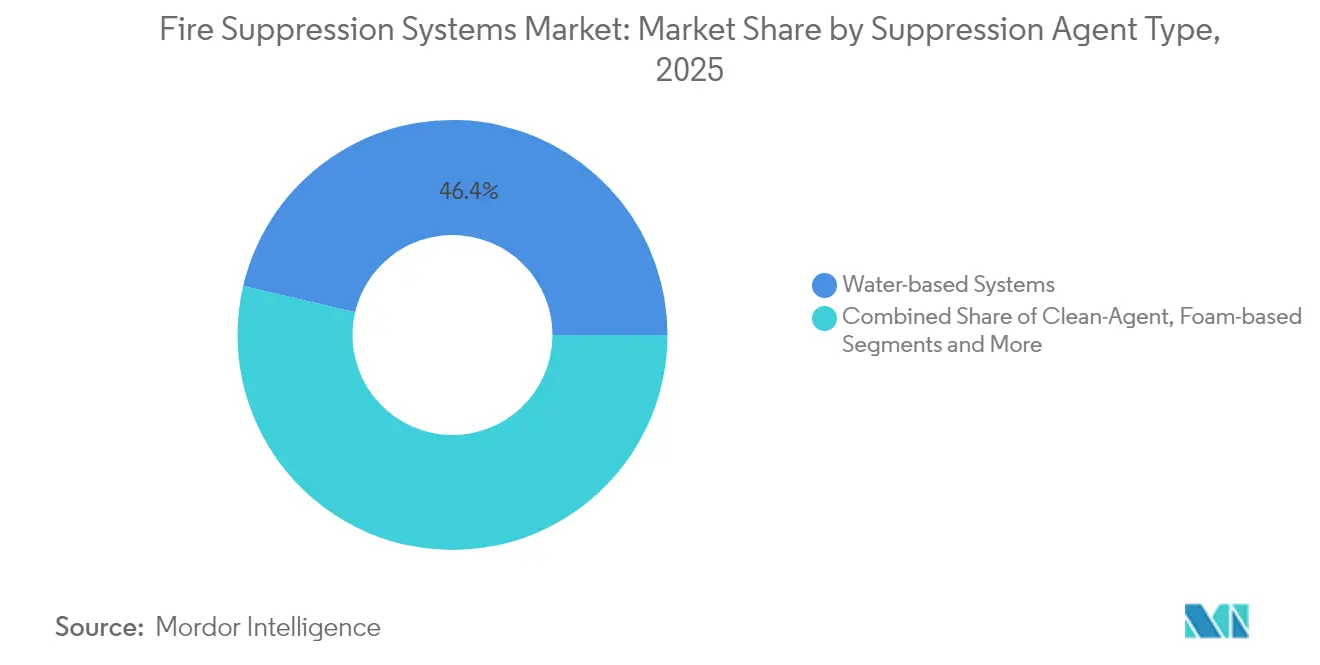
- By suppression agent, water-based products held 46.35% of fire suppression systems market share in 2025, while clean agents are projected to expand at a 6.95% CAGR to 2031.
- By product configuration, fixed installations accounted for 81.20% of the fire suppression systems market size in 2025; portable/mobile solutions are forecast to grow at 5.85% CAGR through 2031.
- By end-use industry, commercial buildings led with a 33.35% revenue share in 2025, whereas oil & gas registered the fastest CAGR at 6.12% during 2026-2031.
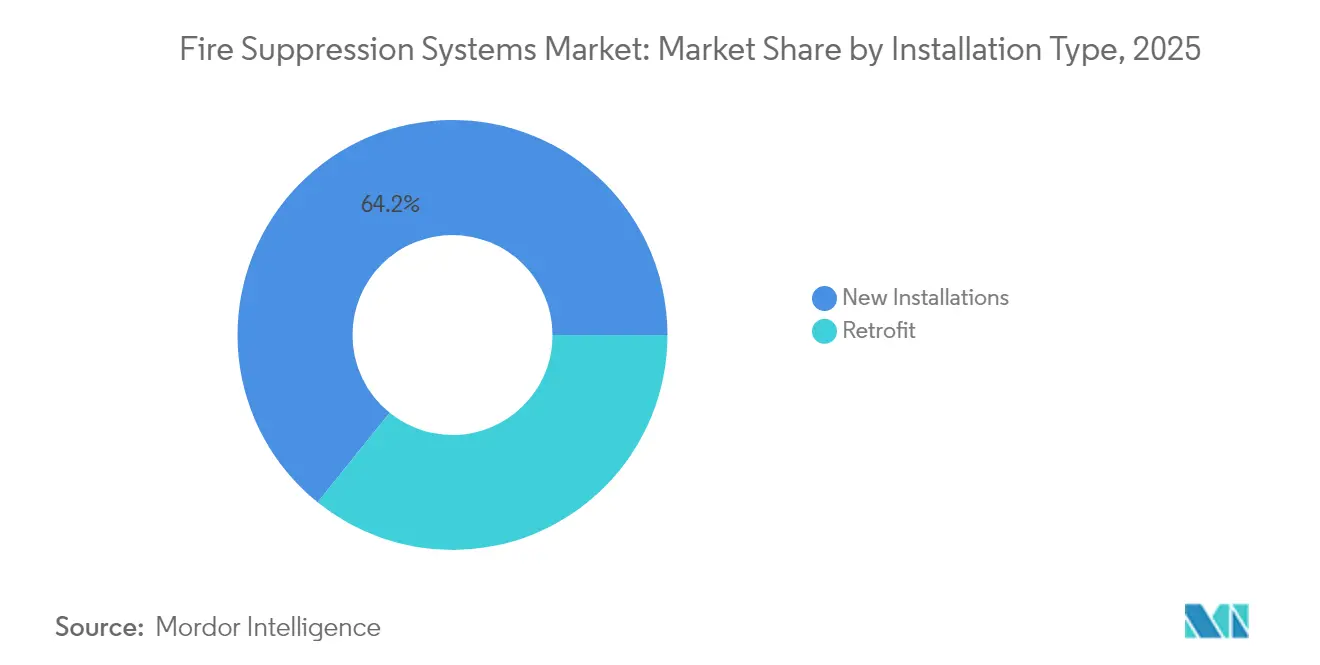
- By installation type, new builds captured 64.20% of 2025 revenue, while retrofit upgrades are set to advance at a 6.75% CAGR over the forecast horizon.
- By distribution channel, system integrators and EPC contractors commanded 51.30% of global turnover in 2025, whereas direct-to-end-user sales are projected to rise at a 5.72% CAGR through 2031.
- By geography, Asia-Pacific captured 35.65% of the fire suppression systems market in 2025 and is expected to remain the largest contributor through 2031.
Note: Market size and forecast figures in this report are generated using Mordor Intelligence’s proprietary estimation framework, updated with the latest available data and insights as of 2026.
Global Fire Suppression Systems Market Trends and Insights
Drivers Impact Analysis*
| DRIVER | (~) % IMPACT ON CAGR FORECAST | GEOGRAPHIC RELEVANCE | IMPACT TIMELINE |
|---|---|---|---|
| Transition from Halon to Sustainable Clean-Agent Replacements | +0.8% | Europe, North America | Medium term (2-4 years) |
| Insurance Premium Discounts for Automated Suppression in High-Value Assets | +0.6% | North America, Europe | Short term (≤ 2 years) |
| Data-center Boom Spurring Water-less Gaseous Systems | +1.2% | Asia-Pacific, North America | Long term (≥ 4 years) |
| Offshore Oil-&-Gas Fire-safety Mandates | +0.4% | North Sea, GCC, Global offshore | Medium term (2-4 years) |
| Post-Grenfell Residential High-Rise Sprinkler Mandates | +0.3% | UK, US, Europe | Short term (≤ 2 years) |
| EV-Battery Production Lines Requiring Dry-Chemical Suppression | +0.9% | Global, concentrated in Asia | Long term (≥ 4 years) |
| Source: Mordor Intelligence | |||
Transition from Halon to Sustainable Clean-Agent Replacements
EASA’s requirement for halon-free aircraft fire protection by 2026 forces airlines and MROs to retrofit nearly 15,000 aircraft, creating a USD 800 million annual opportunity for Novec 1230, FM-200, and inert-gas systems. Demand concentrates in hangars, telecom hubs, and mission-critical facilities where environmental compliance outweighs life-cycle cost, favoring integrators with multi-agent design expertise.[1]European Aviation Safety Agency, “NPA 2014-26,” easa.europa.eu
Insurance Premium Discounts for Automated Suppression in High-Value Assets
Commercial property insurers grant 5-15% policy discounts for NFPA-compliant automatic systems, a benefit magnified by U.S. tax code Section 179 that allows immediate expensing of up to USD 1.22 million for sprinkler installations. The combined savings reduce payback periods to three years for many data centers and pharma plants.
Data-Center Boom Spurring Water-less Gaseous Systems
Hyperscale operators in China are growing IT floor space above 40% annually, prioritizing Novec 1230 and IG-541 systems that leave no residue on servers. Higher-pressure cylinders cut storage footprints by 60%, a critical advantage in premium urban real estate.
Offshore Oil-and-Gas Fire-Safety Mandates
IMO guidelines introduced in 2020 tighten pump-room and engine-room standards, prompting retrofits worth USD 300 million per year in the North Sea and GCC arenas. Certified vendors with marine-grade corrosion-proof components capture this specialized demand.
Restraints Impact Analysis*
| RESTRAINTS | (~) % IMPACT ON CAGR FORECAST | GEOGRAPHIC RELEVANCE | IMPACT TIMELINE |
|---|---|---|---|
| PFAS Ban Driving Costly AFFF Foam Retrofits | -0.7% | Europe, North America, Australia | Short term (≤ 2 years) |
| Scarcity of NFPA-Certified Installers in Emerging Asia | -0.5% | Asia-Pacific emerging markets | Medium term (2-4 years) |
| Semiconductor Component Shortages Delaying Projects | -0.4% | Global | Short term (≤ 2 years) |
| High CAPEX of Inert-Gas Systems for Small Premises | -0.3% | Global, particularly SMEs | Long term (≥ 4 years) |
| Source: Mordor Intelligence | |||
PFAS Ban Driving Costly AFFF Foam Retrofits
The EU’s impending PFAS prohibition forces airports and petro-chemical depots to swap AFFF for fluorine-free formulations that require 30-50% higher application rates, raising per-site retrofit costs to USD 150,000–500,000.[2]Fire Industry Association, “FIA Guidance on PFAS in Firefighting Foams Restrictions Update September 2024,” fia.uk.com
Scarcity of NFPA-Certified Installers in Emerging Asia
The shortage of NFPA-certified technicians across emerging Asian markets constrains system deployment capacity and inflates installation costs by 25-40% compared to mature markets. NAFED certification programs require 3-year renewal cycles and specialized training that many regional contractors cannot access due to geographic and language barriers.
*Our forecasts treat driver/restraint impacts as directional, not additive. The impact forecasts reflect baseline growth, mix effects, and variable interactions.
Segment Analysis
By Suppression Agent Type: Clean Agents Drive Innovation
Water-based sprinklers retained a 46.35% fire suppression systems market share in 2025, buoyed by low cost and proven performance. Clean-agent solutions, although smaller in absolute value, are slated for a 6.95% CAGR, lifting their fire suppression systems market size measurably during 2026-2031. Regulatory pressure to replace halon and PFAS foams accelerates adoption of Novec 1230, FM-200, and IG-541.
Technology convergence is spawning hybrid arrangements that pair water mist with inert gas to tame lithium-ion thermal runaway. UL 9540A trials show water overlays can halt cascading cell failures faster than gas-only discharges. Foam lines, challenged by fluorine-free transition costs, risk incremental share loss, whereas CO₂ and powder systems cling to niche roles in unoccupied or battery-assembly zones.


By Product Configuration: Fixed Systems Dominate Infrastructure
Fixed installations accounted for 81.20% of the 2025 fire suppression systems market, reflecting end-users’ preference for always-on protection in data centers, refineries, and commercial towers. Portables, although smaller, are gaining at 5.85% CAGR as construction sites and events need flexible cover.
High-bay warehouses and cold-storage facilities are adopting Johnson Controls’ Tyco ESFR-25 dry-type sprinkler, which functions at −60 °F and eliminates in-rack heads. IoT-enabled monitors now extend to portables, giving facility managers real-time visibility similar to fixed networks.
By End-Use Industry: Industrial Leads Growth
Commercial real-estate commanded 33.35% of 2025 revenue, yet oil & gas, chemicals, and energy storage are forecast to log the steepest 6.12% CAGR through 2031. The fire suppression systems market in industrial complexes is propelled by production downtime risks exceeding USD 1 million per day.
Residential retrofits expand steadily after the UK and select U.S. states tightened sprinkler codes. Transportation, especially EV manufacturing, is experimenting with embedded suppression hardware such as Hyundai Mobis’ integrated battery module, potentially reshaping system-level demand.
By Installation Type: Retrofits Accelerate Growth
New-builds still form 64.20% of installation value, but retrofits will outpace them at 6.75% CAGR as regulations change faster than building cycles. Seismic bracing and vacuum drain technology included in the 2025 NFPA 13 edition will force upgrades in legacy structures.
Occupied-site retrofits command premium pricing because integrators must stage work to avoid business disruption. Owners often decide that full replacement beats piecemeal upgrades due to compatibility and liability concerns.
By Distribution Channel: Integrators Leverage Expertise
System integrators and EPC contractors captured 51.30% of 2025 sales, a testament to the complexity of sizing, hydraulic calculations, and code approvals in the fire suppression systems market. Direct-to-end-user channels grow near 5.72% CAGR, facilitated by e-procurement portals offering standardized components.
Nonetheless, liability transfer keeps large corporates wedded to integrators who can underwrite design warranties. In emerging Asia, contractor scarcity still tilts bargaining power toward global integrators.
Geography Analysis
Asia-Pacific produced 35.65% of global revenue in 2025 as China, India, and Southeast Asia commissioned hyperscale data centers and megaproject factories. Government incentives and an average USD 2 trillion in annual construction spending ensure the region remains the epicenter of the fire suppression systems market. NFPA-certified labor shortages continue to stretch project timelines and raise installed costs, yet domestic codes are gradually harmonizing with U.S. and EU standards to open cross-border supply chains.
North America enjoys deep installer pools and mature building codes, translating into predictable retrofit volumes tied to insurance incentives. The 2025 NFPA 13 update is expected to inject a new wave of demand across legacy warehouses and healthcare facilities. Component shortages, especially in electronic control panels, have introduced 3-6-month delays, but value-chain resiliency programs underway at leading OEMs should ease the bottleneck during 2026.
Europe records steady uptake as the PFAS foam ban and post-Grenfell rules reshape specifications. Germany’s advanced manufacturing plants demand inert-gas and water-mist hybrids that command premium pricing. Offshore wind farms in the North Sea are another rising niche, requiring marine-grade suppression assemblies. Brexit-related customs frictions persist, yet collaborative agreements with EU-based distributors are smoothing flows of cylinders and valves.

Competitive Landscape
The fire suppression systems market is moderately concentrated. Johnson Controls, Siemens, and Honeywell collectively captured roughly 32% of 2024 revenue. Their strengths include broad portfolios, proprietary detection algorithms, and lifelong service contracts. Siemens’ USD 1.8 billion purchase of Danfoss Fire Safety added high-pressure water-mist know-how. Carrier’s USD 1.425 billion divestiture of its industrial fire unit to Sentinel demonstrates ongoing portfolio pruning to focus on core HVAC.
Private equity appetite remains high: Blackstone bought AI Fire for USD 1.1 billion, while ADIA and GIC acquired minority stakes in Pye-Barker Fire & Safety, signaling confidence in aftermarket service margins. Local champions in China and India continue to win green-field contracts where domestic certification or language fluency confers advantage, creating fertile ground for future consolidation.
Technology competition now hinges on sustainable agents and IoT integration. Vendors increasingly bundle analytics dashboards that track cylinder pressure, valve status, and false-alarm trends. Early adopters report maintenance cost cuts near 15%. As cyber-security rules tighten for critical infrastructure, OEMs with UL CAP or IEC 62443 credentials will widen their moat.
Fire Suppression Systems Industry Leaders
Johnson Controls International plc
Siemens AG
Carrier Global Corp.
Minimax Viking Group
Honeywell International Inc.
- *Disclaimer: Major Players sorted in no particular order

Recent Industry Developments
- March 2025: Conquest Flamebar received growth financing from Decathlon Capital Partners to support capacity expansion in fire-rated duct systems, reflecting increased demand for specialized fire protection components in commercial construction.
- May 2025: Honeywell announced its agreement to acquire Johnson Matthey's Catalyst Technologies business for £1.8 billion (USD 2.3 billion), expanding its portfolio of process technologies relevant to fire suppression chemical manufacturing.
- April 2025: Hyundai Mobis launched an innovative EV battery system with built-in fire suppression capabilities designed to prevent thermal runaway within 5 minutes, setting new safety standards for automotive applications.
- March 2025: Compass Minerals announced the closure of its fire retardant business, Fortress North America, as part of cost structure reductions, eliminating nearly 50 positions and reflecting market consolidation pressures.


Global Fire Suppression Systems Market Report Scope
Fire suppression systems are employed to evade the spread of fire in a structure. Most fire suppression systems are static and are applied to shield a building against destruction, and several techniques are available for use in vehicles.
The fire suppression systems market is segmented by solution type (water-based systems, gas-based systems, foam-based systems), end-user vertical (commercial buildings, industrial buildings, residential buildings), and geography.
| Water-based Systems (Sprinkler, Mist) |
| Clean-Agent (FM-200, Novec 1230, Inert Gas) |
| Foam-based Systems (AFFF, Fluorine-free) |
| Dry-Chemical Powder Systems |
| Carbon-Dioxide Systems |
| Hybrid Inert-Gas and Water-Mist Systems |
| Fixed/Installed Systems |
| Portable and Mobile Units |
| Commercial (Offices, Retail, Hospitality) |
| Industrial (Oil and Gas, Energy, Manufacturing, Warehouses) |
| Residential (Multi- and Single-Family) |
| Transportation (Marine, Aviation, Rail, Automotive) |
| Public and Institutional (Education, Healthcare, Government) |
| New Installations |
| Retrofit and Replacement |
| Direct to End-User |
| System Integrators and EPC Contractors |
| OEM/Equipment Manufacturers |
| North America | United States |
| Canada | |
| Mexico | |
| South America | Brazil |
| Argentina | |
| Rest of South America | |
| Europe | Germany |
| United Kingdom | |
| France | |
| Italy | |
| Spain | |
| Rest of Europe | |
| Asia-Pacific | China |
| India | |
| Japan | |
| South Korea | |
| ASEAN | |
| Australia | |
| Rest of Asia-Pacific | |
| Middle East and Africa | Saudi Arabia |
| South Africa | |
| Nigeria | |
| United Arab Emirates | |
| Rest of Middle East and Africa |
| By Suppression Agent Type | Water-based Systems (Sprinkler, Mist) | |
| Clean-Agent (FM-200, Novec 1230, Inert Gas) | ||
| Foam-based Systems (AFFF, Fluorine-free) | ||
| Dry-Chemical Powder Systems | ||
| Carbon-Dioxide Systems | ||
| Hybrid Inert-Gas and Water-Mist Systems | ||
| By Product Configuration | Fixed/Installed Systems | |
| Portable and Mobile Units | ||
| By End-Use Industry | Commercial (Offices, Retail, Hospitality) | |
| Industrial (Oil and Gas, Energy, Manufacturing, Warehouses) | ||
| Residential (Multi- and Single-Family) | ||
| Transportation (Marine, Aviation, Rail, Automotive) | ||
| Public and Institutional (Education, Healthcare, Government) | ||
| By Installation Type | New Installations | |
| Retrofit and Replacement | ||
| By Distribution Channel | Direct to End-User | |
| System Integrators and EPC Contractors | ||
| OEM/Equipment Manufacturers | ||
| By Geography | North America | United States |
| Canada | ||
| Mexico | ||
| South America | Brazil | |
| Argentina | ||
| Rest of South America | ||
| Europe | Germany | |
| United Kingdom | ||
| France | ||
| Italy | ||
| Spain | ||
| Rest of Europe | ||
| Asia-Pacific | China | |
| India | ||
| Japan | ||
| South Korea | ||
| ASEAN | ||
| Australia | ||
| Rest of Asia-Pacific | ||
| Middle East and Africa | Saudi Arabia | |
| South Africa | ||
| Nigeria | ||
| United Arab Emirates | ||
| Rest of Middle East and Africa | ||


Key Questions Answered in the Report
What is the current value of the fire suppression systems market?
The fire suppression systems market is valued at USD 23.71 billion in 2026 and is projected to climb to USD 30.02 billion by 2031.
Which suppression agent type is growing the fastest?
Clean-agent platforms such as Novec 1230 and FM-200 are expanding at a 6.95% CAGR, the quickest among agent categories.
Why are data centers opting for gaseous systems over water sprinklers?
Gaseous agents avoid water damage to electronics, occupy smaller footprints with high-pressure cylinders, and comply with hyperscale operators’ uptime mandates.
How are PFAS regulations affecting foam-based systems?
EU and U.S. bans on PFAS are forcing costly retrofits to fluorine-free foams, raising per-site expenses by up to USD 500,000 and temporarily dampening foam demand.
Which region leads market revenue?
Asia-Pacific contributes 35.65% of global revenue, fueled by large-scale industrialization and data-center construction.
Are integrated detection and suppression platforms becoming standard?
Yes, OEMs increasingly bundle IoT analytics that cut maintenance costs and reduce false alarms, a differentiator in competitive bids.
Page last updated on:


