Fire Sprinkler Market Size and Share
Market Overview
| Study Period | 2019 - 2030 |
|---|---|
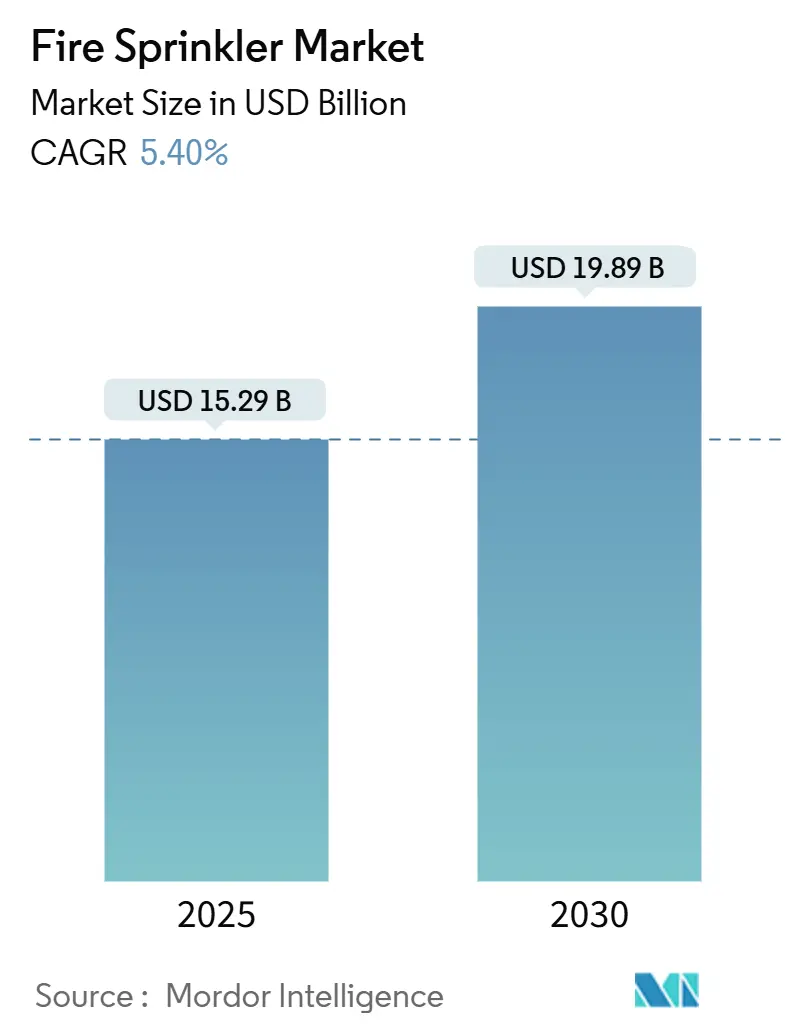
| Market Size (2025) | USD 15.29 Billion |
| Market Size (2030) | USD 19.89 Billion |
| Growth Rate (2025 - 2030) | 5.40% CAGR |
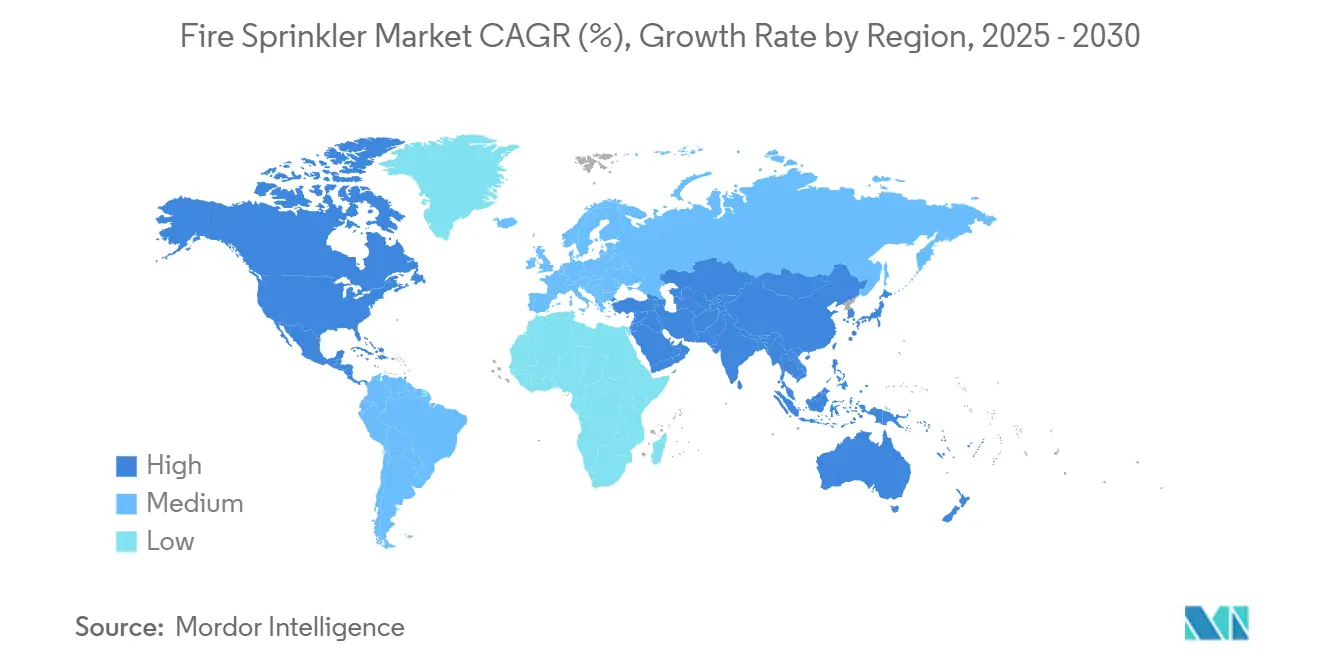
| Fastest Growing Market | North America |
| Largest Market | Asia Pacific |
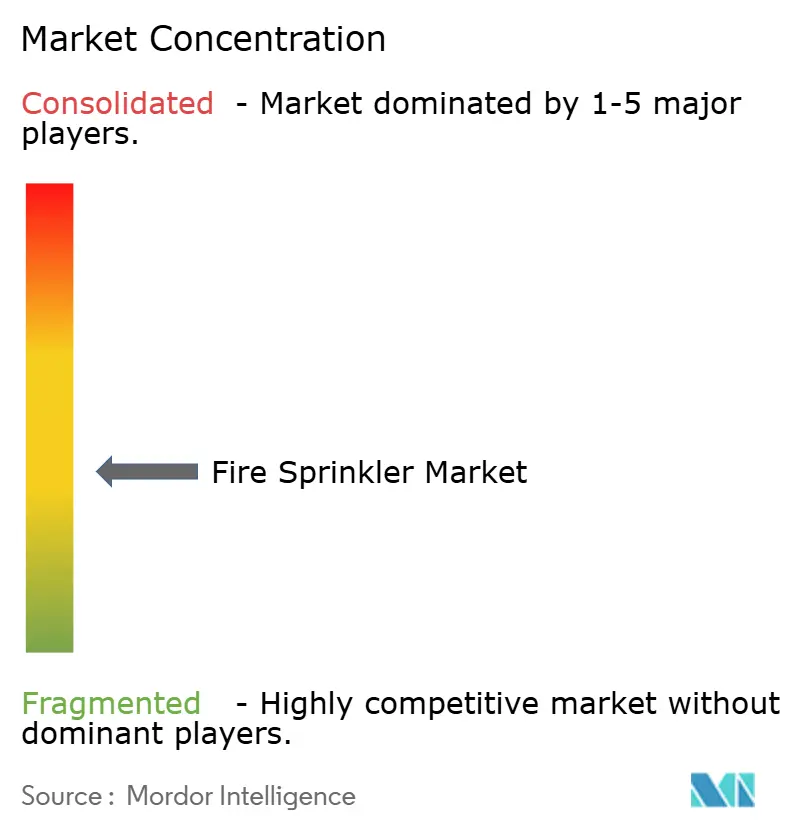
| Market Concentration | Medium |
Major Players *Disclaimer: Major Players sorted in no particular order Image © Mordor Intelligence. Reuse requires attribution under CC BY 4.0. | |
Fire Sprinkler Market Analysis by Mordor Intelligence
The fire sprinkler market size stands at USD 15.29 billion in 2025 and is projected to reach USD 19.89 billion by 2030, registering a 5.40% CAGR. Rising code stringency, sustained high-rise construction, and the shift toward smart suppression platforms underpin this growth. Jurisdictions adopting the 2024 International Building Code (IBC) and the forthcoming 2025 NFPA 13 edition have widened mandatory coverage to more occupancies, while China’s GB 55037-2022 is driving similar momentum across Asia. Insurance carriers now grant 5%–20% premium reductions for sprinkler-equipped properties, turning compliance investments into operating-expense savings.[1]New Jersey Fire Sprinkler Advisory Board, “The Impact of Fire Sprinklers on Insurance Rates: Cost Savings and Protection,” NJFSAB.ORG Smart valves, sensors, and AI-enabled analytics are transforming legacy systems into predictive maintenance ecosystems that minimize downtime and water damage. Competitive dynamics remain fragmented, yet consolidation is accelerating as regional specialists are acquired by diversified safety groups seeking scale and digital capabilities.
Key Report Takeaways
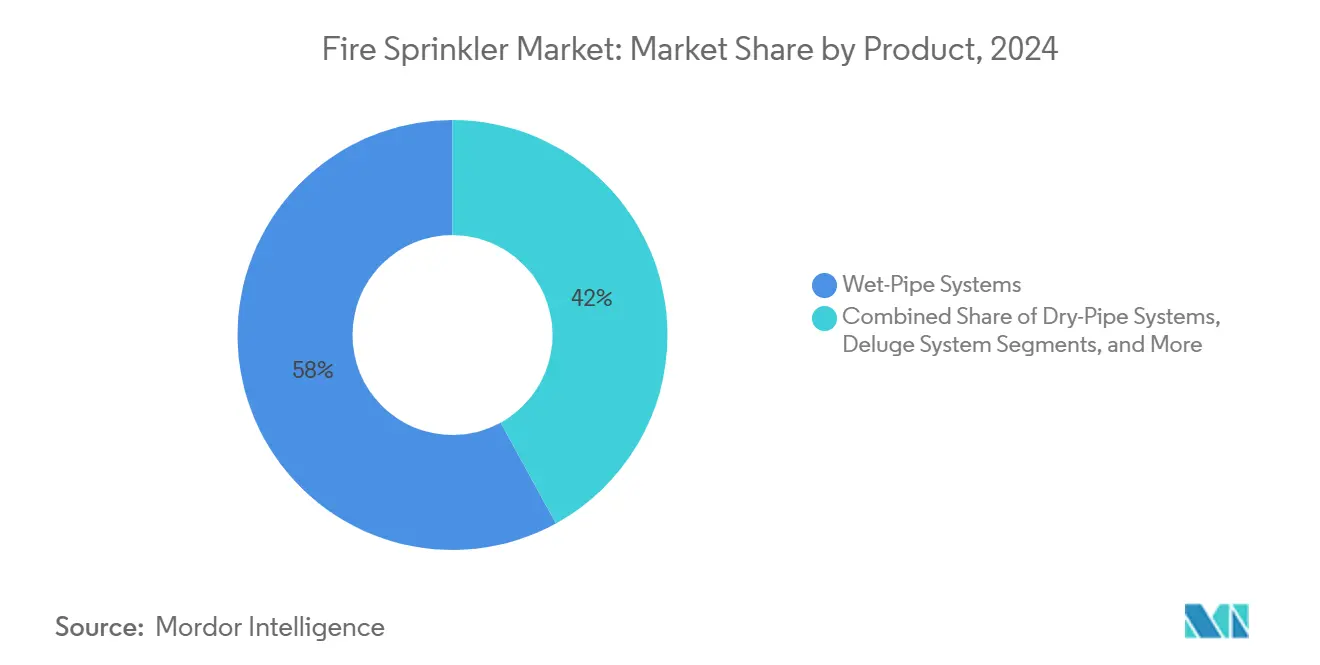
- By product, wet-pipe systems led with 58.11% of fire sprinkler market share in 2024; water-mist systems are forecast to expand at a 6.11% CAGR through 2030.
- By component, sprinkler heads accounted for 46.23% of the fire sprinkler market size in 2024, while smart valves and sensors are advancing at a 10.40% CAGR to 2030.
- By technology, conventional systems held 83.31% share of the fire sprinkler market size in 2024; smart/IoT-enabled solutions are projected to grow at 9.61% CAGR between 2025 and 2030.
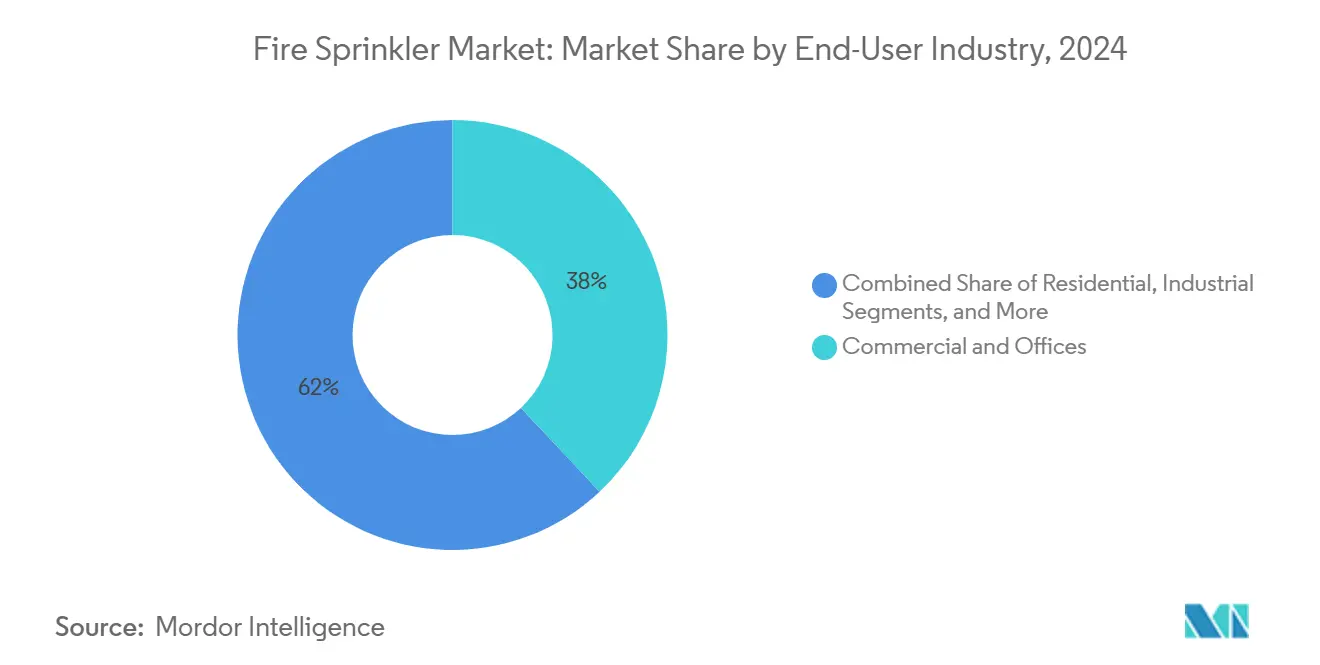
- By end-use, commercial and offices captured 38.03% of fire sprinkler market share in 2024; industrial applications are set to expand at a 6.77% CAGR to 2030.
- By geography, North America commanded 34.47% share of the fire sprinkler market size in 2024, whereas Asia-Pacific is expected to post a 7.33% CAGR through 2030.
- By distribution channel, contractors/EPCs held 55.41% share in 2024; online and e-commerce channels are rising at a 5.82% CAGR to 2030.
Global Fire Sprinkler Market Trends and Insights
Drivers Impact Analysis*
| Driver | (~) % Impact on CAGR Forecast | Geographic Relevance | Impact Timeline |
|---|---|---|---|
| Stringent adoption of 2024 IBC and 2025 NFPA-13 codes | +1.2% | North America and European Union, expanding to Asia Pacific | Medium term (2–4 years) |
| Rapid global high-rise construction pipeline | +1.0% | Global, concentrated in Asia Pacific urban centers | Long term (≥ 4 years) |
| Insurance premium discounts for sprinkler-equipped facilities | +0.8% | North America and European Union primary, emerging in Asia Pacific | Short term (≤ 2 years) |
| CARES-Act-backed retrofit tax incentives (United States) | +0.6% | United States national | Short term (≤ 2 years) |
| Cold-chain warehouse boom driving ESFR-dry demand | +0.7% | Global, led by North America and Asia Pacific | Medium term (2–4 years) |
| Emergence of AI-enabled smart sprinklers and predictive O&M | +0.9% | North America and European Union early adoption, Asia Pacific following | Long term (≥ 4 years) |
| Source: Mordor Intelligence | |||
Stringent adoption of 2024 IBC and 2025 NFPA-13 codes
Recent code updates extend mandatory sprinkler coverage to more building types and refine technical criteria such as sloped-ceiling storage protection and seismic bracing. These revisions simplify multinational project compliance by harmonizing regional standards, shorten design cycles, and create retrofit demand as older properties risk losing insurance credits if they do not meet the new benchmarks.[2]Brian O’Connor, “Key Changes Proposed for the 2025 Edition of NFPA 13,” NFPA.ORG
Rapid global high-rise construction pipeline
Urban densification strategies fuel taller mixed-use towers that rely on active suppression because lightweight materials reduce passive fire resistance. Updated corridor and balcony rules now require sprinklers on exterior elements, broadening system scope and driving flexible piping solutions that withstand seismic loads. Limited external firefighting access in super-tall buildings further elevates sprinkler performance requirements.
Insurance premium discounts for sprinkler-equipped facilities
Carriers have shifted to risk-based pricing that rewards buildings with robust, well-maintained systems, often delivering double-digit operating-expense savings. IoT leak detection and monitoring modules now qualify buildings for additional credits, reinforcing the business case for smart upgrades.
CARES-Act-backed retrofit tax incentives (United States)
Section 179 expensing allows owners to write off up to USD 1 million of qualifying sprinkler investments, pulling forward projects in educational, hospitality, and warehouse facilities.[3]Impact Fire, “How Fire Protection Systems Can Lower Insurance Premiums,” IMPACTFIRESERVICES.COM Pairing these incentives with insurance savings accelerates payback periods and supports steady retrofit pipelines.
Restraints Impact Analysis*
| Restraint | (~) % Impact on CAGR Forecast | Geographic Relevance | Impact Timeline |
|---|---|---|---|
| Up-front install cost in low-rise residential | -0.9% | Global, acute in emerging markets | Short term (≤ 2 years) |
| Home-builder lobbying against mandatory sprinklers | -0.7% | North America primary, expanding globally | Medium term (2–4 years) |
| Steel and copper price volatility inflating component costs | -0.6% | Global supply chain impact | Short term (≤ 2 years) |
| Certified-installer labor shortages in EMs | -0.5% | Emerging markets concentrated | Long term (≥ 4 years) |
| Source: Mordor Intelligence | |||
Up-front install cost in low-rise residential
Material, booster-pump, and permit expenses push total system outlays to USD 6,000–30,000 per dwelling, straining budgets in affordable housing and rural projects. Additional plumbing modifications during retrofits double costs versus new-build scenarios, and fragmented design standards hinder volume pricing efficiencies.
Home-builder lobbying against mandatory sprinklers
Industry groups fund statewide campaigns that frame mandates as affordability threats. Legislative bans in several U.S. states limit local authorities from enforcing residential requirements, slowing penetration outside California and Maryland.
*Our forecasts treat driver/restraint impacts as directional, not additive. The impact forecasts reflect baseline growth, mix effects, and variable interactions.
Segment Analysis
By Product: Wet-Pipe Systems Dominate Traditional Applications
Wet-pipe systems accounted for 58.11% of the fire sprinkler market size in 2024 due to their straightforward design and immediate water discharge. Their reliability keeps them entrenched in offices, retail, and multifamily housing where freeze risk is minimal. Dry-pipe, pre-action, and deluge variants secure niche roles in unheated warehouses, data centers, and petrochemical sites that pose unique hazards. Water-mist platforms are gaining traction at a 6.11% CAGR because they suppress fires with less water, making them attractive for maritime cabins and historic buildings concerned about collateral damage. The International Maritime Organization’s pending guidance on battery-electric vehicles aboard ships is expected to widen this application set.[4]International Maritime Organization, “Sub-Committee on Ship Systems and Equipment, 10th Session,” IMO.ORG
Wet-pipe share will erode slowly as water-mist nozzles improve throw distance and cost profiles. Dry-type ESFR innovations eliminate in-rack lines in cold-chain warehouses, cutting installation labor and unlocking storage capacity. Market education around maintenance costs and sprinkler coverage is raising awareness among facility managers, positioning hybrid systems that combine conventional heads with water-mist zones for sensitive areas.


By Component: Smart Sensors Drive Innovation
Sprinkler heads represented 46.23% of fire sprinkler market share in 2024, reflecting their ubiquity across every system class. Nevertheless, smart valves, edge sensors, and communication hubs are expanding at a 10.40% CAGR as building owners prioritize life-cycle cost reduction through predictive maintenance. Wireless pressure nodes now perform weekly test routines without personnel onsite, supporting regulatory documentation and minimizing water discharge.
Pipes and fittings grow in line with new installations, though plastic alternatives are gaining in select low-pressure residential applications. Control valves integrate supervisory electronics that trigger alerts for tamper, flow, and ambient-temperature anomalies, tightening insurance reporting requirements. Fire pumps, tanks, and installation services enjoy steady demand as code changes push retrofits, while bundled maintenance contracts lock in recurring revenue for integrators.
By Technology: Smart Systems Disrupt Conventional Dominance
Conventional systems still held 83.31% of fire sprinkler market size in 2024 because contractors are familiar with their specification and inspection routines. Yet smart/IoT-enabled units are forecast to surge 9.61% CAGR as cloud dashboards, AI smoke recognition, and remote impairment detection prove their value in reducing false alarms and downtime. ESFR technology remains indispensable for high-piled storage, especially where lithium battery inventories elevate thermal risk.
South Korean laboratories have demonstrated AI sensors that cut false alarms by 96.6%, pointing to a future where dispatch resources focus only on confirmed events. Integration with access-control and HVAC systems supports coordinated evacuation and smoke-control sequences, reinforcing the premium on interoperable protocols like BACnet.
By End-Use Industry: Cold-Chain Applications Drive Growth
Commercial and office properties commanded 38.03% of fire sprinkler market share in 2024 as corporate real estate cycles tilted toward renovation. Industrial sites, propelled by refrigerated logistics and hyperscale data centers, will post the fastest 6.77% CAGR because they require specialized dry or pre-action solutions that avoid thermal shock and electrical damage.
Institutional segments such as healthcare specify dual-action pre-action and water-mist hybrids to safeguard sensitive equipment, while residential growth depends on overcoming cost and lobbying barriers. Maritime and offshore demand is rising as the ban on PFOS-based foam pushes vessel owners toward compliant alternatives.
By Distribution Channel: Online Sales Emerge
Contractors and EPCs retained 55.41% share in 2024, acting as the primary interface for system design, hydraulic calculation, and commissioning. Direct OEM sales dominate multinational roll-outs where uniform specifications are essential. Distributors leverage regional inventory to serve small contractors but face margin pressure as customers migrate to digital platforms.
Online ordering, posting a 5.82% CAGR, benefits from standardized SKUs and instant spec-sheet downloads that accelerate part replacement. Cloud-based selection tools help smaller firms configure packages without in-house engineering teams, democratizing access to advanced components and intensifying price transparency.
Geography Analysis
North America held 34.47% of fire sprinkler market size in 2024 on the strength of mature codes, tax incentives, and an active retrofit sector that targets older commercial stock. Section 179 expensing, coupled with premium savings, sustains renovations even when new-build starts plateau. Cold-chain warehouse expansions across the Midwest and Southeast are generating orders for ESFR-dry heads, while New York, Toronto, and Mexico City high-rise clusters steady contractor backlogs. Residential penetration remains stunted outside California and Maryland due to lobbying activity, yet smart apartment retrofits show promise as property managers chase insurance discounts.
Asia-Pacific is forecast to register a 7.33% CAGR through 2030, driven by urban megaprojects, industrial reshoring, and evolving standards. China’s GB 55037-2022 imposes stricter performance metrics and accelerates system replacements in aging commercial towers. Southeast Asian logistics parks and semiconductor fabs demand integrated suppression and clean-agent backup, while labor shortages hamper rollout speed. Government-funded training programs and OEM service alliances are narrowing the skill gap.
Europe, the Middle East, and Africa exhibit mixed conditions. Northern and Western European markets mature steadily, emphasizing low-water consumption and recycling. Gulf States fund high-rise icons that incorporate fully networked suppression tied to smart city control centers. African metros such as Nairobi and Lagos witness upticks in commercial sprinkler adoption thanks to insurance requirements on new office towers. South America experiences project lulls when currency volatility stalls imports, although mining and petrochemical hubs in Chile and Brazil anchor steady demand for deluge and foam-water systems.

Competitive Landscape
The vendor field remains moderately fragmented: the top five manufacturers and service providers hold an estimated combined 38% share, leaving regional specialists and niche technology firms ample room. Consolidation accelerated in 2024–2025 as Pye-Barker completed 30 acquisitions and Ferguson expanded through pipe and fabrication deals, seeking scale in procurement and labor coverage. Private equity interest persists; Permira’s purchase of Encore Fire Protection signals confidence in maintenance-centric recurring-revenue models.
Technology differentiation is sharpening. Multinationals are filing patents on AI detection algorithms and low-temperature dry heads to secure competitive advantage. Service propositions increasingly bundle inspection, cloud monitoring, and insurance compliance dashboards. OEMs collaborate with sensor startups to integrate edge analytics, while contractors develop in-house data teams to analyze impairment logs and optimize dispatch.
Regulatory familiarity remains a key buying criterion. Firms with code-writing committee participation gain early insight into forthcoming changes, enabling proactive product roadmaps and training content. As building owners favor single-source providers, integrated players offering design, fabrication, installation, and 24/7 monitoring outperform component-only competitors. Market entry barriers for newcomers rise commensurately with certification and liability insurance thresholds.
Fire Sprinkler Industry Leaders
Johnson Controls International plc
Viking Group Inc.
Reliable Automatic Sprinkler Co., Inc.
Victaulic Company
The Rapidrop Global Ltd.
- *Disclaimer: Major Players sorted in no particular order

Recent Industry Developments
- July 2025: Cobepa S.A. acquired Eagle Fire, expanding its fire and life-safety portfolio across education and healthcare verticals.
- April 2025: Ferguson Enterprises bought Independent Pipe & Supply Corp. and National Fire Equipment Ltd., strengthening its Northeastern U.S. and Canadian fabrication footprint.
- March 2025: LLCP divested Encore Fire Protection to Permira, underscoring investor appetite for maintenance-heavy fire protection businesses.
- November 2024: Building Industry Partners sold Endeavor Fire Protection to APi Group Corporation, marking the first exit under its employee-ownership program.
- October 2024: Johnson Controls introduced the Tyco ESFR-25 Dry-Type Sprinkler for cold-storage facilities at temperatures down to −60 °F.


Global Fire Sprinkler Market Report Scope
| Wet-Pipe Systems |
| Dry-Pipe Systems |
| Deluge Systems |
| Pre-Action Systems |
| Foam-Water and Water-Mist Systems |
| Sprinkler Heads |
| Control Valves and Accessories |
| Pipes and Fittings |
| Alarm Valves and Sensors |
| Fire Pumps and Tanks |
| Installation and Services |
| Conventional / Standard Response |
| ESFR (Early Suppression Fast Response) |
| Smart / IoT-Enabled Sprinklers |
| Residential |
| Commercial and Offices |
| Industrial (Manufacturing, Warehousing, Oil and Gas) |
| Institutional (Healthcare, Education) |
| Marine and Offshore |
| Direct OEM Sales |
| Contractors / EPCs |
| Distributors and Wholesalers |
| Online and e-Commerce |
| North America | United States |
| Canada | |
| Mexico | |
| Europe | Germany |
| France | |
| United Kingdom | |
| Italy | |
| Rest of Europe | |
| Asia-Pacific | China |
| Japan | |
| India | |
| Australia | |
| South Korea | |
| Rest of Asia Pacific | |
| South America | Brazil |
| Argentina | |
| Rest of South America | |
| Middle East | Saudi Arabia |
| United Arab Emirates | |
| Kuwait | |
| Bahrain | |
| Rest of Middle East | |
| Africa | South Africa |
| Egypt | |
| Nigeria | |
| Rest of Africa |
| By Product | Wet-Pipe Systems | |
| Dry-Pipe Systems | ||
| Deluge Systems | ||
| Pre-Action Systems | ||
| Foam-Water and Water-Mist Systems | ||
| By Component | Sprinkler Heads | |
| Control Valves and Accessories | ||
| Pipes and Fittings | ||
| Alarm Valves and Sensors | ||
| Fire Pumps and Tanks | ||
| Installation and Services | ||
| By Technology | Conventional / Standard Response | |
| ESFR (Early Suppression Fast Response) | ||
| Smart / IoT-Enabled Sprinklers | ||
| By End-Use Industry | Residential | |
| Commercial and Offices | ||
| Industrial (Manufacturing, Warehousing, Oil and Gas) | ||
| Institutional (Healthcare, Education) | ||
| Marine and Offshore | ||
| By Distribution Channel | Direct OEM Sales | |
| Contractors / EPCs | ||
| Distributors and Wholesalers | ||
| Online and e-Commerce | ||
| By Geography | North America | United States |
| Canada | ||
| Mexico | ||
| Europe | Germany | |
| France | ||
| United Kingdom | ||
| Italy | ||
| Rest of Europe | ||
| Asia-Pacific | China | |
| Japan | ||
| India | ||
| Australia | ||
| South Korea | ||
| Rest of Asia Pacific | ||
| South America | Brazil | |
| Argentina | ||
| Rest of South America | ||
| Middle East | Saudi Arabia | |
| United Arab Emirates | ||
| Kuwait | ||
| Bahrain | ||
| Rest of Middle East | ||
| Africa | South Africa | |
| Egypt | ||
| Nigeria | ||
| Rest of Africa | ||


Key Questions Answered in the Report
How large is the global fire sprinkler market in 2025?
It is valued at USD 15.29 billion, with a forecast to reach USD 19.89 billion by 2030.
Which product type currently leads sales?
Wet-pipe systems retain the top position, accounting for 58.11% of 2024 revenues.
What is the fastest-growing regional market?
Asia-Pacific is projected to expand at a 7.33% CAGR through 2030, driven by urbanization and stricter codes.
Why are smart suppression systems gaining popularity?
AI analytics reduce false alarms, automate maintenance, and generate insurance discounts, supporting a 9.61% CAGR for IoT-enabled sprinklers.
How do U.S. tax incentives influence adoption?
Section 179 allows owners to expense up to USD 1 million of qualifying sprinkler upgrades, accelerating retrofit activity.
What challenges limit residential adoption?
High installation costs and home-builder lobbying have restricted mandatory sprinkler implementation in many jurisdictions.
Page last updated on:


