Farm Implements Market Size and Share
Market Overview
| Study Period | 2020 - 2030 |
|---|---|
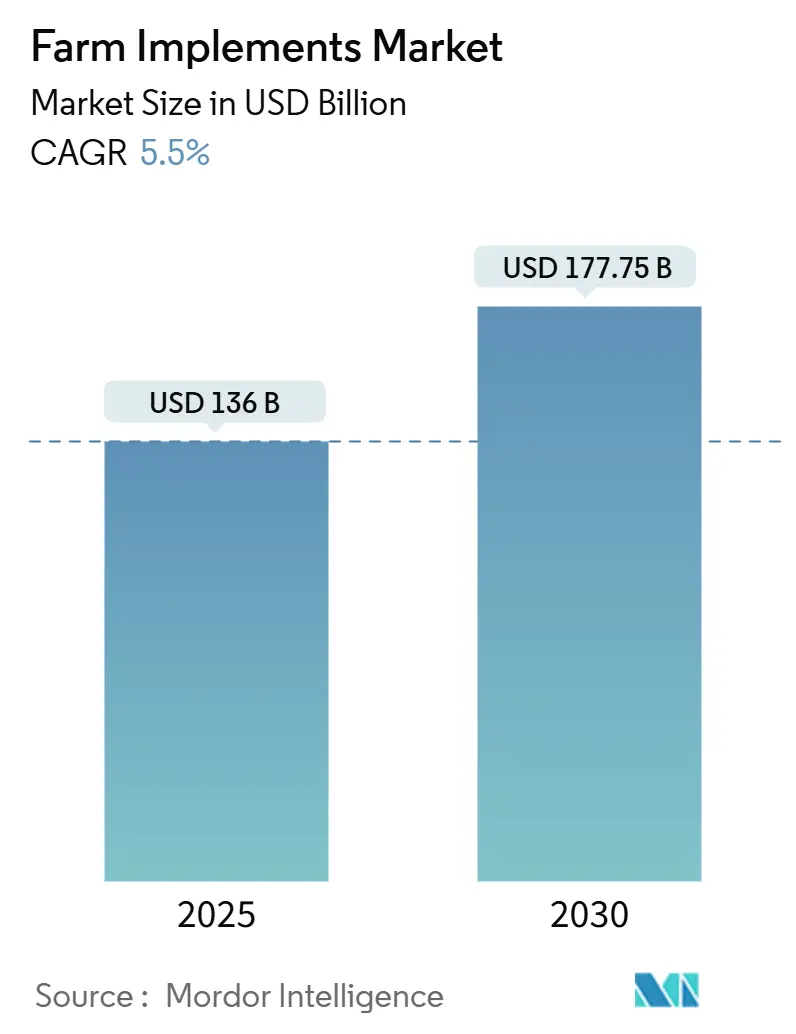
| Market Size (2025) | USD 136 Billion |
| Market Size (2030) | USD 177.75 Billion |
| Growth Rate (2025 - 2030) | 5.50% CAGR |
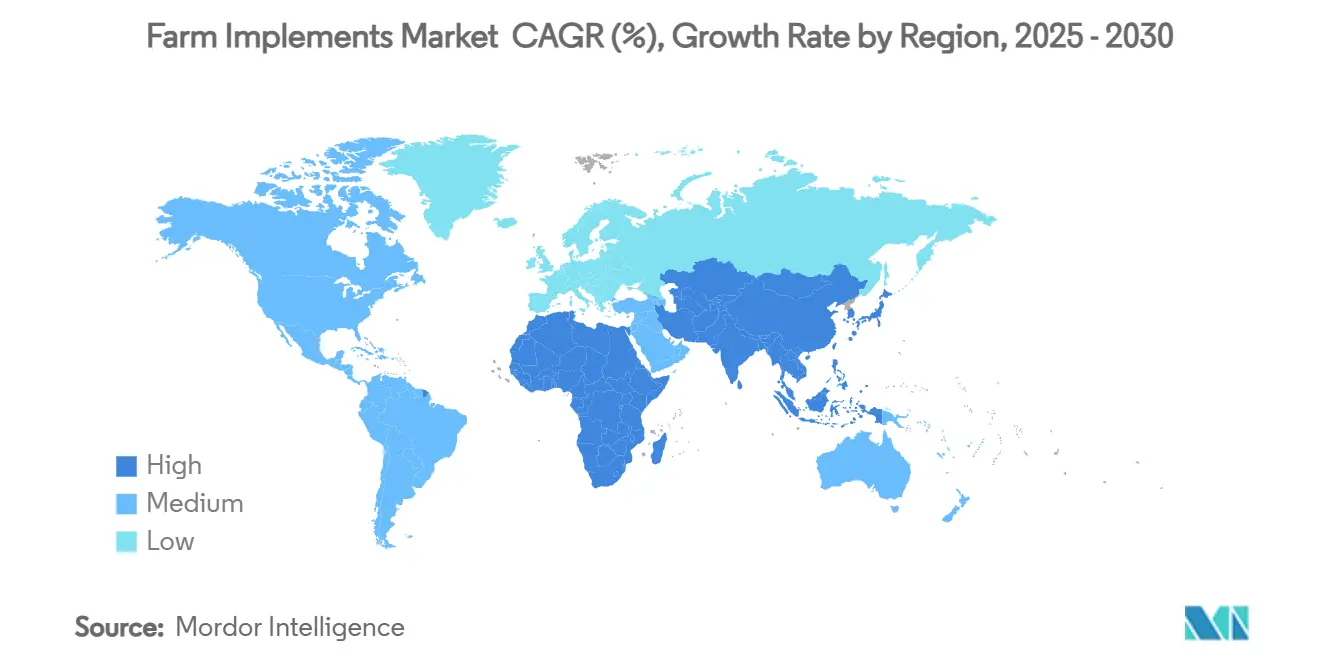
| Fastest Growing Market | Asia Pacific |
| Largest Market | Asia Pacific |
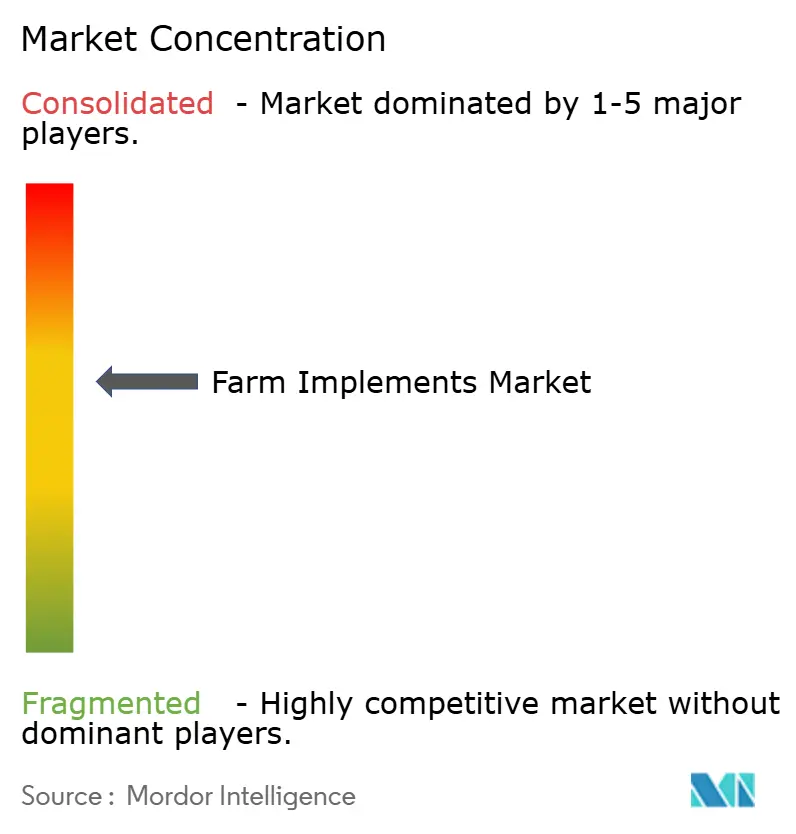
| Market Concentration | Medium |
Major Players
*Disclaimer: Major Players sorted in no particular order Image © Mordor Intelligence. Reuse requires attribution under CC BY 4.0. |
|
Farm Implements Market Analysis by Mordor Intelligence
The farm implements market size is valued at USD 136 billion in 2025 and is forecast to reach USD 177.75 billion by 2030, posting a 5.5% CAGR over the period. This solid expansion reflects brisk replacement demand, policy-driven mechanization, and fast-maturing digital farming solutions that cushion the sector against cyclical commodity swings. Farmers confronting chronic labor shortages are turning to automation in every power class, while subsidy schemes in India and China shorten the payback period for first-time buyers. Technology partnerships between machinery builders and software firms are reshaping competitive boundaries, and the used-equipment glut is fueling an upgrade cycle focused on retrofit autonomy rather than complete fleet renewal. Competitive intensity remains elevated, with the market moderately concentrated, favoring established players who leverage technology integration and strategic partnerships to maintain positioning. Finally, escalating sustainability rules in Europe and California are accelerating the shift from diesel-only drivelines to hybrid and electric powertrains.
Key Report Takeaways
- By product type, tractors held 23.4% of the farm implements market share in 2024, whereas precision and autonomous implements are projected to grow at a 12.5% CAGR through 2030.
- By mode of operation, powered implements dominated the farm implements market size with a 78.2% share in 2024, and are slated for a 6.8% CAGR to 2030.
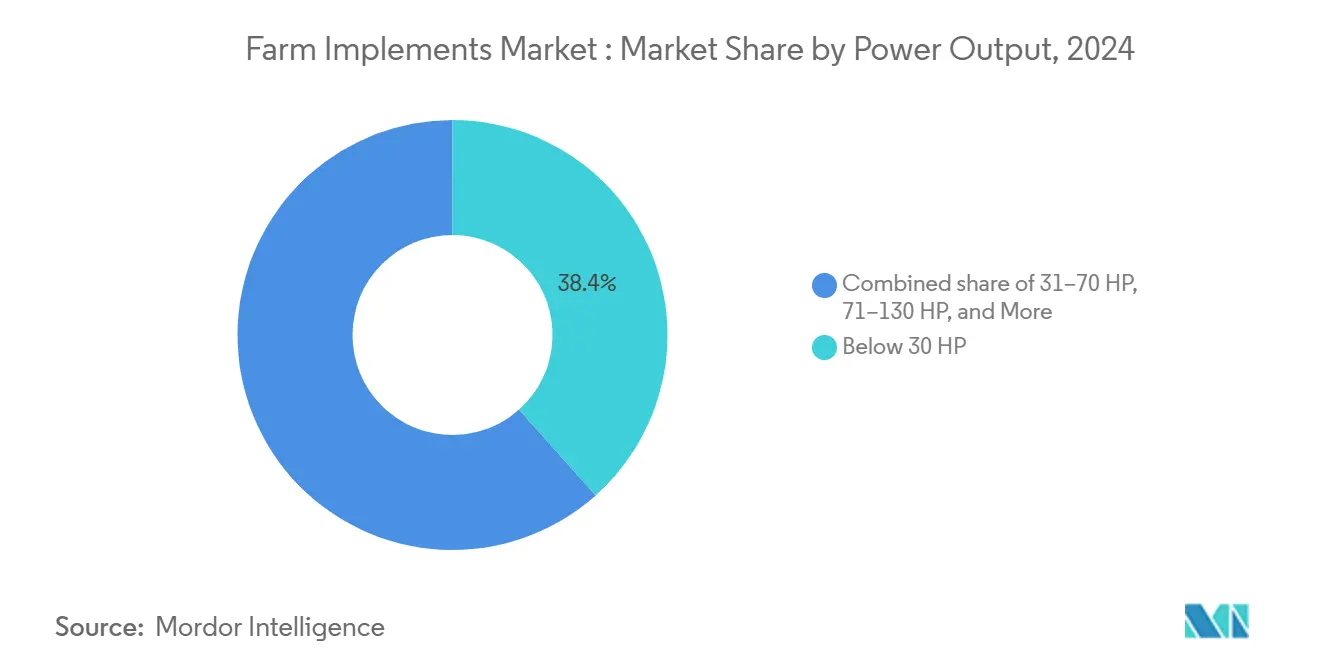
- By power output, the below 30-horsepower class accounted for a 38.4% share in 2024, and equipment above 130 horsepower is forecast to expand at a 7.5% CAGR through 2030.
- By geography, Asia-Pacific contributed a 45% share in 2024 and is forecast to expand at a 7.5% CAGR through 2030.
- The market exhibits moderate consolidation, with key players in 2024 including Deere and Company, CNH Industrial N.V., AGCO Corporation, Kubota Corporation, and Mahindra and Mahindra Ltd.
Global Farm Implements Market Trends and Insights
Drivers Impact Analysis*
| Driver | (~) % Impact on CAGR Forecast | Geographic Relevance | Impact Timeline |
|---|---|---|---|
| Rising labor scarcity in agriculture | +1.2% | Global, acute in North America and Europe | Medium term (2-4 years) |
| Government subsidy programs for mechanization | +0.8% | Asia-Pacific core, expanding to Africa and South America | Short term (≤ 2 years) |
| Growth of medium-horsepower tractors in emerging economies | +0.6% | Asia-Pacific, South America, Sub-Saharan Africa | Long term (≥ 4 years) |
| Expansion of contract farming and rental services | +0.4% | Global, early adoption in Asia-Pacific and Africa | Medium term (2-4 years) |
| Under-canopy robot implements for high-value horticulture | +0.3% | North America, Europe, developed Asia-Pacific | Long term (≥ 4 years) |
| Integration of AI-guided retrofit kits for legacy implements | +0.2% | Global, initial focus in North America and Europe | Medium term (2-4 years) |
| Source: Mordor Intelligence | |||
Rising Labor Scarcity in Agriculture
Universities and start-ups are piloting robotic weeders for high-value horticulture, while dairy units deploy autonomous feed pushers to cut headcount [1]Ministry of Agriculture and Farmers Welfare, “Crop Residue Management Scheme,” agricoop.nic.in. The labor gap has therefore become a structural driver that sustains premium pricing for equipment bundles offering even marginal productivity gains. Similar migration outflows in India, Mexico, and Vietnam are straining household farm operations. Tractor guidance, harvest robots, and automated orchard sprayers are now perceived as necessities rather than luxuries because machines can work through the growing season and offset labor cost spikes.
Government Subsidy Programs for Mechanization
Capital support remains a decisive accelerant for first-time buyers. India’s Sub-Mission on Agricultural Mechanization refunds 40-50% of equipment purchase prices, and its Crop Residue Management Scheme pays up to 80% on specialized implements. China tops up mechanization budgets through a scrappage-and-replacement incentive worth up to 20,000 yuan (USD 2,800) per unit [2]Source: Government of China, “Subsidy Policy for Agricultural Machinery,” gov.cn. These grants synchronize with new model launches, allowing smallholders to skip incremental technology stages and adopt precision-ready machinery directly.
Growth of Medium-Horsepower Tractors in Emerging Economies
Medium-horsepower tractors are experiencing robust demand in emerging economies due to their optimal balance of capability and affordability for a wide range of farm sizes. The 31-70 horsepower segment is particularly well-suited for the fragmented land holdings prevalent in the Asia-Pacific and South America regions, where average farm sizes require versatile equipment that can efficiently handle multiple operations. Manufacturers are responding with region-specific designs that emphasize durability and ease of maintenance over advanced features, aligning with local preferences for cost-effective solutions. The segment benefits from government mechanization programs that specifically target mid-range equipment, maximizing farmer accessibility while achieving productivity improvements.
Expansion of Contract Farming and Rental Services
Equipment-sharing networks bridge the utilization gap on holdings too small to justify outright ownership. Hello Tractor connects over 20,000 smallholders with underused machines via a mobile booking platform across Kenya, Nigeria, and Ghana. Investors view these models as asset-light pathways to double-digit returns, and Original Equipment Manufacturers (OEMs) endorse them because higher fleet utilization accelerates parts and service revenue. The collective impact lifts the farm implements market by expanding user penetration rather than cannibalizing sales.
Restraints Impact Analysis*
| Restraint | (~) % Impact on CAGR Forecast | Geographic Relevance | Impact Timeline |
|---|---|---|---|
| High upfront capital cost and interest-rate sensitivity | -1.0% | Global, acute in developing markets | Short term (≤ 2 years) |
| Fragmented land holdings limiting equipment size | -0.6% | Asia-Pacific, Sub-Saharan Africa, parts of South America | Long term (≥ 4 years) |
| Tariff-driven price volatility in steel and electronics | -0.4% | North America and Europe | Medium term (2-4 years) |
| Used-equipment oversupply is pressuring new sales | -0.3% | North America and Europe | Short term (≤ 2 years) |
| Source: Mordor Intelligence | |||
Fragmented Land Holdings Limiting Equipment Size
Average farm plots in India measure barely 1.1 hectares, and many sub-Saharan holdings are even smaller. Such fragmentation prevents operators from attaining the field widths needed to leverage high-capacity combines or 18-row planters. Turn-around inefficiency and transport bottlenecks erode the theoretical productivity edge of large machines, making compact tractors a pragmatic choice. Manufacturers respond with multi-tool carriers and quick-hitch systems that boost versatility without enlarging wheelbases, yet the ceiling on implement size continues to restrain unit value growth in these geographies.
Tariff-Driven Price Volatility in Steel and Electronics
Successive rounds of trade duties on steel plates, precision bearings, and semiconductors feed directly into the bill-of-materials costs for OEMs. United States import duties on steel exceeded 25% in 2024, and retaliatory surcharges on wiring harnesses from China injected additional uncertainty. European buyers are similarly exposed, because new EU carbon border adjustments can add as much as USD 160 per metric ton to imported steel. Tariff headline risk, therefore, acts as a sentiment dampener across the farm implements market.
*Our forecasts treat driver/restraint impacts as directional, not additive. The impact forecasts reflect baseline growth, mix effects, and variable interactions.
Segment Analysis
By Product Type: Tractors Anchor Demand while Precision Implements Accelerate
Tractors generated 23.40% of the farm implements market share in 2024, underscoring their foundational role in global field operations. Demand spans every horsepower category because tractors remain the primary power source for tillage, planting, and transport. Over the forecast period, guidance-ready mid-horsepower models are projected to replace basic mechanical variants across India and Brazil, sustained by subsidy programs and local credit lines.
Precision and autonomous implements, although still a niche market, are projected to experience a 12.50% CAGR through 2030. Sensor-equipped sprayers that execute sub-inch overlap control reduce chemical bills by up to 20%, a payback that appeals even in price-sensitive markets. Companies such as Deere and Company have announced Model Year 2026 autonomy kits that convert conventional tractors into driverless platforms. The integration of precision agriculture across all product categories is creating convergence opportunities, where traditional implement manufacturers are incorporating sensors, GPS guidance, and data analytics capabilities to enhance operational efficiency and reduce input costs.


By Mode of Operation: Powered Implements Dominate as Electrification Emerges
Powered implements command 78.20% share of the overall farm implements market size in 2024, reflecting the industry's evolution toward self-contained systems that reduce dependency on tractor power take-off systems. This segment is forecasted to experience a 6.80% CAGR from 2025 to 2030, driven by the integration of electric and hybrid power systems that enhance operational flexibility and reduce emissions. Integrated diesel-electric drivetrains deliver torque curves optimized for variable field loads and already comply with stringent Tier 4 emissions limits.
Unpowered implements still serve as loaders, cultivators, and basic planting tools, where simplicity and low maintenance trump sophistication. Yet retrofit kits now embed ISOBUS controllers and GPS receivers even on mechanical seeders, blurring traditional lines. As component prices drop, analysts foresee hybrid solutions where drawbar implements host-independent battery packs to power actuators, allowing smaller tractors to tow larger functional loads without upgrading the primary power unit.
By Power Output: Below 30 Horsepower Holds the Lion’s Share, while High-Power Classes Gain Speed
The below 30-horsepower segment maintains the largest market share at 38.40% in 2024, reflecting the predominance of small-scale farming operations globally and the versatility requirements of diverse agricultural tasks. This segment particularly dominates in Asia-Pacific markets, where fragmented land holdings and diverse cropping patterns favor compact, maneuverable equipment. The 31-70 horsepower segment serves as the workhorse category for medium-scale farming operations, particularly in emerging markets where government mechanization programs target this power range for optimal farmer accessibility.
Above 130 horsepower, machines catering to large row-crop enterprises are forecast to register a 7.50% CAGR toward 2030. Consolidation of land holdings in the United States and Ukraine enables operators to capture economies of scale by pairing these tractors with planters that are wider than 24 rows. Furthermore, autonomy pilots on articulated four-track tractors demonstrate labor savings that significantly exceed the incremental machine cost, propelling buyer interest despite economic uncertainties.
Geography Analysis
Asia-Pacific remains the gravitational center, dominating the farm implements market with a 45% revenue share in 2024. China reports a 74% mechanization rate for crop planting and harvesting, with wheat already exceeding 98%, numbers backed by more than 2.2 million BeiDou navigation terminals installed on farm machines [3]Source: People’s Daily Online, “China’s Mechanization Milestones,” people.cn. Governments favor mechanization both to raise yields and to curb residue burning, thereby multiplying equipment demand across power classes.
Asia-Pacific shows the highest growth potential with a 7.5% CAGR in the farm implements market. North America illustrates a mature yet dynamic profile. The USDA notes that 68% of large crop farms now deploy precision technology, and 70% run guidance autosteering systems [4]Source: USDA Economic Research Service, “Adoption of Precision Agriculture in the United States,” ers.usda.gov. Tariff friction on steel and chips has forced OEMs to rewire supply chains, but high commodity prices keep replacement demand steady. Strong secondary-market liquidity encourages retrofit investments, and robotics start-ups frequently select Midwest fields as launch pads for commercial pilots.
Europe prioritizes sustainability. New EU regulations effective January 2027 stipulate cybersecurity, functional safety, and AI compliance for self-propelled implements. Lastly, the Middle East and Africa are expanding through public-private agritech funds, such as the UAE’s USD 100 million venture allocation and Senegal’s National Programme for Community Agricultural Estates (PRODAC) mechanization scheme, signaling fresh downstream demand for compact, multipurpose tractors.

Competitive Landscape
John Deere maintains pole position with a high share of the North American large-tractor market, and the market remains moderately consolidated, with CNH Industrial N.V., AGCO Corporation, Kubota Corporation, and Mahindra and Mahindra Ltd. Its strategic emphasis centers on autonomous functionality, evidenced by CES 2025 launches of the driverless 9RX row-crop tractor and 5ML orchard model. In September 2023, AGCO adopted a partnership path, acquiring 85% of Trimble Ag for USD 2 billion to accelerate the development of autonomous retrofit solutions, while divesting its Grain and Protein unit for USD 700 million to focus capital on core machinery.
Smaller innovators fill whitespace niches. Kverneland’s agreement with Bayer links FieldView agronomic data directly with smart implements, allowing variable-rate nitrogen side-dress runs from a single in-cab interface. Burro, a robotics start-up, surpasses 400,000 autonomous field hours and licenses its perception algorithms to several sprayer OEMs. Competitive differentiation now rests less on drivetrain horsepower and more on data interoperability, edge computing, and circular revenue via software subscriptions.
The overall setting translates into a moderately concentrated structure where the top five vendors control just over 55% of global revenue, a level that encourages both aggressive R&D spend and selective alliances. Intellectual-property barriers around autonomy algorithms and sensor fusion reinforce incumbents, yet open Application Programming Interface (API) strategies lower entry hurdles for niche specialists, ensuring vigorous rivalry throughout the forecast horizon.
Farm Implements Industry Leaders
-
Deere and Company
-
CNH Industrial N.V.
-
AGCO Corporation
-
Kubota Corporation
-
Mahindra and Mahindra Ltd.
- *Disclaimer: Major Players sorted in no particular order

Recent Industry Developments
- February 2025: AGCO Corporation and SDF have entered a supply agreement to strengthen AGCO's Massey Ferguson brand in the low- to mid-horsepower tractor segment, with production of tractors up to 85 horsepower set to begin in mid-2025. This partnership leverages the expertise of both companies to improve customer satisfaction and drive profitable growth.
- February 2025: Deere and Company detailed Model Year 2026 updates, including significant enhancements across agricultural machinery, featuring autonomy, Precision Upgrades kits for tillage, new combine improvements with Harvest Settings Automation, and sprayer updates with See and Spray variable rate capabilities.
- January 2025: Deere and Company unveiled new autonomous machines at CES 2025, including the Autonomous 9RX Tractor for large-scale agriculture, the Autonomous 5ML Orchard Tractor for air blast spraying, and the 460 P-Tier Autonomous Articulated Dump Truck for quarry operations.


Global Farm Implements Market Report Scope
| Tractors |
| Harvesters |
| Soil Preparation and Cultivation Equipment |
| Planting, Seeding, and Fertilizing Equipment |
| Irrigation and Crop-Protection Implements |
| Precision and Autonomous Implements |
| Haying and Forage Equipment |
| Other Implements |
| Powered Implements |
| Unpowered Implements |
| Below 30 HP |
| 31-70 HP |
| 71-130 HP |
| Above 130 HP |
| North America | United States |
| Canada | |
| Rest of North America | |
| South America | Brazil |
| Argentina | |
| Rest of South America | |
| Europe | Germany |
| France | |
| United Kingdom | |
| Russia | |
| Rest of Europe | |
| Asia-Pacific | China |
| India | |
| Japan | |
| Australia | |
| Rest of Asia-Pacific | |
| Middle East | Saudi Arabia |
| Turkey | |
| Rest of Middle East | |
| Africa | South Africa |
| Nigeria | |
| Rest of Africa |
| By Product Type | Tractors | |
| Harvesters | ||
| Soil Preparation and Cultivation Equipment | ||
| Planting, Seeding, and Fertilizing Equipment | ||
| Irrigation and Crop-Protection Implements | ||
| Precision and Autonomous Implements | ||
| Haying and Forage Equipment | ||
| Other Implements | ||
| By Mode of Operation | Powered Implements | |
| Unpowered Implements | ||
| By Power Output | Below 30 HP | |
| 31-70 HP | ||
| 71-130 HP | ||
| Above 130 HP | ||
| By Geography | North America | United States |
| Canada | ||
| Rest of North America | ||
| South America | Brazil | |
| Argentina | ||
| Rest of South America | ||
| Europe | Germany | |
| France | ||
| United Kingdom | ||
| Russia | ||
| Rest of Europe | ||
| Asia-Pacific | China | |
| India | ||
| Japan | ||
| Australia | ||
| Rest of Asia-Pacific | ||
| Middle East | Saudi Arabia | |
| Turkey | ||
| Rest of Middle East | ||
| Africa | South Africa | |
| Nigeria | ||
| Rest of Africa | ||


Key Questions Answered in the Report
What is the current value of the agricultural equipment market?
The agricultural equipment market stands at USD 136 billion in 2025.
How fast is the agricultural equipment market expected to grow?
It is set to expand at a 5.5% CAGR between 2025 and 2030.
Which product category leads the agricultural equipment market?
Tractors lead with 23.40% market share in 2024.
What technology trends will shape equipment demand through 2030?
Retrofit autonomy, precision spraying, and electric or hybrid drivetrains will dominate investment decisions as labor costs climb and emissions rules tighten.
How concentrated is supplier power in the sector?
The top five manufacturers account for a little over half of total revenue, indicating a moderately concentrated but still competitive landscape.
Page last updated on:


