Indoor Farming Market Size and Share
Market Overview
| Study Period | 2021 - 2031 |
|---|---|
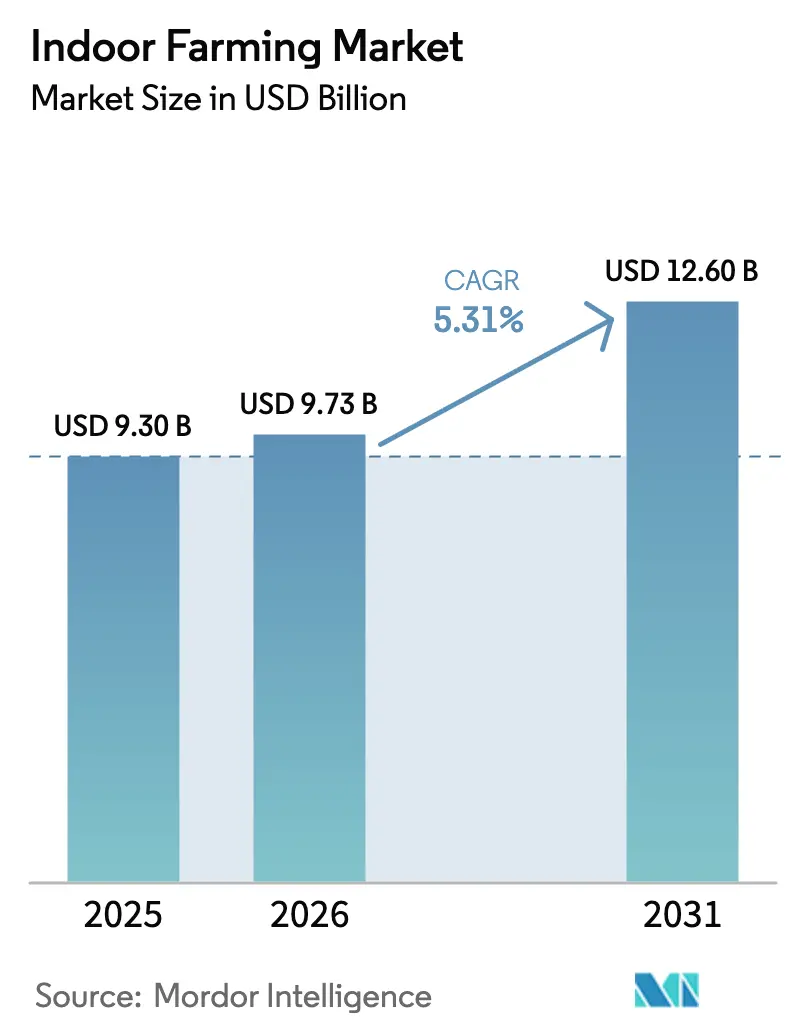
| Market Size (2026) | USD 9.73 Billion |
| Market Size (2031) | USD 12.60 Billion |
| Growth Rate (2026 - 2031) | 5.31% CAGR |
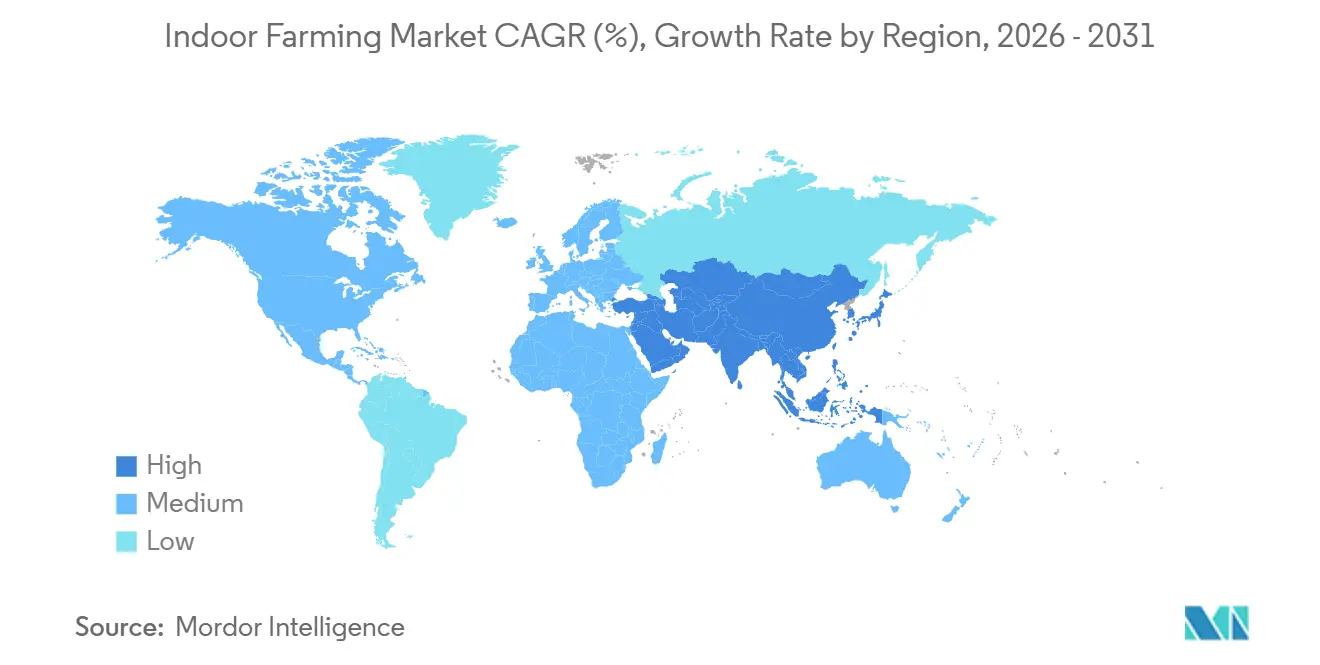
| Fastest Growing Market | Asia-Pacific |
| Largest Market | Europe |
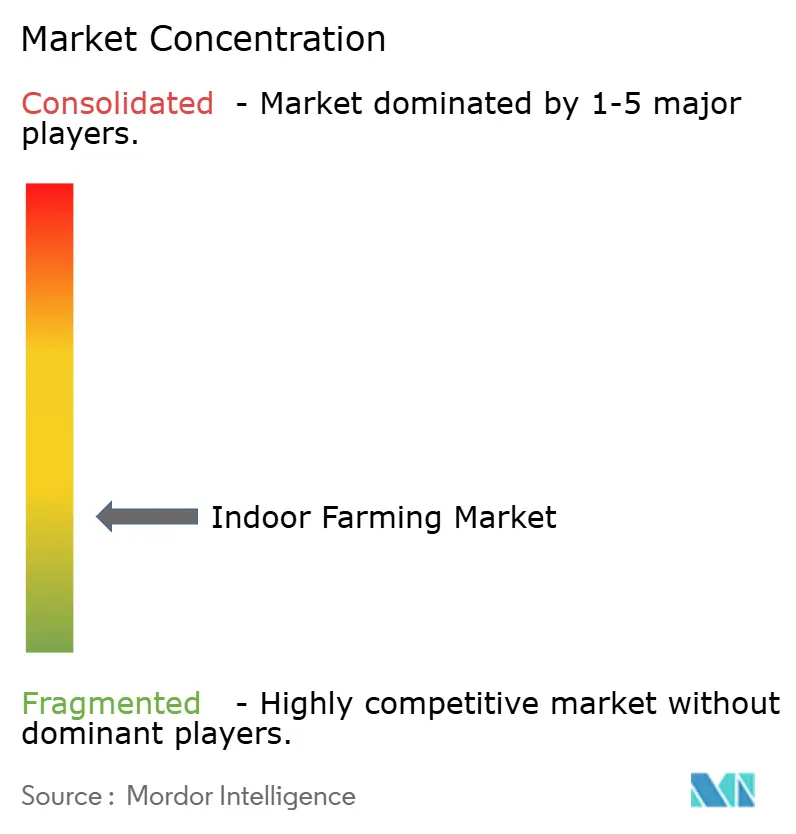
| Market Concentration | Low |
Major Players *Disclaimer: Major Players sorted in no particular order Image © Mordor Intelligence. Reuse requires attribution under CC BY 4.0. | |
Indoor Farming Market Analysis by Mordor Intelligence
The indoor farming market size was valued at USD 9.30 billion in 2025 and is estimated to reach USD 9.73 billion in 2026, further projected to grow to USD 12.60 billion by 2031, advancing at a CAGR of 5.31% during the forecast period (2026–2031). Robust urbanization, tighter food-safety standards, and extreme weather disruptions are pushing retailers and governments toward controlled-environment agriculture. Declines in Light-Emitting Diode (LED) and Heating, Ventilation, and Air Conditioning (HVAC) costs are compressing operating expenditures, while carbon-credit revenues strengthen project economics in regions that monetize low-emission produce. Surplus big-box stores and warehouses offer low-cost footprints, enabling rapid conversion to multi-tier farms that shorten last-mile delivery and reduce spoilage. Technology partnerships between equipment vendors and growers are accelerating the rollout of automation and establishing performance benchmarks across various geographies. Early adopters are expanding their product mix beyond leafy greens to include strawberries and vine tomatoes as yield algorithms improve and premium price points remain stable.
Key Report Takeaways
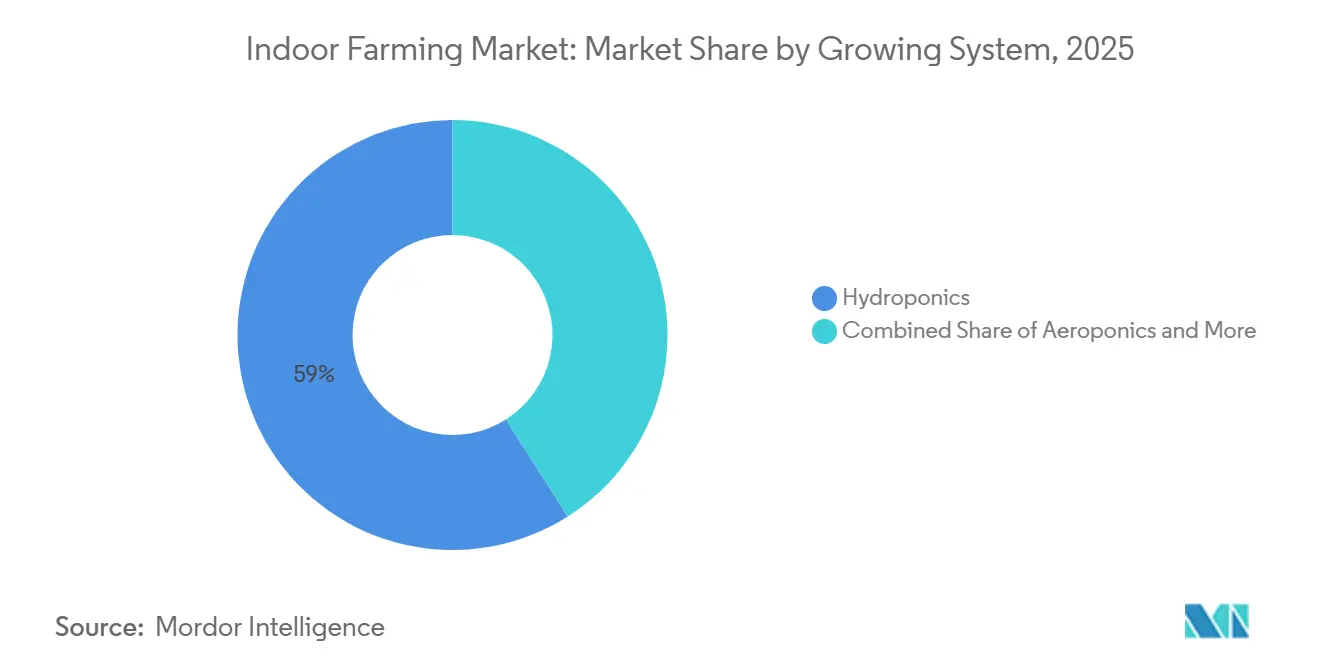
- By growing system, hydroponics commanded a 59.0% share of the indoor farming market in 2025, while aeroponics is forecast to accelerate at a 15.0% CAGR to 2031.
- By facility type, glass or poly greenhouses captured 53.1% of the indoor farming market share in 2025, and container farms are on track for a 14.0% CAGR through 2031.
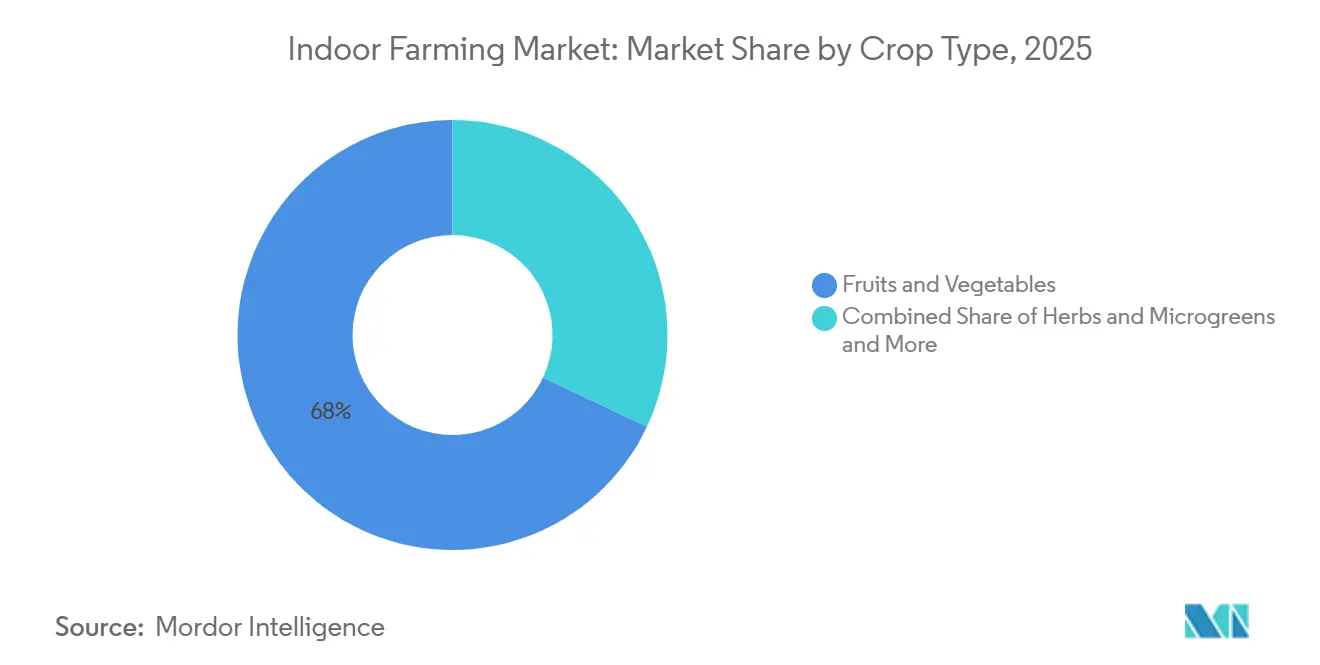
- By crop type, fruits and vegetables accounted for 68.0% of the indoor farming market size in 2025, whereas herbs and microgreens are poised for a 13.0% CAGR through 2031.
- By region, Europe led the indoor farming market with a 33.9% share in 2025, whereas the Asia-Pacific region is projected to post the highest CAGR of 9.0% through 2031.
Note: Market size and forecast figures in this report are generated using Mordor Intelligence’s proprietary estimation framework, updated with the latest available data and insights as of January 2026.
Global Indoor Farming Market Trends and Insights
Drivers Impact Analysis*
| Driver | (~) % Impact on CAGR Forecast | Geographic Relevance | Impact Timeline |
|---|---|---|---|
| Urban demand for fresh, pesticide-free produce | +4.8% | Global, with peaks in North America and Europe | Medium term (2-4 years) |
| Light-Emitting Diode (LED) efficiency and Heating, Ventilation, and Air Conditioning (HVAC) cost declines | +5.2% | Global, strongest in Asia-Pacific and the Middle East | Long term (≥ 4 years) |
| Shrinking arable land and extreme weather volatility | +4.5% | Global, acute in the Middle East, Asia-Pacific, and North Africa | Long term (≥ 4 years) |
| Year-round production ensuring resilient supply chains | +3.8% | North America, Europe, and the Asia-Pacific | Medium term (2-4 years) |
| Surplus vacant retail/warehouse real estate repurposed | +2.9% | North America and Europe, emerging in urban Asia | Short term (≤ 2 years) |
| Carbon-credit monetization for low-footprint produce | +2.3% | Europe and North America, pilot programs in Asia | Medium term (2-4 years) |
| Source: Mordor Intelligence | |||
Urban Demand for Fresh, Pesticide-Free Produce
Health-conscious consumers in metropolitan areas are willing to pay 20% to 30% premiums for locally grown, pesticide-free greens. This creates a price advantage that indoor farms leverage to offset higher production costs. Retailers such as Whole Foods and Kroger secured multi-year supply agreements with Gotham Greens and BrightFarms in 2024, ensuring shelf space and volume commitments, which help reduce demand uncertainty[1]Source: U.S. Department of Agriculture, “Local Food Promotion Program,” ams.usda.gov . This trend is further driven by food-safety recalls linked to field-grown lettuce contaminated with E. coli and Listeria, eroding consumer confidence in conventional supply chains. Urban proximity reduces last-mile logistics costs by 40% to 50%, enabling same-day delivery models required by meal-kit services like HelloFresh and Blue Apron. Additionally, the USDA's Local Food Promotion Program allocated USD 50 million in 2025 to support urban agriculture infrastructure, including grants for controlled-environment facilities adhering to Good Agricultural Practices certification standards.
Light-Emitting Diode (LED) Efficiency and Heating, Ventilation, and Air Conditioning (HVAC) Cost Declines
LED fixture efficacy surpassed 3.0 micromoles per joule in 2025, marking a 25% improvement over 2020 levels and reducing electricity consumption per kilogram of lettuce by approximately 18%. Manufacturers such as Signify and Osram introduced tunable spectrum systems in 2024, optimizing photosynthetic efficiency across various growth stages and minimizing energy waste during vegetative and flowering phases. Innovations in Heating, Ventilation, and Air Conditioning (HVAC), including desiccant dehumidifiers and heat-recovery ventilation, reduced climate-control costs by 15% to 20% in 2025. These advancements have made year-round production economically viable in hot climates such as the UAE and Saudi Arabia. The International Energy Agency projects that solid-state lighting efficiency will reach 3.5 micromoles per joule by 2027, further narrowing the energy-intensity gap between indoor and field agriculture.
Shrinking Arable Land and Extreme Weather Volatility
Global arable land per capita declined from 0.22 hectares in 2000 to 0.19 hectares in 2024, according to the Food and Agriculture Organization, intensifying competition for productive soil and reducing the viability of marginal farmland. Extreme weather events disrupted 12% of global vegetable harvests in 2024, according to the World Meteorological Organization, resulting in supply shortages and a 30% to 50% increase in wholesale prices in affected regions. In response, Singapore's government mandated that 30% of nutritional needs be met domestically by 2030, allocating SGD 144 million (USD 107 million) in 2024 to subsidize vertical farms and rooftop greenhouses, reducing reliance on imports. Similarly, Japan's Ministry of Agriculture, Forestry, and Fisheries expanded its plant-factory subsidy program in 2025, covering up to 50% of capital costs for facilities adopting energy-efficient technologies and disaster-resilient designs.
Year-Round Production Ensuring Resilient Supply Chains
In response to the seasonal supply gaps and transportation bottlenecks highlighted during the 2020–2021 pandemic, retailers and food-service operators are diversifying their sourcing strategies. Indoor farms, unaffected by weather fluctuations, ensure consistent production volumes. This reliability allows grocers to trim safety stock buffers, cut down on spoilage, and liberate working capital. By entering multi-year supply agreements with indoor growers, retailers can adhere to weekly replenishment schedules across their regional networks. This strategy has led to a notable 60% reduction in out-of-stock incidents when compared to sourcing from traditional fields. Such dependable supply chains empower retailers to enhance inventory turnover and fine-tune labor scheduling, culminating in a 10% to 15% dip in overall supply-chain costs. The United States Department of Agriculture’s Agricultural Marketing Service notes that during winter, as field production wanes in key growing regions, controlled-environment produce fetches premium wholesale prices. This seasonal price surge not only presents a lucrative margin opportunity for indoor operators but also shortens the payback periods on their capital investments.
Restraints Impact Analysis*
| Restraint | (~) % Impact on CAGR Forecast | Geographic Relevance | Impact Timeline |
|---|---|---|---|
| High CAPEX and energy intensity | −6.2% | Global, acute in high-cost electricity markets | Long term (≥ 4 years) |
| Scarcity of skilled horticultural workforce | −3.8% | Global, severe in North America and Europe | Medium term (2-4 years) |
| Venture Capital funding pull-back after high-profile bankruptcies | −2.7% | North America and Europe | Short term (≤ 2 years) |
| Urban grid-congestion and power-availability limits | −2.1% | Dense metros in North America, Asia-Pacific, and Europe | Medium term (2-4 years) |
| Source: Mordor Intelligence | |||
High CAPEX and Energy Intensity
The initial capital investment for a 1-acre vertical farm ranges between USD 10 million and USD 25 million, depending on the level of automation and climate-control requirements. This high cost creates a significant entry barrier, restricting participation to well-funded entities or those with access to subsidized financing. Energy expenses constitute 25% to 35% of operating costs, with facilities in regions such as California and Germany, where electricity costs are high, facing break-even periods exceeding seven years, which discourages investment. The bankruptcy of AppHarvest in 2023, caused by cost overruns and lower yields, further alarmed lenders and equity investors, leading to tighter credit availability for new projects in 2024 and 2025. In 2025, the United States Department of Energy's Better Buildings Initiative allocated USD 30 million in grants to pilot energy-storage systems aimed at shifting power consumption to off-peak hours, reducing demand charges by 20% to 30%. Adoption has been limited to facilities with adequate roof space or adjacent land for battery installations.
Scarcity of Skilled Horticultural Workforce
Controlled-environment agriculture requires specialized knowledge in plant physiology, nutrient management, and climate-system calibration skills that traditional field workers often lack and that universities have been slow to incorporate into their large-scale training programs. In 2025, labor costs for trained horticulturalists in the United States averaged between USD 55,000 and USD 75,000 annually, which is 30% to 40% higher than wages for general agricultural labor, thereby compressing margins for smaller operators. Automation providers, such as Iron Ox and 80 Acres Farms, introduced robotic transplanting and harvesting systems in 2024 and 2025, reducing labor requirements by 50% to 60%. These systems involve upfront costs ranging from USD 2 million to USD 5 million and require specialized maintenance, which is only performed by a limited number of qualified technicians[2]Source: U.S. Department of Agriculture, “National Institute of Food and Agriculture Workforce Programs,” nifa.usda.gov .
*Our forecasts treat driver/restraint impacts as directional, not additive. The impact forecasts reflect baseline growth, mix effects, and variable interactions.
Segment Analysis
By Growing System: Water Efficiency Drives Aeroponics Surge
Hydroponics commanded a 59.0% share of the indoor farming market size in 2025, supported by decades of agronomic research and a well-established supplier network for pumps, reservoirs, and nutrient solutions. According to AeroFarms' 2024 sustainability disclosure, aeroponic systems use 95% less water than soil-based methods and 40% less than hydroponics, a significant advantage in regions like the Middle East, where desalinated water costs range from USD 1.50 to USD 2.00 per cubic meter[3]Source: AeroFarms, “Sustainability Report 2025,” aerofarms.com. Crop economics rather than technical preferences increasingly influence the selection of growing systems. For instance, leafy greens, which require shallow root zones and rapid turnover, are well-suited to nutrient-film techniques. Conversely, high-margin crops like berries justify the complexity of aeroponics, as enhanced airflow improves fruit firmness and color, enabling premium pricing.
Aeroponics is forecast to accelerate at a 15.0% CAGR to 2031, the highest growth rate among indoor farming systems, driven by the need to conserve water in drought-prone areas and to accelerate crop cycles by delivering nutrients directly to root zones in mist form. Aquaponics, which combines fish farming with vegetable cultivation, remains a niche approach due to regulatory challenges related to aquaculture permits and the requirement for expertise in both horticulture and aquatic biology. Soil-based indoor systems are preferred by organic-certified operations that cannot use synthetic nutrients. These systems require deeper grow beds and longer crop cycles, which reduce throughput.


By Facility Type: Greenhouses Lead While Vertical Farms Gain Momentum
Glass or poly greenhouses accounted for 53.1% of installations in 2025, leveraging their partial reliance on free solar radiation and decades of engineering advancements. Their modular construction reduces capital expenditure per square foot and supports the cultivation of tall crops, such as vine tomatoes and cucumbers. Recent innovations in greenhouse technology include dynamic glass coatings that adjust light transmission, reducing evaporative load while maintaining optimal levels of photosynthetically active radiation. In contrast, vertical farm developers are focusing on heat-recovery chillers and phase-change storage systems to reduce peak electricity consumption. Energy management software integrates lighting cycles with HVAC (Heating, Ventilation, and Air Conditioning) systems, achieving energy savings of up to 25% in next-generation facilities.
Container farms are on track for a 14.0% CAGR through 2031, making them the fastest-growing facility type. Their modular design facilitates rapid deployment in underserved markets and disaster-relief scenarios. Indoor deep-water culture systems, which suspend plant roots in oxygenated, nutrient-rich solutions, are particularly effective for leafy greens but face challenges with fruiting crops that require stronger structural support. Infarm's modular in-store farms, deployed in over 30 European supermarkets by 2025, highlight the trend toward distributed production, which eliminates cold-chain logistics and enables retailers to harvest produce on demand. In India, the urban agriculture sector is experiencing rapid growth. UrbanKisaan plans to deploy 50 container farms across Delhi and Mumbai in 2024 and 2025, targeting middle-class consumers willing to pay a 25% premium for pesticide-free greens.
By Crop Type: Herbs and Microgreens Capture Premium Niches
Fruits and vegetables accounted for 68.0% of the indoor farming market share in 2025, with leafy greens such as lettuce, kale, and arugula leading the segment. These crops are favored due to their ability to tolerate dense planting and their short harvest cycles of 25 to 35 days. In contrast, tomatoes and strawberries, which require longer growth periods and precise pollination, accounted for a smaller market share. These crops command retail prices that are 50% to 80% higher than leafy greens, attracting investments from companies such as Revol Greens and Mucci Farms. In 2025, Gotham Greens increased its tomato production capacity by 40%, utilizing automated pollination drones that enhanced fruit set rates from 70% to 85% and reduced labor costs by USD 0.12 per kilogram.
Herbs and microgreens are poised for a 13.0% CAGR through 2031, surpassing the growth rate of fruits and vegetables. This growth is driven by increasing demand from chefs and home cooks who value the flavor intensity and visual appeal that indoor-grown products offer compared to those grown in the field. Basil, the highest-volume herb, benefits from a 21-day harvest cycle and strong demand from Italian restaurants and pesto manufacturers. Meanwhile, specialty herbs like tarragon and wheatgrass cater to niche markets willing to pay higher per-unit costs. Flowers and ornamentals remain a niche segment within the indoor farming market, primarily concentrated in regions such as Japan and the Netherlands. Consumers in these markets are willing to pay premiums for year-round blooms. This segment faces competition from field-grown imports during peak seasons, which can impact profitability.
Geography Analysis
Europe led the indoor farming market with a 33.9% share in 2025, supported by the Netherlands' advanced cluster of high-tech greenhouses, a skilled workforce in climate control, and carbon-tax incentives that promote low-emission agriculture. German and Spanish retailers are expanding their sourcing contracts to include mid-sized vertical farms, which reduce transportation distances and ensure consistent year-round inventory. While energy price volatility poses a challenge, the presence of widespread district heating networks and the increasing availability of renewable power purchase agreements help mitigate cost risks.
The Asia-Pacific region is projected to post the highest CAGR of 9.0% through 2031, driven by land scarcity and a growing urban middle class demanding safe and traceable produce. In Singapore, government grants and floor-area concessions support rooftop farming initiatives, though challenges remain in balancing capital investment with local demand, as evidenced by several high-profile closures. In China, coastal provinces are developing controlled-environment hubs within new "agri-tech parks," which foster collaboration between universities and venture investors, accelerating the adoption of advanced practices. In Japan, municipal utilities subsidize the use of Light-Emitting Diode (LED) lights to stabilize nighttime grid loads, indirectly reducing production costs.
North America, while a mature market, continues to expand its greenhouse acreage. For instance, BrightFarms' 1.5 million square foot complex in Texas utilizes evaporative cooling to maintain summer leaf temperatures below 77 degrees Fahrenheit, enabling year-round supply contracts with regional grocers. In Mexico, shade-house vegetable production is being scaled for export to border states, leveraging favorable sunlight and lower labor costs. The Middle East is heavily investing in vertical farming projects through sovereign funds, aiming to enhance food security and reduce desalination demands. In Africa, indoor farming is in its early stages, with notable adoption in Kenya and South Africa, where solar-powered container farms address unreliable grid supply. These developments highlight the region's potential for growth in the indoor farming market.
Mordor Intelligence provides coverage of the indoor farming market across other key regional markets, including North America and Europe, each with their regulatory frameworks and demand patterns. Detailed country-level analysis extends to Canada incorporating local coverage and market participation, as required.

Competitive Landscape
The indoor farming market remains fragmented, though consolidation pressures are increasing as several heavily funded entrants have struggled to achieve profitability. By 2025, the five largest operators collectively captured a significant share of the market. Region-specific greenhouse growers continue to dominate commodity categories, while technology-driven vertical farm specialists focus on premium produce. AI-powered climate control has emerged as a critical differentiator, enabling consistent quality and reducing labor dependency in a market where skilled horticulturists are in short supply.
Operational efficiency has become the primary benchmark for success in the indoor farming market. Leading players have implemented real-time cost dashboards to monitor metrics such as kilowatt-hours per kilogram and grams of fertilizer per plant, driving continuous improvement initiatives. Many successful operators are also integrating renewable energy assets or entering indexed power agreements to stabilize energy costs. Strategic partnerships are becoming increasingly common. For instance, Emirates Flight Catering’s acquisition of Bustanica ensures a dedicated supply for in-flight catering while serving as a model for vertical integration.
Opportunities remain strong in high-margin berry varieties and regions that face cold-chain challenges, where traditional logistics systems often underperform. Modularity is gaining traction, with companies offering pre-assembled grow modules that enable capital deployment at twice the speed of bespoke-build competitors. This approach is particularly appealing to retailers repurposing vacant hypermarkets. As investors prioritize sustained EBITDA margins and robust technology advantages over scale alone, the market is shifting toward operators that can demonstrate long-term profitability. These trends are collectively reshaping the indoor farming market, driving stable and efficiency-focused growth.
Indoor Farming Industry Leaders
AeroFarms, Inc.
Plenty Unlimited Inc.
Gotham Greens Holdings LLC
Village Farms International Inc.
Fresca Group (Thanet Earth)
- *Disclaimer: Major Players sorted in no particular order

Recent Industry Developments
- December 2024: Local Bounti Corporation entered a two-year contract to supply living butter lettuce to 13 distribution centers of a multinational retailer. This agreement is projected to enhance the company's distribution network and strengthen its presence in the market by ensuring a steady supply of fresh produce to a wider customer base.
- December 2024: BrightFarms opened a 1.5 million ft² greenhouse in Texas equipped with advanced cooling systems, enabling year-round production of fresh produce and meeting growing consumer demand for locally sourced vegetables.
- February 2024: Emirates Flight Catering has completed the acquisition of Bustanica, securing full ownership of the world’s largest indoor vertical farm. This acquisition aligns with the company’s strategy to enhance its sustainable food production capabilities and reduce its environmental footprint.


Research Methodology Framework and Report Scope
Market Definitions and Key Coverage
Our study defines the indoor farming market as the value of crops grown entirely inside purpose-built, fully enclosed facilities where light, temperature, humidity, and nutrients are actively managed, including glass or poly greenhouses, multi-tier vertical farms, container units, and indoor deep-water culture systems. Hydroponic, aeroponic, aquaponic, soil-based, and hybrid production methods are covered at farm-gate prices.
Scope exclusion: open-field, high-tunnel, or shade-house cultivation and any livestock operations are outside the study.
Segmentation Overview
- By Growing System
- Aeroponics
- Hydroponics
- Aquaponics
- Soil-based
- Hybrid
- By Facility Type
- Glass or Poly Greenhouses
- Indoor Vertical Farms
- Container Farms
- Indoor Deep-Water Culture Systems
- Other Facility Types
- By Crop Type
- Fruits and Vegetables
- Leafy Vegetables
- Tomato
- Strawberry
- Eggplant
- Other Fruits and Vegetables
- Herbs and Microgreens
- Basil
- Tarragon
- Wheatgrass
- Other Herbs and Microgreens
- Flowers and Ornamentals
- Perennials
- Annuals
- Ornamentals
- Other Flowers and Ornamentals
- Other Crop Types
- Fruits and Vegetables
- By Geography
- North America
- United States
- Canada
- Mexico
- Rest of North America
- Europe
- Germany
- United Kingdom
- France
- Spain
- Italy
- Russia
- Rest of Europe
- Asia-Pacific
- China
- Japan
- India
- Australia
- Singapore
- South Korea
- Rest of Asia-Pacific
- Middle East
- Saudi Arabia
- United Arab Emirates
- Turkey
- Rest of Middle East
- Africa
- South Africa
- Kenya
- Nigeria
- Rest of Africa
- North America
Detailed Research Methodology and Data Validation
Primary Research
We spoke with commercial growers, controlled-environment engineers, LED manufacturers, nutrient-solution formulators, and fresh-produce distributors across North America, Europe, and Asia-Pacific. Their input on realistic yield ceilings, typical ex-farm selling prices, and planned capacity helped us reconcile secondary patterns and stress-test assumptive ranges.
Desk Research
Mordor analysts gathered baseline figures from tier-one public sources such as FAO FAOSTAT, USDA NASS, Eurostat crop spatial data, and World Bank urbanization series, then cross-checked them with customs codes for greenhouse produce. Patents accessed through Questel, electricity-tariff tables from the IEA, and trade-association releases (e.g., Association for Vertical Farming) refined technology adoption curves. Company 10-Ks, investor decks, and funding databases on D&B Hoovers, plus news hits on Dow Jones Factiva, filled recent volume and price gaps. The sources cited illustrate breadth; many additional references informed validation and context.
Market-Sizing & Forecasting
A top-down reconstruction begins with region-level controlled-environment acreage, multiplies it by crop-specific yield factors, and applies weighted average selling prices, producing a baseline value. Selective bottom-up checks, such as sampled LED shipment audits, greenhouse acreage rolls, and container-farm unit counts, validate and fine-tune totals. Key model drivers include LED cost trajectories, urban fresh-produce demand growth, electricity tariffs, greenhouse capacity additions, and per capita salad consumption. Multivariate regression, backed by scenario analysis for sharp energy swings, extends the view through the forecast period.
Data Validation & Update Cycle
Outputs undergo peer review, anomaly flags trigger re-contact with sources, and large variances are re-modeled before sign-off. Reports refresh each year, with interim updates when policy shifts or major investments materially change the baseline.
Why our Indoor Farming Baseline earns trust
Published estimates seldom align because providers vary scope, pricing assumptions, and refresh cadence.
Differences widen when some focus on technology spend while others bundle every crop revenue stream.
Benchmark comparison
| Market Size | Anonymized source | Primary gap driver |
|---|---|---|
| USD 40.80 bn (2025) | Mordor Intelligence | - |
| USD 42.08 bn (2024) | Regional Consultancy A | Adds equipment sales to crop revenue, inflating base |
| USD 20.30 bn (2023) | Global Consultancy B | Limits scope to technology outlay, omits produce value |
| USD 22.30 bn (2024) | Industry Analyst C | Excludes glass greenhouses, relies on small Asia sample |
The comparison shows that our disciplined scope selection, blended model logic, and annual refresh provide decision-makers with the most balanced, transparent baseline available.


Key Questions Answered in the Report
How large is the indoor farming market expected to be in 2031?
The indoor farming market is projected to reach USD 12.60 billion by 2031, growing at a compound annual growth rate (CAGR) of 5.31% from USD 9.73 billion in 2026.
Which growing system is expanding the fastest?
Aeroponics is forecast to grow at 15.0% annually through 2031 due to superior water efficiency and accelerated crop cycles.
What are the main cost pressures operators face?
High upfront capital and energy expenditures, combined with a shortage of skilled horticultural labor, weigh on profitability and slow expansion.
Which region offers the highest growth potential in the indoor farming market?
Asia-Pacific offers the highest growth potential, registering a CAGR of 9.0% through 2031, driven by government food security initiatives and capital subsidy programs.
Page last updated on:


