Market Overview
| Study Period | 2021 - 2031 |
|---|---|
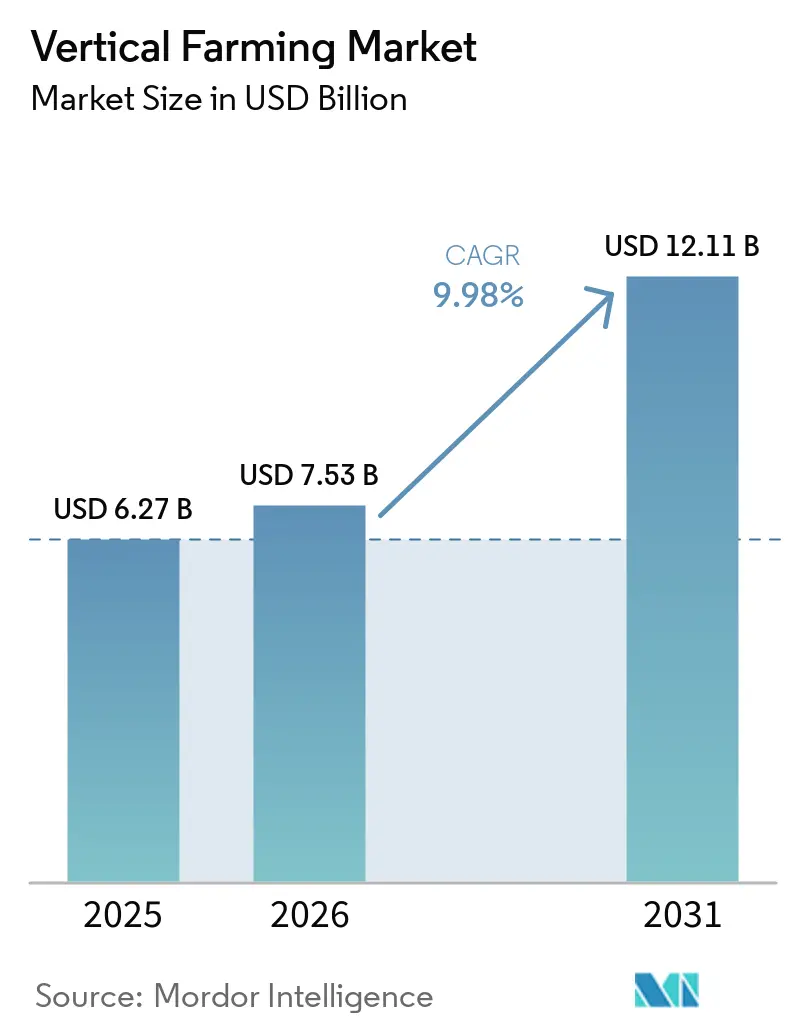
| Market Size (2026) | USD 7.53 Billion |
| Market Size (2031) | USD 12.11 Billion |
| Growth Rate (2026 - 2031) | 9.98% CAGR |
| Fastest Growing Market | Asia Pacific |
| Largest Market | North America |
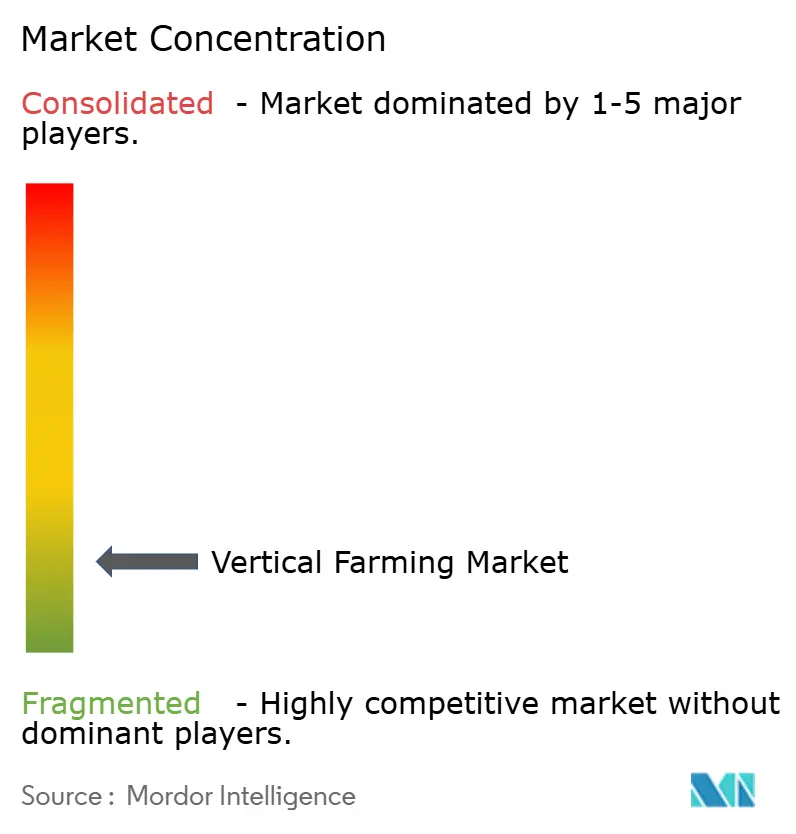
| Market Concentration | Low |
Major Players *Disclaimer: Major Players sorted in no particular order Image © Mordor Intelligence. Reuse requires attribution under CC BY 4.0. | |
Vertical Farming Market Analysis by Mordor Intelligence
The vertical farming market size was valued at USD 6.27 billion in 2025 and estimated to grow from USD 7.53 billion in 2026 to reach USD 12.11 billion by 2031, at a CAGR of 9.98% during the forecast period (2026-2031). The vertical farming market is moving deeper into controlled-environment food production as climate volatility, urban food safety expectations, and maturing light-emitting diode (LED) and robotics systems reshape commercial growing models. The vertical farming market is also benefiting from a shift in public food security policy, especially in Asia-Pacific and the Middle East, where indoor farming is increasingly treated as a resilience asset rather than a discretionary agriculture technology project. The vertical farming market has become more selective following the closures and restructurings in 2024 and 2025, pushing capital toward operators with retailer links, institutional backing, and greater control over operating economics. The vertical farming market is now being assessed less by headline expansion and more by unit profitability, energy efficiency, and the ability to combine crop revenue with environmental, social, and governance (ESG) premiums, carbon-accounting benefits, and public co-investment support. The vertical farming market, therefore, enters 2026 with a different operating base than the earlier venture-led cycle, with scale still important but disciplined deployment and supply certainty carrying more weight.
Key Report Takeaways
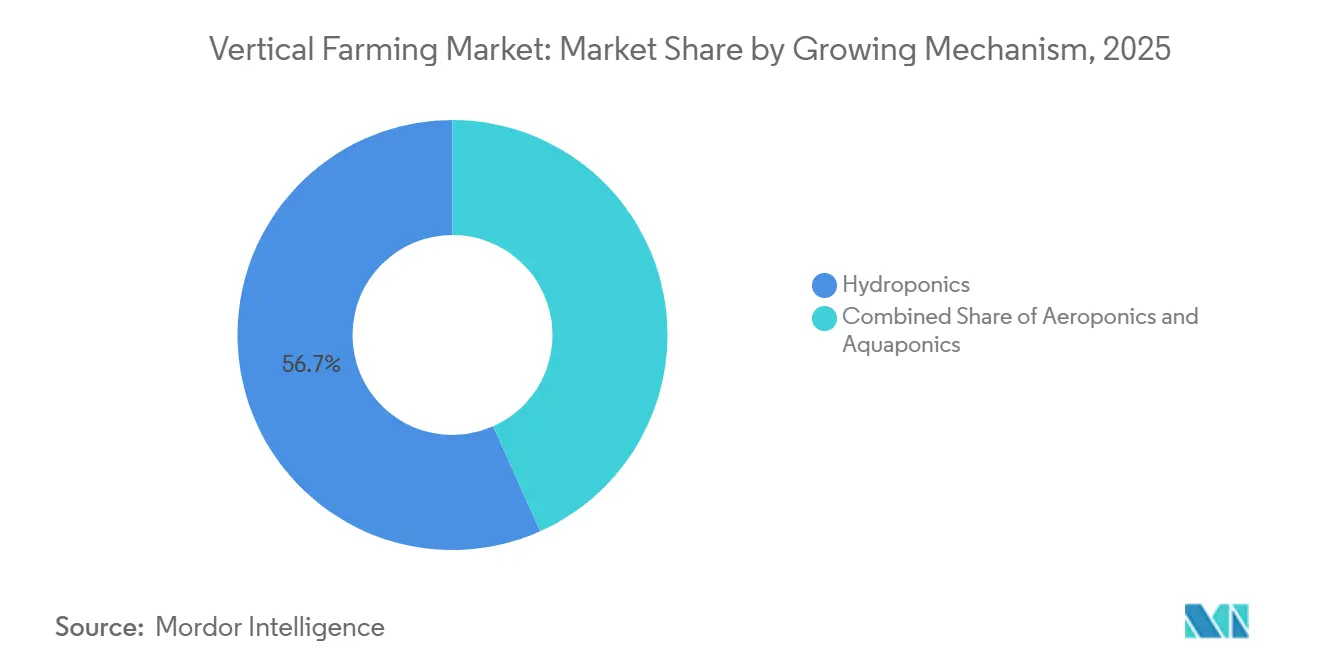
- By growing mechanism, hydroponics held 56.7% of the vertical farming market share in 2025, while aeroponics is projected to be the fastest-growing segment, with a 13.1% CAGR during 2026-2031.
- By farm structure, building-based farms accounted for 72.4% of the vertical farming market in 2025, while shipping-container-based farms are the fastest-growing segment, anticipated to grow at a 12.3% CAGR during 2026-2031.
- By component, lighting systems captured 34.3% of the vertical farming market in 2025, while software and control platforms are the fastest-growing segment, with a projected CAGR of 13.8% during 2026-2031.
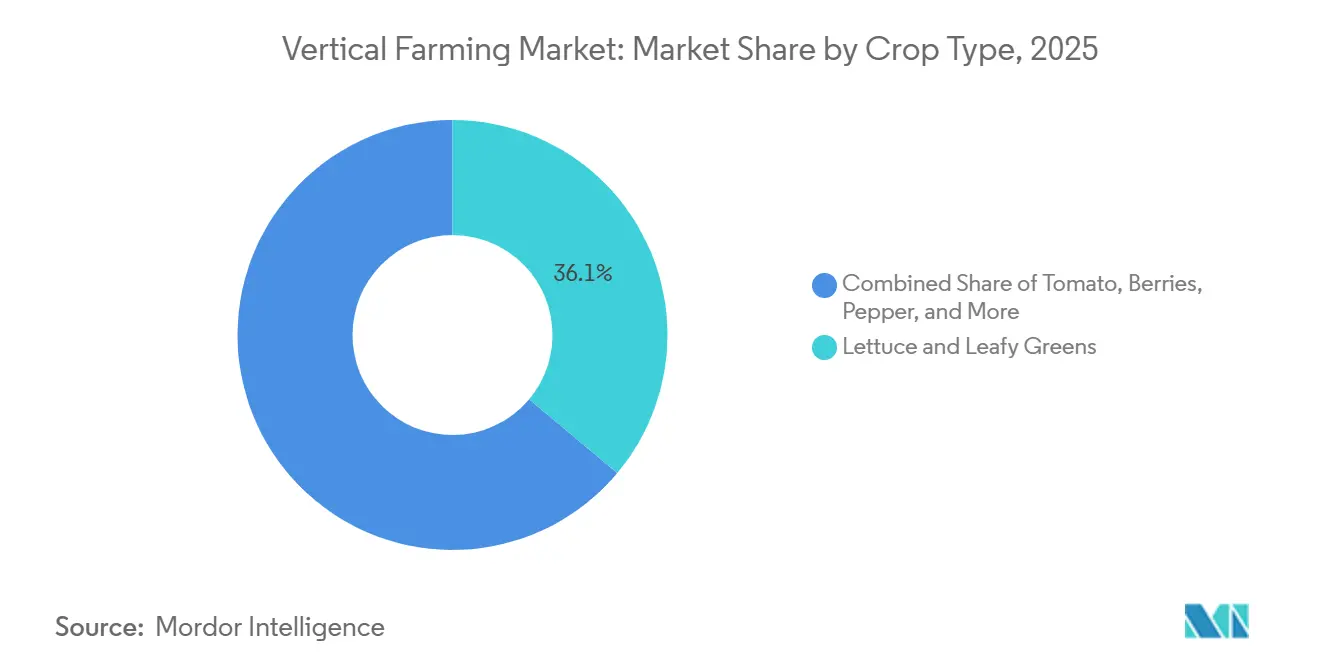
- By crop type, lettuce and leafy greens led with a 36.1% share in 2025, while microgreens will be the fastest-growing segment, posting a 13.3% CAGR during 2026-2031.
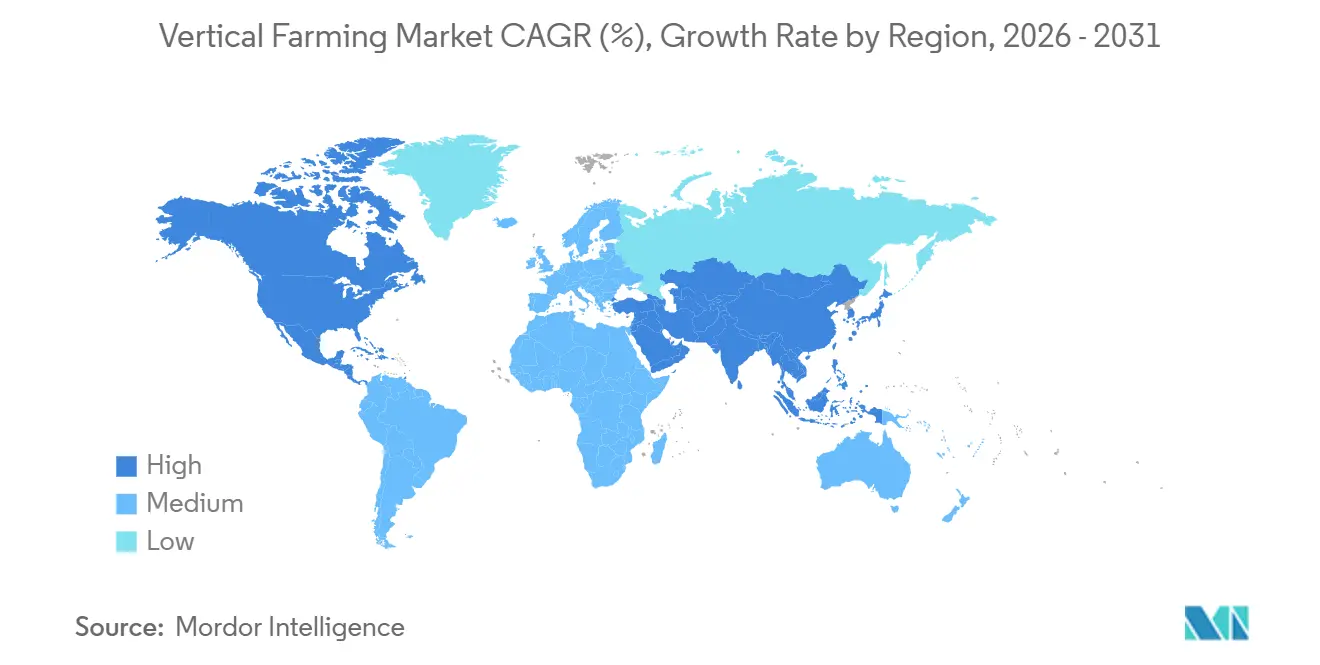
- By geography, North America accounted for 41.8% of revenue in 2025, while Asia-Pacific is anticipated to be the fastest-growing region with a 12.8% CAGR during 2026-2031.
Note: Market size and forecast figures in this report are generated using Mordor Intelligence’s proprietary estimation framework, updated with the latest available data and insights as of January 2026.
Global Vertical Farming Market Trends and Insights
Drivers Impact Analysis*
| Driver | (~) % Impact on CAGR Forecast | Geographic Relevance | Impact Timeline |
|---|---|---|---|
| Urban Demand for Local Pesticide-Free Produce | +2.50% | Global, with highest intensity in North America, Japan, Singapore, and United Arab Emirates | Medium term (2-4 years) |
| Falling LED, Robotics, and Sensing Costs | +2.20% | Global, with strongest absorption in North America, the Netherlands, Japan, and China | Long term (≥ 4 years) |
| Climate-Resilient Year-Round Production | +1.80% | Global, with acute relevance in the Middle East, Southeast Asia, and coastal United States supply chains | Medium term (2-4 years) |
| Government Food-Security Incentives and Ag-Tech Funding | +1.50% | Asia-Pacific, the Middle East, and North America | Short term (≤ 2 years) |
| Carbon-Credit and ESG Premium Revenue Stacking | +0.90% | North America and Europe, with early signals in Asia-Pacific | Long term (≥ 4 years) |
| Waste-Heat and Low-Cost Power Co-Location Economics | +0.70% | North America, the Netherlands, and Japan, with emerging relevance across data-center corridors globally | Long term (≥ 4 years) |
| Source: Mordor Intelligence | |||
Urban Demand for Local Pesticide-Free Produce
Urban demand for locally grown, pesticide-free produce has become a significant commercial driver for the vertical farming market, particularly among large grocery retailers and foodservice distributors in densely populated metropolitan areas. Gotham Greens, a major controlled-environment agriculture operator in North America, reported in February 2026 that the combined United States market share for indoor-grown packaged salads, lettuce, and herbs reached nearly 10%, with a 22% year-over-year increase during the 13-week retail measurement period ending January 2026. This indicates that indoor produce is transitioning from a niche premium shelf category to a broader market presence. This trend is important because the vertical farming market competes not only on pesticide-free labeling but also on predictable, year-round delivery, enabling retailers to reduce safety stock and manage replenishment more efficiently. Additionally, freshness offers a distribution advantage when produce is grown near metropolitan consumption hubs, as shorter transport times extend shelf life and reduce markdown pressures. As a result, the vertical farming market is gaining traction in retail accounts where reliability, provenance, and waste reduction are prioritized collectively rather than as separate purchasing factors.
Falling LED, Robotics, and Sensing Costs
Falling equipment costs remain one of the clearest growth supports for the vertical farming market because they improve the capital efficiency of new installations and upgrades. Signify launched its Philips GrowWise smart spectrum system in June 2025 and stated that the platform can deliver up to 6% energy savings or crop growth improvement through automatic spectral adjustment based on real-time sunlight conditions[1]Source: Signify, “Signify Launches Philips GrowWise Smart Spectrum to Automatically Optimize LED Lighting for Energy Use Reduction or Boost Crop Growth Up to 6%,” Philips Lighting, lighting.philips.co.uk. A March 2026 study in Frontiers in Plant Science found that continuous, low-intensity LED lighting improved energy use efficiency by 21% and reduced LED application costs by 16.5% for lettuce, without yield loss under the tested conditions[2]Source: Onofrio Davide Palmitessa et al., “Continuous Lighting at Low PPFD Improves Energy Efficiency While Preserving Growth and Quality of Lettuce in Vertical Farming Systems,” Frontiers in Plant Science, frontiersin.org. The United Kingdom Agri-Tech Center also reported in March 2026 that its Advanced Crop Dynamic Control trial improved energy efficiency by 21% to 25% through plant-led lighting control, even while the system remained at an early stage of integration. As a result, the vertical farming market is seeing a practical reset in procurement economics, as operators who delayed purchases can now evaluate more efficient hardware and automation systems than those installed during the earlier venture-heavy build cycle.
Climate-Resilient Year-Round Production
Climate volatility is propelling the vertical farming market into mainstream food procurement and food-security strategies. Controlled-environment agriculture offers stable production amid extreme weather conditions and import disruptions. In January 2026, Singapore underscored this trend with the launch of Greenphyto, the world’s tallest indoor vertical farm. This USD 80 million automated hydroponic facility produces 2,000 metric tons of leafy vegetables annually, supporting the nation’s “30 by 30” food resilience strategy. Similarly, the United Arab Emirates' Dubai GigaFarm, with a planned investment exceeding USD 327 million, aims to produce 3,000 metric tons of fresh produce annually. The facility, designed to address water scarcity and import dependence, is anticipated to become operational by the end of 2026. These initiatives highlight the increasing emphasis on climate resilience and supply stabilization, as retailers and institutional buyers prioritize consistent supply volumes, quality, and food safety. Vertical farming is increasingly recognized not as a replacement for conventional agriculture but as a complementary approach to stabilize supply in climate-vulnerable and import-dependent food systems.
Government Food-Security Incentives and Ag-Tech Funding
Public funding and policy support are reshaping the project pipeline for the vertical farming market, particularly in Asia-Pacific and the Gulf. China’s 2026 Central Document No. 1 called for upgrading and transforming facility agriculture and for the wider use of artificial intelligence, the Internet of Things (IoT), robots, and drones in agricultural production, which directly supports commercial indoor farming systems [3]Source: Central Committee of the Communist Party of China and the State Council, “2026 Central Document No. 1,” Tianjin Municipal Party Committee Veteran Cadres Bureau, tjlgbj.gov.cn. In Japan, the flow of corporate partnerships also points to rising institutional support, including the August 2025 capital and business alliance between JR East Startup and Plantform to commercialize aquaponics-based circular food production models. Government-backed demand also shifts the crop conversation, as food sovereignty programs tend to push operators beyond simple leafy green output toward a broader, more strategic crop mix. The vertical farming market, therefore, benefits not only from direct grants or subsidies but also from a longer planning horizon that supports research, crop trials, and new commercialization pathways.
Restraints Impact Analysis*
| Restraint | (~) % Impact on CAGR Forecast | Geographic Relevance | Impact Timeline |
|---|---|---|---|
| High Electricity Load and Capital Intensity | -1.50% | Global, with the highest pressure in Germany, the United Kingdom, Japan, and Australia | Short term (≤ 2 years) |
| Limited Economically Viable Crop Basket at Scale | -0.80% | Global, with strongest limits in markets seeking diversification beyond leafy greens | Medium term (2-4 years) |
| Tighter Lender and Insurer Underwriting After Sector Failures | -0.50% | North America and the United Kingdom | Short term (≤ 2 years) |
| Food-Safety and Biologic-Risk Insurance Inflation | -0.30% | United States, Canada, the United Kingdom, and the Netherlands | Medium term (2-4 years) |
| Source: Mordor Intelligence | |||
High Electricity Load and Capital Intensity
Operating economics remain one of the largest constraints in the vertical farming market because fully enclosed production systems depend on energy-intensive lighting and climate-control infrastructure. Artificial LED lighting typically accounts for the largest electricity load in indoor farms, while cooling, ventilation, and dehumidification systems add substantial operating costs to maintain stable growing conditions. These cost pressures are especially challenging in regions with high industrial electricity prices, limiting the commercial viability of lower-margin crop categories and reinforcing industry focus on premium leafy greens and specialty produce. Local Bounti Corporation’s filings with the U.S. Securities and Exchange Commission (SEC) underline how capital structure remains critical in this space, with the company reshaping debt and adding growth capital during 2025 and 2026 while continuing to optimize yields and capacity [4]Source: Local Bounti Corporation, “Earnings Release for FY2025,” U.S. Securities and Exchange Commission, sec.gov. The vertical farming market, therefore, continues to face a fundamental constraint: technical feasibility does not always translate into financially sustainable deployment.
Limited Economically Viable Crop Basket at Scale
The commercially viable crop basket in the vertical farming market is still concentrated in lettuce, leafy greens, herbs, microgreens, and selected premium fruit categories. That narrow base exists because long-cycle crops, heavy biomass crops, and crops with more complex pollination needs still struggle to absorb the cost of enclosed multi-tier production at retail-competitive prices. Plenty Unlimited Inc. emerged from Chapter 11 in May 2025 and announced it was refocusing tightly on strawberries while expanding capacity at its Richmond, United States, facility, which shows how carefully operators now approach crop specialization after earlier expansion efforts. This also makes clear that crop-basket expansion can dilute execution if operators move too far from proven leafy green economics before unit profitability is established. For the vertical farming market, that means broader crop diversification will likely depend on public research support and targeted premium niches rather than rapid private rollout alone.
*Our forecasts treat driver/restraint impacts as directional, not additive. The impact forecasts reflect baseline growth, mix effects, and variable interactions.
Segment Analysis
By Growing Mechanism: Hydroponics Leads While Aeroponics Scales for Next-Generation Efficiency
Hydroponics was the largest growing mechanism in the vertical farming market, with a 56.7% share in 2025. Its lead came from a long commercial record in nutrient delivery, crop-cycle control, and root-zone management across several indoor farm formats. The hydroponic installed base also remained the deepest because many operator investments made between 2018 and 2023 were built around this system architecture. That installed base still shapes procurement, grower training, and input sourcing in the vertical farming industry. As a result, share rebalancing remains gradual even as newer systems improve.
Aeroponics is the fastest-growing technology and is projected to expand at a 13.1% CAGR during 2026-2031 in the vertical farming market. The model appeals to operators seeking better root-zone hygiene and additional water savings beyond those offered by standard recirculating hydroponic systems. Aquaponics is also gaining attention, where circular food systems and dual revenue streams can justify more operational complexity. JR East Startup and Platform announced a capital and business alliance in August 2025 to commercialize aquaponics-based circular food production, as its aquaponics facilities expanded to 5 sites across Japan. That supports the view that the vertical farming market is slowly expanding into integrated food systems rather than moving away from hydroponics all at once.


By Farm Structure: Building-Based Scale Persists While Container Farms Redefine Flexibility
Building-based farms were the largest segment, accounting for 72.4% if the vertical farming market size in 2025. Their lead reflects a larger productive capacity, more integrated climate systems, and better fixed-cost absorption at a commercial scale. These projects also tend to attract institutional capital more easily because their operating models are clearer than in many smaller modular deployments. In practice, the largest building-based assets still set the benchmark for how the vertical farming market scales in metropolitan supply chains. That position has kept this structure at the center of high-volume commercial planning.
Shipping-container-based farms were the fastest-growing structure and are projected to grow at a 12.3% CAGR during 2026-2031. Their appeal comes from rapid deployment, geographic flexibility, and lower commitment for operators entering undersupplied regions. The July 2025 transfer of Freight Farms assets to Growcer, which included more than 500 active container farm locations, showed that demand for container-based systems persisted even after the original company failed. The Dubai GigaFarm project also highlights the other end of the scale spectrum, with the first components for the initial 20 of 200 planned growth towers shipped in 2025, and full project output targeted at 3,000 metric tons annually. Taken together, these patterns show that the vertical farming market uses container and building-based formats less as substitutes and more as complementary tools for different stages of market entry and scale-up.
By Component: Lighting Dominates Spend as Software Emerges as the Margin Lever
Lighting systems were the largest component of the vertical farming market, accounting for 34.3% of the market revenue in 2025. That position reflects the fact that lighting remains both the main crop-growth input and one of the biggest operating cost drivers in enclosed farms. Signify introduced its 4-channel Philips GreenPower LED toplighting system in June 2025. The system can deliver up to 5,150 micromoles per second and an efficacy of up to 4.3 micromoles per joule at 50% power. Because of this cost structure, hardware efficiency remains central to profit improvement across the vertical farming market. The largest share in this category, therefore, reflects both necessary spend and continued pressure to improve photon efficiency.
Software and control platforms were the fastest component and are projected to advance at 13.8% CAGR during 2026-2031. This shift shows that the vertical farming market is moving from hardware-first differentiation toward data-led crop steering, automation, and autonomous operating control. Cisco and Planet Farms Holding S.p.A. announced in April 2026 that their deployment uses 6 gigahertz Wi-Fi and Ultra Reliable Wireless Backhaul to support thousands of sensors, robots, and 3D cameras across the company’s Italian facilities. Oishii Farm Corporation, in 2025, acquired Tortuga AgTech, expanding its robotics and engineering capabilities as it scaled its indoor smart farm model. The vertical farming market is therefore placing more of its future margin story in control systems, data integration, and labor-saving automation.
By Crop Type: Leafy Greens Anchor Revenue While Microgreens Lead Growth
Lettuce and leafy greens were the largest crop type in the vertical farming market, accounting for 36.1% of the market share in 2025. Their lead came from short crop cycles, high hydroponic compatibility, and strong alignment with the most stable fresh retail demand base. This category also benefits from repeatability, which matters in indoor systems where output consistency directly shapes retailer relationships. In practical terms, leafy greens remain the commercial anchor of the vertical farming market even as operators test higher-value crops. That keeps revenue concentration tilted toward crops with proven indoor operating profiles.
Microgreens were the fastest crop type and are projected to grow at 13.3% CAGR during 2026-2031. Their appeal stems from short harvest windows, efficient space use, and strong demand in premium food-service channels, where higher price points are more achievable. GoodLeaf Farms stated in November 2025 that the demand for its Canadian-grown baby greens, microgreens, and blends had nearly doubled by April 2025, and the company raised USD 37.9 million (CAD 52 million) to expand capacity and establish a research and development center. China News also reported in April 2026 that the fifth Pinduoduo and Shanghai Academy of Agricultural Sciences competition shifted its focus toward commercially replicable low-cost strawberry cultivation in plant factories, pointing to the next phase of crop-basket development. The vertical farming market, therefore, keeps its revenue base in greens while gradually expanding into premium specialty categories where pricing can support indoor economics.
Geography Analysis
North America was the largest regional contributor to the vertical farming market, accounting for 41.8% of the market share in 2025. The region benefits from dense metropolitan retail networks, established cold-chain systems, and a concentration of technology capital that supports the scale of indoor farming. Local Bounti Corporation reported FY2025 sales of USD 48.37 million and serves around 13,000 retail doors, demonstrating the commercial reach already achieved by some United States operators. Canada continues to strengthen its position as a secondary hub, with GoodLeaf Farms raising USD 37.9 million (CAD 52 million) in November 2025, to double capacity at its Alberta and Quebec sites and to build a new research and development center in Ontario.
Asia-Pacific was the fastest-growing regional segment in the vertical farming market and is projected to grow at a 12.8% CAGR during 2026-2031. Land scarcity, food safety expectations, and stronger state-backed support for facility agriculture across Japan, China, Singapore, and South Korea are shaping growth. China’s 2026 policy direction formally supports upgrades in facility agriculture and the broader use of artificial intelligence, the Internet of Things, robots, and drones, which strengthens the region’s long-term deployment base. The Middle East also carries strong strategic weight in the vertical farming market, with Bustanica broadening its commercial reach into retail, hospitality, and large-scale catering in 2026. Africa and South America remain early-stage opportunities in the vertical farming market, with project activity still more limited and more likely to build first through smaller urban nutrition and modular deployment models than through immediate large-scale commercial rollouts.
Europe presents a more mixed picture in the vertical farming market, as strong consumer demand for local indoor produce sits alongside elevated electricity costs and tighter financing conditions. Jones Food Company Limited entered administration in April 2025 after repeated rounds of funding support from Ocado Group, illustrating how cost pressure can overwhelm scale ambition when profitability remains out of reach. At the same time, the region remains influential in technology development, especially through lighting, control systems, and engineering platforms tied to the Netherlands, Italy, and the United Kingdom. Cisco’s April 2026 work with Planet Farms Holding S.p.A. signals that Europe remains active in autonomous indoor farming infrastructure and in planned geographic expansion to the United Kingdom and Nordic markets. Europe, therefore, remains important to the vertical farming market, but its growth path depends more tightly on energy costs and capital discipline than in some other regions.

Competitive Landscape
The vertical farming market is highly fragmented, comprising crop producers, technology suppliers, and hybrid platforms that integrate farm operations with technology licensing. Prominent crop production companies in North America include 80 Acres Farms Inc. and Gotham Greens Holdings LLC, while companies such as Signify N.V., ams-OSRAM AG, and Intelligent Growth Solutions Limited focus on enabling systems. Consequently, the vertical farming market does not function as a single-format produce category, as competition spans crop output, equipment sales, software control, environmental systems, and project development. This creates a diverse and uneven competitive landscape where operational efficiency and commercial sustainability are more critical than valuation alone.
The current strategic focus in the vertical farming market emphasizes disciplined expansion, adaptable infrastructure, and stronger downstream partnerships. In July 2025, Canadian vertical farming company Growcer acquired the assets of Freight Farms after the U.S.-based container farming pioneer filed for Chapter 7 bankruptcy earlier that year. The acquisition included Freight Farms’ software platform, intellectual property, customer network, and inventory spanning over 500 global farm locations, highlighting the ongoing consolidation within controlled-environment agriculture. Additionally, technology optimization is gaining prominence over aggressive footprint expansion. In 2026, Signify N.V. advanced its Philips GreenPower horticultural lighting systems, prioritizing energy efficiency and spectrum optimization for leafy-green production. Such trends indicate that the vertical farming market increasingly values operational discipline, energy efficiency, and scalable deployment models over rapid, unchecked growth strategies.
Smaller and mid-sized operators still have opportunities in the vertical farming market, though the landscape has become more challenging compared to earlier investment cycles. Smaller and mid-sized operators continue to find opportunities in the vertical farming market, though these opportunities have become more limited following several high-profile restructurings. Jones Food Company, previously one of the largest vertical farming operators in the United Kingdom, entered administration in April 2025 due to high operating costs and challenges in achieving long-term profitability, despite significant investment from Ocado Group. Such trends indicate while the vertical farming market remains accessible to new entrants, factors such as financial stability, energy efficiency, and strong buyer relationships are increasingly critical for sustaining viable commercial operations.
Vertical Farming Industry Leaders
80 Acres Farms Inc.
Gotham Greens Holdings LLC
Local Bounti Corporation
Signify N.V.,
ams-OSRAM AG
- *Disclaimer: Major Players sorted in no particular order

Recent Industry Developments
- May 2026: Oishii Farm Corporation closed the first tranche of a USD 150 million Series C funding round led by SPARX Asset Management, with Nomura Real Estate Development, MISUMI Group, and Mizuho Bank participating. The capital is designated to expand production capacity, integrate advanced robotics, and fund research and development at a new Open Innovation Center in Hamura City, Tokyo,
- March 2026: Local Bounti Corporation secured USD 15 million through a convertible note issued to an existing strategic investor, as disclosed in a Form 8-K filing with the U.S. Securities and Exchange Commission (SEC). The capital is intended to fund operational investments and extend financial flexibility for the company's retail expansion strategy.
- January 2026: Elevate Farms Inc. completed the acquisition of all issued and outstanding securities of Fieldless Farms Inc., creating one of Canada's larger integrated controlled-environment food businesses. The transaction was structured to build domestic food production capacity amid shifting United States-Canada tariff policies affecting cross-border food imports.


Research Methodology Framework and Report Scope
Market Definitions and Key Coverage
Our study defines the vertical farming market as all revenue generated from crops grown in vertically stacked layers inside controlled-environment facilities that rely on soil-less techniques such as hydroponics, aeroponics, and aquaponics, together with the associated lighting, climate, nutrient, and sensing systems that enable year-round production.
Scope exclusions: outdoor greenhouses, rooftop poly-houses, and traditional soil-based indoor farms are not considered.
Segmentation Overview
- By Growing Mechanism
- Hydroponics
- Aeroponics
- Aquaponics
- By Farm Structure
- Building-based Vertical Farms
- Shipping-container-based Vertical Farms
- By Component
- Lighting Systems
- Climate Control Systems
- Sensors and Monitoring Devices
- Irrigation and Fertigation Systems
- Software and Control Platforms
- Farm Structure Materials and Growing Racks
- By Crop Type
- Lettuce and Leafy Greens
- Herbs
- Tomatoes
- Berries
- Cucumbers
- Peppers
- Microgreens
- Other Crops
- By Geography
- North America
- United States
- Canada
- Mexico
- Rest of North America
- Europe
- Germany
- United Kingdom
- France
- Netherlands
- Spain
- Russia
- Rest of Europe
- Asia-Pacific
- China
- Japan
- India
- Singapore
- South Korea
- Australia
- Rest of Asia-Pacific
- South America
- Brazil
- Argentina
- Chile
- Rest of South America
- Middle East
- United Arab Emirates
- Saudi Arabia
- Israel
- Turkey
- Rest of Middle East
- Africa
- South Africa
- Kenya
- Egypt
- Rest of Africa
- North America
Detailed Research Methodology and Data Validation
Primary Research
We interviewed farm operators in North America, Europe, and Asia, LED and HVAC component suppliers, energy advisors, and retail produce buyers. Their insights refined crop yield assumptions, average selling prices, and energy-mix sensitivities, allowing us to adjust model coefficients and close data gaps flagged during secondary review.
Desk Research
Mordor analysts first mapped the global installed base of building-based and container farms through open trade registries, agriculture ministries, and customs codes 8446/8479. They then blended volume signals from sources such as FAO's AQUASTAT, USDA urban agriculture briefs, Eurostat agri-tech datasets, and patent families captured in Questel that trace LED spectra and nutrient dosing innovations. Company filings, SPAC decks, and VC term sheets complemented the picture, while news feeds screened via Dow Jones Factiva flagged capacity expansions and shutdowns. This desk work grounds the starting universe; however, many more public and subscription sources were reviewed for validation and context.
Market-Sizing & Forecasting
A top-down capacity-to-revenue model converts known farm footprints into potential output using crop-specific yield factors, then applies realized capacity utilization and average selling price bands validated through interviews. Select bottom-up checks, sampled supplier roll-ups and channel ASP × volume, are layered in to reconcile totals. Key variables driving the forecast include LED price trajectories, commercial electricity tariffs, urban real-estate costs, retail premiums for pesticide-free produce, and venture capital inflows that fund new builds. Multivariate regression combined with scenario analysis projects these drivers through 2030, while short-term ARIMA smoothing addresses seasonality in leafy-green demand. Any bottom-up coverage shortfall is bridged by adjusting utilization rates within historically observed limits.
Data Validation & Update Cycle
Outputs undergo multi-step triangulation, variance testing, and peer review before sign-off. The model is refreshed annually, and interim updates are triggered when material events, large farm closures, subsidy shifts, and major tech breakthroughs alter baseline inputs. A final analyst pass just before publication ensures clients receive the latest vetted view.
Why Mordor's Vertical Farming Baseline Is Dependable
Published estimates vary because each firm chooses its own scope, input mix, and refresh rhythm.
Differences in whether hardware revenue is bundled, how container farms are counted, and the speed at which LED cost curves are embedded often widen the gap.
Benchmark comparison
| Market Size | Anonymized source | Primary gap driver |
|---|---|---|
| USD 6.70 B (2025) | Mordor Intelligence | |
| USD 9.66 B (2025) | Global Consultancy A | Bundles grow-light hardware sold to cannabis growers and applies aggressive 90% capacity utilization assumption |
| USD 8.52 B (2025) | Trade Journal B | Uses constant 15% ASP inflation and omits container-farm attrition rates |
| USD 5.60 B (2024) | Regional Consultancy A | Excludes aquaponic output and has a one-year older currency base |
These comparisons show that when scope creep, untested utilization levels, or outdated baselines are stripped away, Mordor's disciplined variable selection and annual refresh deliver a balanced, transparent starting point that decision-makers can trust.


Key Questions Answered in the Report
What is the projected value of the vertical farming market by 2031?
The vertical farming market is forecast to reach USD 12.11 billion by 2031, rising from USD 7.53 billion in 2026 at a 9.98% CAGR during 2026-2031.
Which growing mechanism holds the largest share in vertical farming?
Hydroponics was the largest segment, accounting for 56.7% of total value in 2025 because of its long commercial track record and broad crop compatibility.
Which farm format is expanding the fastest in vertical farming?
Shipping-container-based farms are the fastest structure, with a projected 12.3% CAGR during 2026-2031 due to their flexible and rapid deployment model.
Which crop category is growing the fastest in vertical farming?
Microgreens are the fastest crop type, with a projected 13.3% CAGR during 2026-2031, supported by short harvest cycles and strong premium food-service demand.
Which region leads vertical farming today and which one is growing the fastest?
North America was the largest region with 41.8% share in 2025, while Asia-Pacific is the fastest region with a projected 12.8% CAGR during 2026-2031.
What is the main barrier to profitability in vertical farming?
High electricity use and capital intensity remain the main barrier, since lighting, cooling, and dehumidification create a heavy operating cost base in enclosed farms.
Page last updated on:


