Market Overview
| Study Period | 2021 - 2031 |
|---|---|
| Forecast Data Period | 2026 - 2031 |
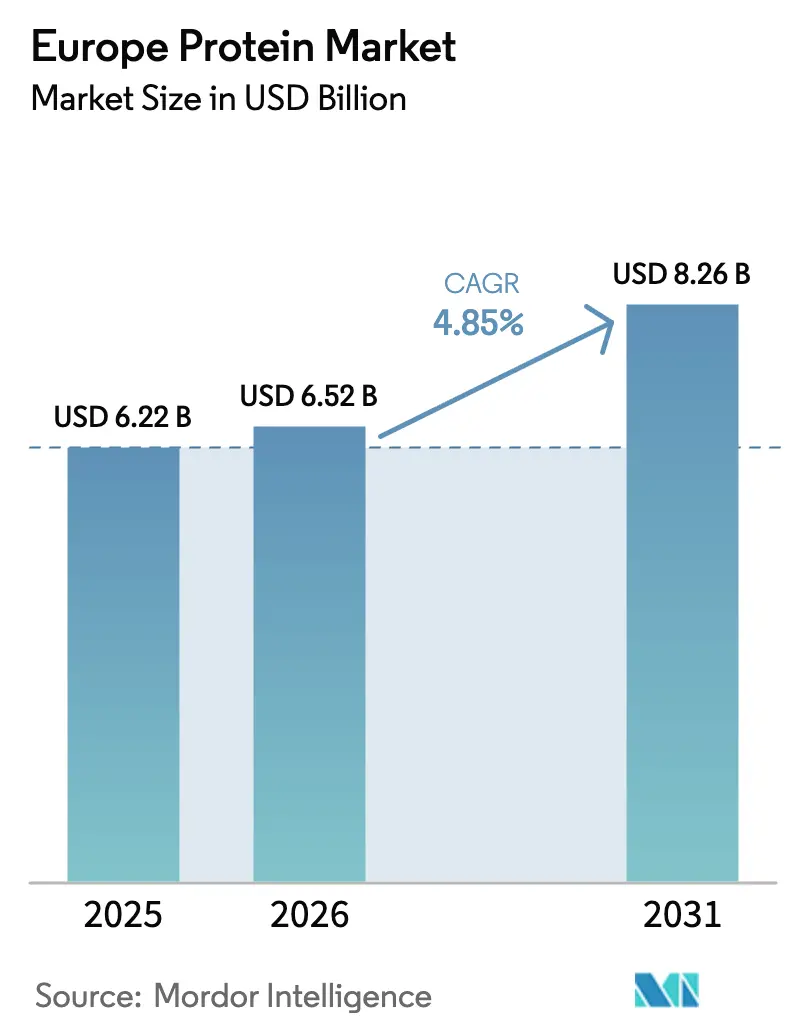
| Base Year Market Size (2025) | USD 6.22 Billion |
| Market Size (2026) | USD 6.52 Billion |
| Market Size (2031) | USD 8.26 Billion |
| Growth Rate (2026 - 2031) | 4.85% CAGR |
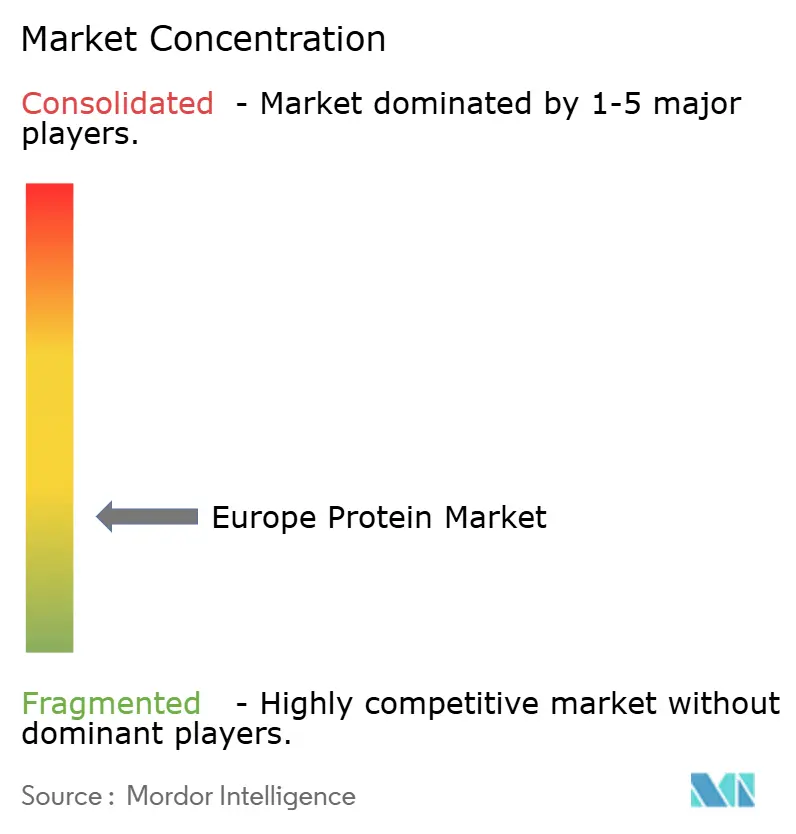
| Market Concentration | Low |
Major Players
*Disclaimer: Major Players sorted in no particular order Image © Mordor Intelligence. Reuse requires attribution under CC BY 4.0. |
|
Europe Protein Market Analysis by Mordor Intelligence
The European protein market size was valued at USD 6.22 billion in 2025 and estimated to grow from USD 6.52 billion in 2026 to reach USD 8.26 billion by 2031, at a CAGR of 4.85% during the forecast period (2026-2031). Growth reflects a decisive pivot away from imported soy toward domestically produced pulses, fermentation-derived ingredients, and insect biomass, a shift accelerated by Farm-to-Fork targets, Green Deal capital, and retailer carbon budgets. Plant-based proteins still dominate, yet microbial proteins are commercializing faster as Horizon-funded pilots move to industrial scale. Competitive behavior is shaped by medium fragmentation: legacy dairy cooperatives grow pea and whey capacity while venture-backed precision-fermentation specialists race for first-mover EFSA approvals. Raw-material volatility, notably the 23% surge in yellow-pea prices during the 2024 Canadian drought, strengthens vertically integrated processors able to self-contract acreage.
Key Report Takeaways
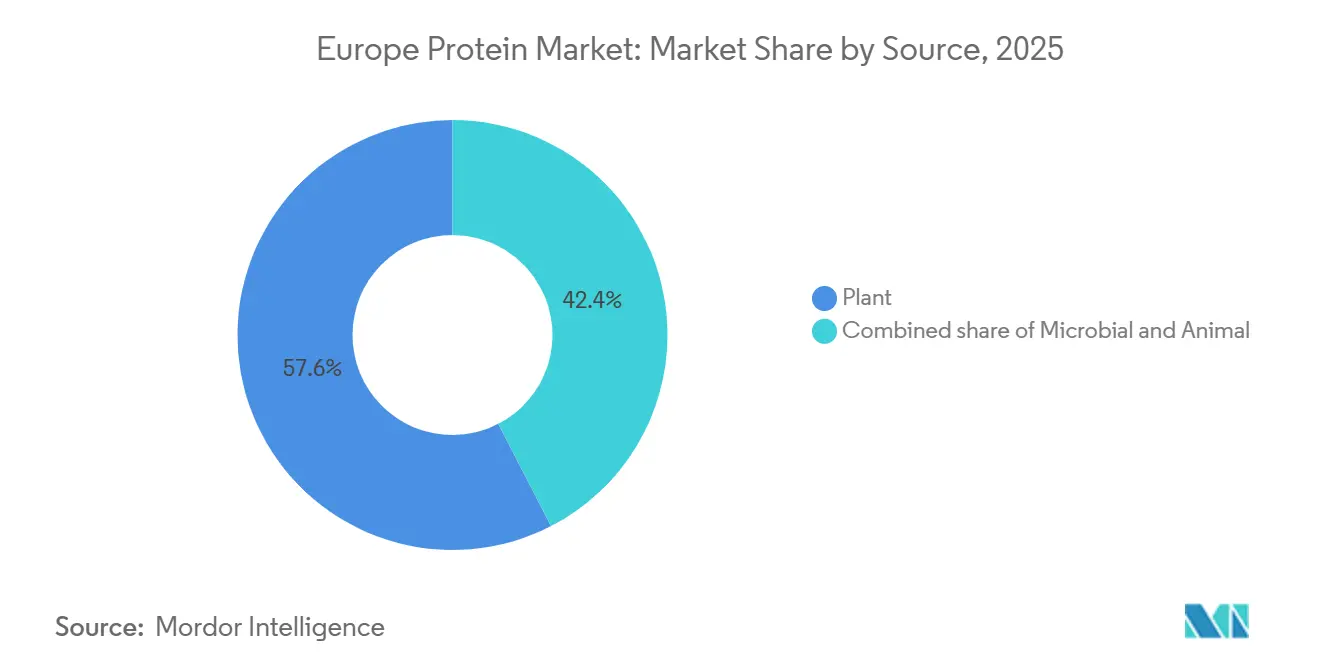
- By source, plant proteins held 57.58% of the Europe protein market share in 2025, while microbial proteins are projected to grow at a 6.32% CAGR through 2031.
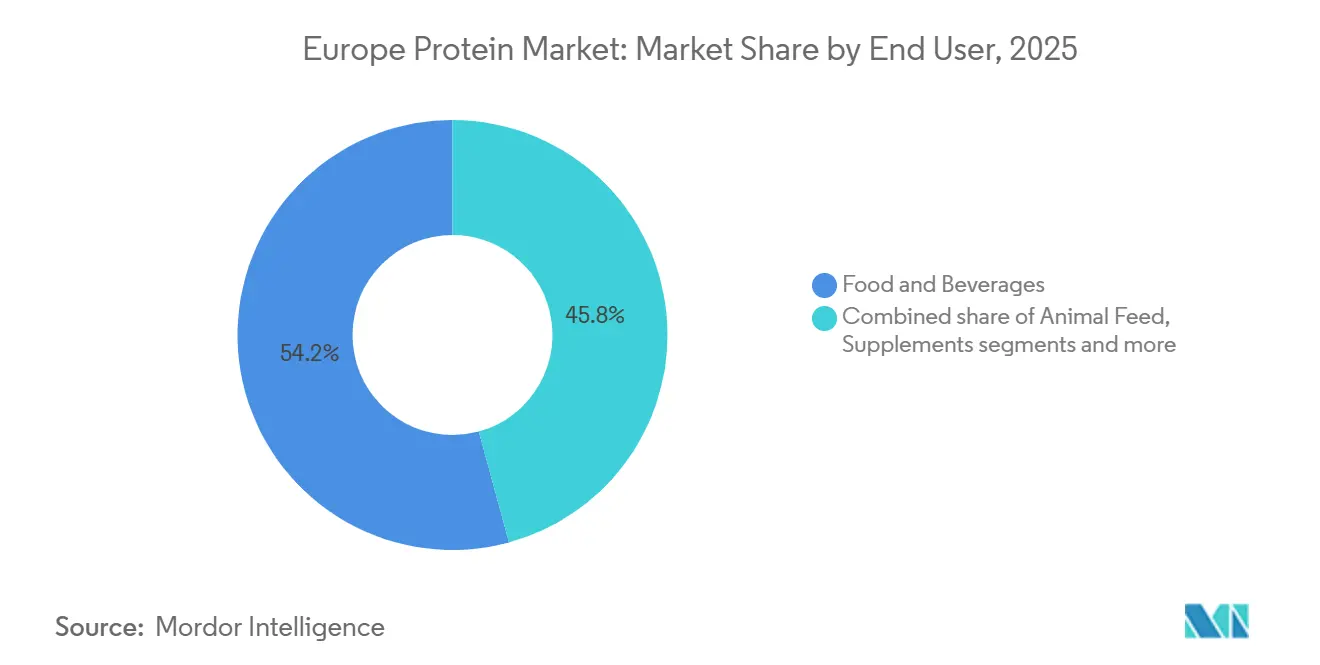
- By end user, food and beverages captured 54.24% of Europe's protein market size in 2025; personal care and cosmetics are advancing at a 6.05% CAGR to 2031.
- By geography, Germany led with a 22.19% Europe protein market share in 2025, whereas the Netherlands recorded the fastest 5.34% CAGR through 2031.
Note: Market size and forecast figures in this report are generated using Mordor Intelligence’s proprietary estimation framework, updated with the latest available data and insights as of January 2026.
Europe Protein Market Trends and Insights
Drivers Impact Analysis*
| Driver | (~) % Impact on CAGR Forecast | Geographic Relevance | Impact Timeline |
|---|---|---|---|
| Growth of plant-based and flexitarian diets | +1.4% | Pan-European, strongest in Germany, Netherlands, United Kingdom | Medium term (2-4 years) |
| EU Green-Deal funding for protein diversification | +0.9% | EU-27, concentrated in France, Germany, Poland for pulse cultivation | Long term (≥ 4 years) |
| Advances in processing and extraction technologies | +1.1% | Netherlands, Germany, Sweden (fermentation hubs) | Medium term (2-4 years) |
| Clean label, allergen and digestibility preferences | +0.8% | United Kingdom, Germany, France (stringent labeling regimes) | Short term (≤ 2 years) |
| Shift to high-protein diets and fitness culture | +0.7% | Western Europe, urban centers | Short term (≤ 2 years) |
| Regulatory push for sustainable protein strategy | +0.5% | EU-27, national implementation varies | Long term (≥ 4 years) |
| Source: Mordor Intelligence | |||


Shift to high‑protein diets and fitness culture
The increasing adoption of high-protein diets and fitness culture in Europe reflects a shift toward more active lifestyles, where regular gym attendance, sports participation, and structured training routines have made protein intake a daily priority rather than a niche concern. Between November 2023 and November 2024, Sport England reported that 63.7% of adults in England met the Chief Medical Officers’ guideline of engaging in 150+ minutes of moderate-intensity physical activity per week, the highest level recorded [1]Source: Sport England. "Record Numbers Playing Sport and Taking Part in Physical Activity", sportengland.org . This growing base of active consumers is driving food, beverage, and nutrition manufacturers to collaborate with protein ingredient suppliers to develop products that deliver higher protein content in convenient formats aligned with gym and training habits. Companies such as Arla Foods Ingredients provide functional dairy protein ingredients, including whey and casein fractions, for use in shakes, high-protein yogurts, bars, and ready-to-mix blends targeted at performance-focused consumers. Concurrently, the demand for plant-based protein options is rising, with manufacturers sourcing proteins like pea, faba, soy, and pulses from suppliers such as Roquette and Cosucra to create "plant-forward" formulations that support muscle recovery and performance. The evolution of training culture, encompassing strength training, functional fitness, and endurance events, has also increased the need for differentiated protein functionalities, such as solubility, texture, and digestion rate. This has opened opportunities for microbial and fermentation-based protein suppliers like Mycorena and Quorn Ingredients, whose fungi-derived proteins are used in high-protein meals and snacks. As structured exercise becomes more prevalent, ingredient suppliers are investing in research and collaborations to meet the demand for science-backed protein claims, ensuring products are optimized for pre- and post-workout consumption. This dynamic interaction between consumer demand and innovation continues to shape the protein market in Europe.
Growth of plant‑based and flexitarian diets
The increasing adoption of plant-based and flexitarian diets is reshaping consumer preferences, driving demand for versatile, high-quality protein ingredients that cater to mixed eating patterns. By 2025, 51% of adults in the United Kingdom and Germany plan to adjust their diets by either increasing plant-based food consumption or reducing animal meat and dairy intake, with around 20% intending to do both, according to a report by the Good Food Institute Europe (GFI Europe) [2]Source: Good Food Institute Europe (GFI Europe), "Research: Four in 10 German and UK Adults Plan to Eat More Plant-based Food," gfieurope.org. This trend expands opportunities for brands supplying protein ingredients for meat, dairy, and hybrid formulations. Flexitarian consumers are prompting food manufacturers to collaborate with plant-protein specialists, such as Roquette (pea and wheat proteins), to develop meat and dairy alternatives and "plant-forward" product lines that align with health and sustainability goals. While flexitarians do not entirely reject animal protein, they seek improved options, sustaining demand for animal-derived protein ingredients from companies like FrieslandCampina Ingredients, which blend these with plant proteins in hybrid meats, ready meals, and high-protein snacks to enhance functionality and nutrition while reducing the animal protein share. Additionally, microbial and fungi-based protein ingredients from companies such as ENOUGH (mycoprotein) and The Protein Brewery (fermented fungal proteins) are gaining traction, offering solutions that combine plant and animal proteins to meet protein targets, texture, and sustainability goals. As flexitarian diets become mainstream, ingredient suppliers are designing integrated protein systems that combine pea, soy, cereal, dairy, and microbial proteins to deliver the sensory quality and nutrition consumers expect. This shift is driving the protein market toward a continuum of solutions, from fully plant-based to hybrids and responsibly sourced animal products, underpinned by collaboration between ingredient manufacturers and food brands to meet consumer expectations for taste, functionality, health, and sustainability.
Clean label, allergen and digestibility preferences
Consumer preferences for clean label, allergen considerations, and digestibility are playing a pivotal role in shaping the protein market in Europe. Buyers are increasingly scrutinizing ingredient lists and processing methods, favoring protein sources that are simple, recognizable, and easy to digest, particularly in protein-fortified foods used for daily nutrition. This has driven demand for lactose-free, gluten-free, and allergen-reduced options, boosting the growth of plant proteins such as pea, fava, and other pulses, which avoid common allergens like dairy or soy while delivering substantial protein content. Companies like Loryma are innovating with clean-label binding systems that combine wheat and fava beans to provide a complete amino acid profile and short, E-number-free labels for meat alternatives. At the same time, animal proteins remain relevant, with solutions like Essentia Protein Solutions’ beef- and chicken-derived ingredients, which use only thermal and mechanical processing to deliver collagen-rich, non-allergenic, minimally processed options that meet transparency expectations for human and pet nutrition. Native or non-denatured dairy proteins are also gaining traction, with suppliers such as Eurial I&N offering solutions that replace texturing additives and enable shorter ingredient lists, addressing consumer demand for authenticity. Microbial protein technologies, such as ProteinDistillery’s brewer's yeast-based Prew:tein®, align with clean label narratives by offering upcycled, mechanically processed proteins free from synthetic aids. These trends are encouraging formulators to design recipes that meet protein targets while minimizing allergens like lactose, gluten, and soy, emphasizing native proteins and simple processing. Clean label criteria and digestibility considerations are becoming central to B2B specifications, fostering collaboration with partners like Bariatrix Europe and Laboratoire PYC, who focus on GMO-free, preservative-free, and allergen-controlled formulations. This shift is driving a holistic approach to protein innovation, where ingredient origin, processing intensity, allergen profile, and digestive comfort are prioritized alongside taste and texture.
EU Green-Deal funding for protein diversification
The EU Green Deal funding for protein diversification is driving significant advancements in the European protein market by channeling public investments into crops and technologies that expand the region's protein base across plant, animal, and microbial sources. This initiative aligns with the Farm-to-Fork strategy and climate objectives. A notable example is the European Commission’s allocation of EUR 12 million under Horizon Europe topic HORIZON-CL6-2026-02-FARM2FORK-03, which supports protein-crop breeding and agronomic trials [3]Source: European Commission, "Boosting the Competitiveness of Protein Crops in Europe - HORIZON-CL6-2026-02-FARM2FORK-03", ec.europa.eu . These crops reduce reliance on synthetic fertilizers while creating a resilient, locally sourced pool of protein inputs for food and feed applications. Ingredient manufacturers like Cosucra and AGT Foods Europe benefit from stable EU-grown raw materials, which can be processed into flours, concentrates, and isolates for use in meat alternatives, bakery products, dairy analogues, and sports nutrition. Simultaneously, the EU protein strategy emphasizes sustainable animal protein systems, encouraging collaboration between meat and dairy producers and ingredient firms like Essentia Protein Solutions and FrieslandCampina Ingredients to develop high-value, low-impact animal protein ingredients. Green Deal funding also supports biomass, precision fermentation, and biorefinery projects to scale microbial protein production and overcome barriers for fermentation technologies, benefiting European microbial protein companies. These measures de-risk early-stage research and development, fostering private investment and long-term partnerships that integrate new protein ingredients into supply chains. By reducing reliance on imported protein feeds, the EU is transitioning toward a diversified protein matrix, supported by public funding that promotes environmental benefits, local sourcing, and circularity, aligning with EU climate and food system resilience goals.
Restraints Impact Analysis*
| Restraint | (~) % Impact on CAGR Forecast | Geographic Relevance | Impact Timeline |
|---|---|---|---|
| Regulatory complexity and novel food approval | -0.6% | EU-27, harmonized but national enforcement varies | Medium term (2-4 years) |
| Allergenicity and intolerance issues | -0.4% | Germany, France, United Kingdom (stringent labeling) | Short term (≤ 2 years) |
| Consumer skepticism toward emerging proteins | -0.3% | Southern Europe (Italy, Spain), traditional food cultures | Medium term (2-4 years) |
| Sensory and formulation challenges | -0.2% | Pan-European, application-specific | Short term (≤ 2 years) |
| Source: Mordor Intelligence | |||
Allergenicity and intolerance issues
Allergenicity and intolerance issues significantly impact the protein market, as a notable portion of consumers must avoid or limit specific proteins such as dairy, soy, gluten, eggs, or nuts. This reduces the potential audience for many standard protein ingredients and drives manufacturers to reformulate products with safer alternatives for sensitive groups. The growing demand for allergen-free and intolerance-focused foods in Europe reflects rising awareness of conditions such as celiac disease, lactose intolerance, and nut or egg allergies. Brands are increasingly turning to protein sources like chickpea, fava, rice, and oat proteins, which naturally avoid these triggers, creating opportunities for plant-protein specialists to supply hypoallergenic flours, concentrates, and isolates tailored to claims such as dairy-free, gluten-free, and soy-free. Simultaneously, formulators must address allergenicity risks associated with animal proteins, as milk, eggs, and certain fish or shellfish are major allergens. Animal-protein suppliers are focusing on controlled processing, transparent labeling, and precise application in products where these allergens are expected, while providing clear alternatives for intolerant consumers. Microbial and fermentation-derived proteins, often positioned as low-allergen options, face regulatory scrutiny in Europe due to potential allergenicity risks. This has led fermentation ingredient companies to invest in protein characterization, clinical evaluation, and labeling to ensure safety in allergen-sensitive formulations. Manufacturers are increasingly developing multi-protein systems that combine low-allergen plant proteins, carefully selected animal proteins, and microbial proteins for functionality, while managing cross-contamination risks and regulatory thresholds. These trends are driving growth in Europe’s food allergen and intolerance testing market, as processors rely on advanced analytical methods to verify “free-from” and “may contain” claims. For B2B buyers, allergenicity and intolerance considerations are now critical alongside cost, sustainability, and functionality, favoring suppliers that provide robust allergen documentation, dedicated production lines, and support for allergen-free claims. This dynamic is steering innovation toward a broader mix of plant, animal, and microbial proteins to meet the diverse dietary needs of consumers, from severe allergy sufferers to lifestyle-driven “free-from” adopters.
Consumer skepticism toward emerging proteins
Consumer skepticism toward emerging proteins presents a significant challenge for market growth, as many individuals question the safety, naturalness, and sensory quality of options such as insect-based, microbial, and highly engineered plant proteins compared to traditional animal and plant sources. Novel proteins, including insects and certain fermentation-derived ingredients, often encounter cultural and psychological resistance due to concerns about "unnatural" processing methods or potential long-term health effects, which hinders consumer trials and repeat purchases despite strong sustainability narratives. This skepticism also affects processed plant proteins, with some consumers perceiving products based on textured vegetable protein, isolates, and concentrates as overly processed, creating a conflict between interest in plant-based diets and distrust of highly modified ingredients. Traditional animal proteins, benefiting from decades of consumer familiarity and well-understood sensory attributes, are often perceived as "safe" and reliable. Suppliers such as Essentia Protein Solutions leverage this trust by positioning their collagen and meat-derived proteins as clean and minimally processed, setting a high standard for transparency and proof that emerging proteins must meet. Similarly, microbial and fermentation-based proteins face challenges related to limited consumer awareness, unfamiliar species names, and associations with "lab food." Producers like The Protein Brewery address these issues by highlighting natural substrates, straightforward processing, and rigorous safety assessments. Until consumer trust improves, manufacturers often limit the use of novel proteins to niche product lines or small proportions, relying on more accepted options like dairy, egg, soy, or pea proteins, which constrains the growth of emerging protein categories and slows the diversification of the protein market.
*Our forecasts treat driver/restraint impacts as directional, not additive. The impact forecasts reflect baseline growth, mix effects, and variable interactions.
Segment Analysis
By Source: Microbial Proteins Gain Despite Plant Dominance
Plant proteins accounted for 57.58% of the European market in 2025, driven by the growing adoption of flexitarian and vegan diets. Ingredients such as soy, pea, wheat, and faba beans have become the preferred choice for reformulating products, particularly in meat and dairy alternatives. This dominance allows major suppliers like Roquette (pea, wheat) and Cargill (soy, wheat, pea) to set functionality standards and pricing benchmarks across categories, making it challenging for newer protein sources to gain market share, even when they offer superior sustainability or innovation. Microbial proteins, including algae and mycoprotein, are projected to grow at a compound annual growth rate (CAGR) of 6.32% through 2031, the fastest among all source types. These proteins align with European sustainability and land-use objectives while offering unique functional and nutritional benefits. Suppliers such as ENOUGH (fermentation-based mycoprotein) and Corbion (algae-derived ingredients) position their products as high-value additions to applications like burgers, ready meals, and hybrid products, enabling brands to differentiate on attributes such as texture, fiber content, or fatty-acid profiles without moving away from the plant-protein foundation that dominates market volumes.
Animal proteins, including whey, casein, collagen, gelatin, egg, and insect proteins, continue to set performance benchmarks in sports nutrition and functional foods. Whey protein isolates, in particular, command premium pricing due to their complete amino-acid profile, high digestibility, and strong scientific support for muscle recovery and performance. Companies such as Arla Foods Ingredients and Lactalis Ingredients supply advanced whey and milk protein isolates to the European sports and medical nutrition markets, reinforcing the perception that high-performance products still rely heavily on animal proteins. Collagen and gelatin producers, such as Gelita, extend the relevance of animal proteins into segments like beauty-from-within, joint health, and gummy formats, where plant and microbial alternatives face technical challenges. Insect proteins remain niche, with suppliers like Innovafeed and Protix focusing on pet food and feed markets, where regulatory and consumer barriers are lower. While microbial proteins are expanding rapidly, their growth is constrained by the entrenched dominance of plant proteins and the established benchmarks set by animal proteins. Most manufacturers treat microbial proteins as high-value, blended ingredients rather than primary volume sources, requiring strategic sourcing to balance plant proteins as the primary volume driver, animal proteins as the functional standard, and microbial proteins as a fast-growing, sustainability-aligned complement.


By End User: Personal Care Outpaces Food Growth
Food and beverages accounted for 54.24% of protein ingredient consumption in Europe in 2025, underscoring their role as essential nutritional and functional components in mainstream products. Within this category, meat and poultry alternatives have emerged as the largest sub-segment, driven by the need for high protein content and advanced texturizing systems to replicate animal meat. This has led to strong demand for plant-based protein ingredients, such as soy, pea, and wheat proteins, supplied by companies like Ingredion and Beneo. These suppliers offer tailored solutions for products like burgers, nuggets, and cold cuts, addressing both flexitarian consumer preferences and processing requirements in European manufacturing facilities. Supplements, including sports nutrition, infant formula, and medical nutrition, represent the second-largest end-user segment, with sports and dietary supplements driving volume due to their reliance on proteins like isolates and hydrolysates for performance and recovery. Leading players such as Glanbia Nutritionals and Fonterra provide advanced protein ingredients with optimized solubility, flavor masking, and amino acid profiles, while infant and medical nutrition applications add complexity with stringent regulatory and safety requirements.
Personal care and cosmetics, while a smaller consumer of protein ingredients, represent the fastest-growing end-user segment with a projected CAGR of 6.05% through 2031. Growth is driven by EU Ecodesign-linked sustainability requirements, which discourage petroleum-derived emulsifiers and promote bio-based, biodegradable functional ingredients. Hydrolyzed wheat proteins, silk proteins, and collagen peptides are increasingly used in anti-aging serums, skin-firming lotions, and hair-repair treatments, offering film-forming, conditioning, and moisture-retention benefits that support premium product positioning. Additionally, large FMCG companies like L’Oréal and Unilever are prioritizing plant-based and low-impact protein ingredients, such as wheat, oat, or pea-derived proteins, and exploring microbial or fermentation-derived actives as substitutes for conventional petrochemical components. This focus on sustainability and innovation fosters collaboration between cosmetic companies and protein specialists, ensuring that incremental volume growth in personal care is captured by protein ingredients with strong environmental and performance credentials.
Geography Analysis
Germany accounted for 22.19% of the European protein market in 2025, driven by its dual role as a pulse-processing hub and a leading exporter of collagen and gelatin. The country combines a strong base in plant proteins, such as soy, wheat, and pea, with a well-established legacy in animal-based functional proteins used in food, supplements, and personal care. German manufacturers leverage this position by supplying pulse proteins for meat and poultry alternatives, bakery products, and dairy-style items, while exporting collagen and gelatin for confectionery, nutraceuticals, and cosmetics. This dual capability allows Germany to lead in both traditional and emerging protein segments, supported by its advanced food-processing infrastructure and innovation clusters that enable the rapid development of hybrid products blending plant and animal proteins.
The Netherlands, projected to grow at a 5.34% CAGR through 2031, has emerged as a key hub for precision fermentation in Europe. The country hosts a robust ecosystem of fermentation start-ups, contract manufacturing facilities, and research and development partnerships focused on microbial proteins and functional ingredients. Dutch companies utilize this ecosystem to scale production of mycoprotein, single-cell proteins, and specialty protein ingredients, which are exported across Europe for applications in meat analogues, dairy alternatives, and high-value functional foods. This growth complements the Netherlands’ historical role as a trading and processing hub, positioning it as a bridge between innovative microbial protein technologies and established manufacturers in neighboring markets.
Nordic countries, while smaller in market size, are among the fastest-growing regions due to their strong sustainability agendas and high acceptance of plant-based and alternative proteins. These markets often serve as early adopters for microbial and hybrid protein concepts. Central and Eastern European countries contribute incremental growth from a lower base, gradually increasing their use of plant and animal protein ingredients as processed food and supplements markets expand. Together, these regions shape the European protein market, balancing traditional and alternative protein sources to meet evolving industry demands.

Competitive Landscape
The protein market in Europe is characterized by significant fragmentation, with no single company holding more than 8% market share and the top 10 firms collectively accounting for less than 45%. This structure diffuses pricing power and encourages continuous innovation rather than market dominance by a few large players. Established dairy cooperatives, such as Arla Foods and FrieslandCampina, leverage vertical integration to maintain their whey and casein franchises. Their control over milk collection, fractionation, and advanced application support enables them to secure raw milk access, optimize processing efficiency, and establish long-term contracts in sports, medical, and performance nutrition. This integrated approach creates barriers for new entrants in high-specification whey isolates and caseinates, even as customers explore blends incorporating plant and alternative proteins. Meanwhile, medium-sized regional players carve out niches in collagen, gelatin, egg, or specialty dairy ingredients, adding competitive complexity and preventing any single supplier from setting standards across all protein types.
Plant-protein specialists, including Roquette, Ingredion, and Cosucra, are responding to this competitive environment by expanding capacity and developing application-specific innovations. These efforts extend beyond basic pea or wheat flours to create tailored systems for specific applications. For instance, Roquette’s launch of five NUTRALYS variants in 2024, Pea F853M, H85, T Pea 700M/700FL, T Wheat 600L, and Fava S900M, illustrates this strategy. Each ingredient is optimized for applications such as bakery, beverages, or meat analogues, enabling manufacturers to refine texture, solubility, and sensory performance without extensive in-house research and development. Ingredion and Cosucra similarly focus on pea, chicory, and faba solutions, emphasizing protein content, clean-label attributes, viscosity, and emulsification properties. As plant proteins now dominate the European protein market, differentiation increasingly depends on addressing formulation challenges in categories like meat substitutes or high-protein bakery products.
Emerging opportunities in precision-fermentation dairy proteins and algae-derived complete proteins are reshaping the competitive landscape. These segments require navigating long regulatory approval timelines and significant capital investments, favoring well-funded first movers. Precision-fermented whey and casein analogues aim to replicate animal-identical functionality without dairy farming, positioning microbial ingredient developers as both collaborators and potential disruptors to traditional dairy-protein suppliers. Similarly, algae-derived proteins and lipid-rich algae ingredients offer complete protein solutions with added omega-3 or antioxidant functionality, appealing to brands targeting "next-generation" plant-plus concepts in beverages, sports nutrition, and personal care. Partnerships between microbial and algae protein innovators and established ingredient companies are becoming increasingly common, enabling access to application expertise, sales channels, and hybrid formulation opportunities. This evolving ecosystem blurs the lines between animal and plant protein categories, with timing and strategic alliances playing a critical role in determining future growth in the European protein market.
Europe Protein Industry Leaders
-
Archer Daniels Midland Company
-
Roquette Frères
-
Kerry Group plc
-
Royal FrieslandCampina N.V.
-
Arla Foods GmbH
- *Disclaimer: Major Players sorted in no particular order

Recent Industry Developments
- June 2025: Roquette expanded its Nutralys portfolio by introducing two innovative solutions: a textured wheat protein and a textured pea protein. Nutralys T Wheat 600L, the company's first-ever textured wheat protein, was specifically designed to address shifting consumer preferences for fibrous, chicken-style meat alternatives. This solution featured a protein content exceeding 60%, enabling the creation of high-protein products to meet market demands.
- June 2024: Roquette, a leading provider of ingredient solutions, announced the launch of Nutralys Fava S900M, its first-ever fava bean protein isolate, across Europe and North America. This addition to Roquette's Nutralys plant protein portfolio featured a 90% protein content, making it an optimal choice for diverse applications such as meat substitutes, non-dairy alternatives, and baked goods.
- April 2024: Arla Foods Ingredients finalized an agreement to acquire the Whey Nutrition business of Volac, a United Kingdom-based dairy company, for an undisclosed amount. Volac specializes in transforming whey into ingredients primarily used in sports nutrition. As part of this acquisition, Arla Foods Ingredients obtained the Whey Nutrition division by purchasing shares in Volac Whey Nutrition Holdings and its subsidiaries, including Volac Whey Nutrition and Volac Renewable Energy.


Europe Protein Market Report Scope
Animal, Microbial, Plant are covered as segments by Source. Animal Feed, Food and Beverages, Personal Care and Cosmetics, Supplements are covered as segments by End User. Belgium, France, Germany, Italy, Netherlands, Russia, Spain, Turkey, United Kingdom are covered as segments by Country.
By Source
| Animal | Casein and Caseinates |
| Collagen | |
| Egg Protein | |
| Gelatin | |
| Insect Protein | |
| Milk Protein | |
| Whey Protein | |
| Other Animal Protein | |
| Microbial | Algae Protein |
| Mycoprotein | |
| Plant | Hemp Protein |
| Pea Protein | |
| Potato Protein | |
| Rice Protein | |
| Soy Protein | |
| Wheat Protein | |
| Other Plant Protein |
By End User
| Animal Feed | |
| Food and Beverages | Bakery |
| Beverages | |
| Breakfast Cereals | |
| Condiments/Sauces | |
| Confectionery | |
| Dairy and Dairy Alternatives | |
| Meat/Poultry/Seafood and Alternatives | |
| RTE/RTC Foods | |
| Snacks | |
| Personal Care and Cosmetics | |
| Supplements | Baby Food and Infant Formula |
| Elderly and Medical Nutrition | |
| Sport and Dietary Supplements |
By Geography
| Germany |
| United Kingdom |
| Italy |
| France |
| Spain |
| Netherlands |
| Poland |
| Belgium |
| Sweden |
| Rest of Europe |
| By Source | Animal | Casein and Caseinates |
| Collagen | ||
| Egg Protein | ||
| Gelatin | ||
| Insect Protein | ||
| Milk Protein | ||
| Whey Protein | ||
| Other Animal Protein | ||
| Microbial | Algae Protein | |
| Mycoprotein | ||
| Plant | Hemp Protein | |
| Pea Protein | ||
| Potato Protein | ||
| Rice Protein | ||
| Soy Protein | ||
| Wheat Protein | ||
| Other Plant Protein | ||
| By End User | Animal Feed | |
| Food and Beverages | Bakery | |
| Beverages | ||
| Breakfast Cereals | ||
| Condiments/Sauces | ||
| Confectionery | ||
| Dairy and Dairy Alternatives | ||
| Meat/Poultry/Seafood and Alternatives | ||
| RTE/RTC Foods | ||
| Snacks | ||
| Personal Care and Cosmetics | ||
| Supplements | Baby Food and Infant Formula | |
| Elderly and Medical Nutrition | ||
| Sport and Dietary Supplements | ||
| By Geography | Germany | |
| United Kingdom | ||
| Italy | ||
| France | ||
| Spain | ||
| Netherlands | ||
| Poland | ||
| Belgium | ||
| Sweden | ||
| Rest of Europe | ||


Market Definition
- End User - The Protein Ingredients Market operates on a B2B basis. Food, Beverages, Supplements, Animal Feed, and Personal Care & Cosmetic manufacturers are considered to be end-consumers in the market studied. The scope excludes manufacturers buying liquid/dry whey to be used for application as a binding agent or thickener or other non-protein applications.
- Penetration Rate - Penetration Rate is defined as the percentage of Protein-Fortified End User Market Volume in the Overall End User Market Volume.
- Average Protein Content - Average protein content is the average protein content present per 100 g of product manufactured by all end-user companies considered under the scope of this report.
- End User Market Volume - End-user market volume is the consolidated volume of all types and forms of end-user products in the country or region.
| Keyword | Definition |
|---|---|
| Alpha-lactalbumin (α-Lactalbumin) | It is a protein that regulates the production of lactose in the milk of almost all mammalian species. |
| Amino acid | It is an organic compound that contains both amino and carboxylic acid functional groups, which are required for the synthesis of body protein and other important nitrogen-containing compounds, such as creatine, peptide hormones, and some neurotransmitters. |
| Blanching | It is the process of briefly heating vegetables with steam or boiling water. |
| BRC | British Retail Consortium |
| Bread improver | It is a flour-based blend of several components with specific functional properties designed to modify dough characteristics and give quality attributes to bread. |
| BSF | Black Soldier Fly |
| Caseinate | It is a substance produced by adding an alkali to acid casein, a derivative of casein. |
| Celiac disease | Celiac disease is an immune reaction to eating gluten, a protein found in wheat, barley, and rye. |
| Colostrum | It is a milky fluid that’s released by mammals that have recently given birth before breast milk production begins. |
| Concentrate | It is the least processed form of protein and has a protein content ranging from 40-90% by weight. |
| Dry protein basis | It refers to the percentage of "pure protein" present in a supplement after the water in it is completely removed through heat. |
| Dry whey | It is the product resulting from drying fresh whey which has been pasteurized and to which nothing has been added as a preservative. |
| Egg protein | It is a mixture of individual proteins, including ovalbumin, ovomucoid, ovoglobulin, conalbumin, vitellin, and vitellenin. |
| Emulsifier | It is a food additive that facilitates the blending of foods that are immiscible with one another, such as oil and water. |
| Enrichment | It is the process of addition of micronutrients that are lost during the processing of the product. |
| ERS | Economic Research Service of the USDA |
| Extrusion | It is the process of forcing soft mixed ingredients through an opening in a perforated plate or die designed to produce the required shape. The extruded food is then cut to a specific size by blades. |
| Fava | Also known as Faba, it is another word for yellow split beans. |
| FDA | Food and Drug Administration |
| Flaking | It is a process in which typically a cereal grain (like corn, wheat, or rice) is broken down into grits, cooked with flavors and syrups, and then pressed into flakes between cooled rollers. |
| Foaming agent | It is a food ingredient that makes it possible to form or maintain a uniform dispersion of a gaseous phase in a liquid or solid food. |
| Foodservice | It refers to the part of the food industry which includes businesses, institutions, and companies which prepare meals outside the home. It includes restaurants, school and hospital cafeterias, catering operations, and many other formats. |
| Fortification | It is the deliberate addition of micronutrients that are not found in them naturally or which are lost during processing, to improve a food product's nutritional value. |
| FSANZ | Food Standards Australia New Zealand |
| FSIS | Food Safety and Inspection Service |
| FSSAI | Food Safety and Standards Authority of India |
| Gelling agent | It is an ingredient that functions as a stabilizer and thickener to provide thickening without stiffness through the formation of gel. |
| GHG | Greenhouse Gas |
| Gluten | It is a family of proteins found in grains, including wheat, rye, spelt, and barley. |
| Hemp | It is a botanical class of Cannabis sativa cultivars grown specifically for industrial or medicinal use. |
| Hydrolysate | It is a form of protein manufactured by exposing the protein to enzymes that can partially break the bonds between the protein's amino acids and break down large, complicated proteins into smaller pieces. Its processing makes it easier and quicker to digest. |
| Hypoallergenic | It refers to a substance that causes fewer allergic reactions. |
| Isolate | It is the purest and most processed form of protein which has undergone separation to obtain a pure protein fraction. It typically contains ≥ 90% of protein by weight. |
| Keratin | It is a protein that helps form hair, nails, and the outer layer of skin. |
| Lactalbumin | It is the albumin contained in milk and obtained from whey. |
| Lactoferrin | It is an iron‑binding glycoprotein that is present in the milk of most mammals. |
| Lupin | It is the yellow legume seeds of the genus Lupinus. |
| Millenial | Also known as Generation Y or Gen Y, it refers to the people born from 1981 to 1996. |
| Monogastric | It refers to an animal with a single-compartmented stomach. Examples of monogastric include humans, poultry, pigs, horses, rabbits, dogs, and cats. Most monogastric are generally unable to digest much cellulose food materials such as grasses. |
| MPC | Milk protein concentrate |
| MPI | Milk protein isolate |
| MSPI | Methylated soy protein isolate |
| Mycoprotein | Mycoprotein is a form of single-cell protein, also known as fungal protein, derived from fungi for human consumption. |
| Nutricosmetics | It is a category of products and ingredients that act as nutritional supplements to care for skin, nails, and hair natural beauty. |
| Osteoporosis | It is a medical condition in which the bones become brittle and fragile from loss of tissue, typically as a result of hormonal changes, or deficiency of calcium or vitamin D. |
| PDCAAS | Protein digestibility-corrected amino acid score (PDCAAS) is a method of evaluating the quality of a protein based on both the amino acid requirements of humans and their ability to digest it. |
| Per-capita consumption of animal protein | It is the average amount of animal protein (such as milk, whey, gelatin, collagen, and egg proteins) that is readily available for consumption by each person in an actual population. |
| Per-capita consumption of plant protein | It is the average amount of plant protein (such as soy, wheat, pea, oat, and hemp proteins) that is readily available for consumption by each person in an actual population. |
| Quorn | It is a microbial protein manufactured using mycoprotein as an ingredient, in which the fungus culture is dried and mixed with egg albumen or potato protein, which acts as a binder, and then is adjusted in texture and pressed into various forms. |
| Ready-to-Cook (RTC) | It refers to food products that include all of the ingredients, where some preparation or cooking is required through a process that is given on the package. |
| Ready-to-Eat (RTE) | It refers to a food product prepared or cooked in advance, with no further cooking or preparation required before being eaten. |
| RTD | Ready-to-Drink |
| RTS | Ready-to-Serve |
| Saturated fat | It is a type of fat in which the fatty acid chains have all single bonds. It is generally considered unhealthy. |
| Sausage | It is a meat product made of finely chopped and seasoned meat, which may be fresh, smoked, or pickled and which is then usually stuffed into a casing. |
| Seitan | It is a plant-based meat substitute made out of wheat gluten. |
| Softgel | It is a gelatin-based capsule with a liquid fill. |
| SPC | Soy protein concentrate |
| SPI | Soy protein isolate |
| Spirulina | It is a biomass of cyanobacteria that can be consumed by humans and animals. |
| Stabilizer | It is an ingredient added to food products to help maintain or enhance their original texture, and physical and chemical characteristics. |
| Supplementation | It is the consumption or provision of concentrated sources of nutrients or other substances that are intended to supplement nutrients in the diet and is intended to correct nutritional deficiencies. |
| Texturant | It is a specific type of food ingredient that is used to control and alter the mouthfeel and texture of food and beverage products. |
| Thickener | It is an ingredient that is used to increase the viscosity of a liquid or dough and make it thicker, without substantially changing its other properties. |
| Trans fat | Also called trans-unsaturated fatty acids or trans fatty acids, it is a type of unsaturated fat that naturally occurs in small amounts in meat. |
| TSP | Textured soy protein |
| TVP | Textured vegetable protein |
| WPC | Whey protein concentrate |
| WPI | Whey protein isolate |


Research Methodology
Mordor Intelligence follows a four-step methodology in all our reports.
- Step-1: Identify Key Variables: The quantifiable key variables (industry and extraneous) pertaining to the specific product segment and country are selected from a group of relevant variables & factors based on desk research & literature review; along with primary expert inputs. These variables are further confirmed through regression modeling (wherever required).
- Step-2: Build a Market Model: In order to build a robust forecasting methodology, the variables and factors identified in Step-1 are tested against available historical market numbers. Through an iterative process, the variables required for market forecast are set and the model is built on the basis of these variables.
- Step-3: Validate and Finalize: In this important step, all market numbers, variables and analyst calls are validated through an extensive network of primary research experts from the market studied. The respondents are selected across levels and functions to generate a holistic picture of the market studied.
- Step-4: Research Outputs: Syndicated Reports, Custom Consulting Assignments, Databases & Subscription Platforms


