Market Overview
| Study Period | 2021 - 2031 |
|---|---|
| Forecast Data Period | 2026 - 2031 |
| Historical Data Period | 2021 - 2024 |
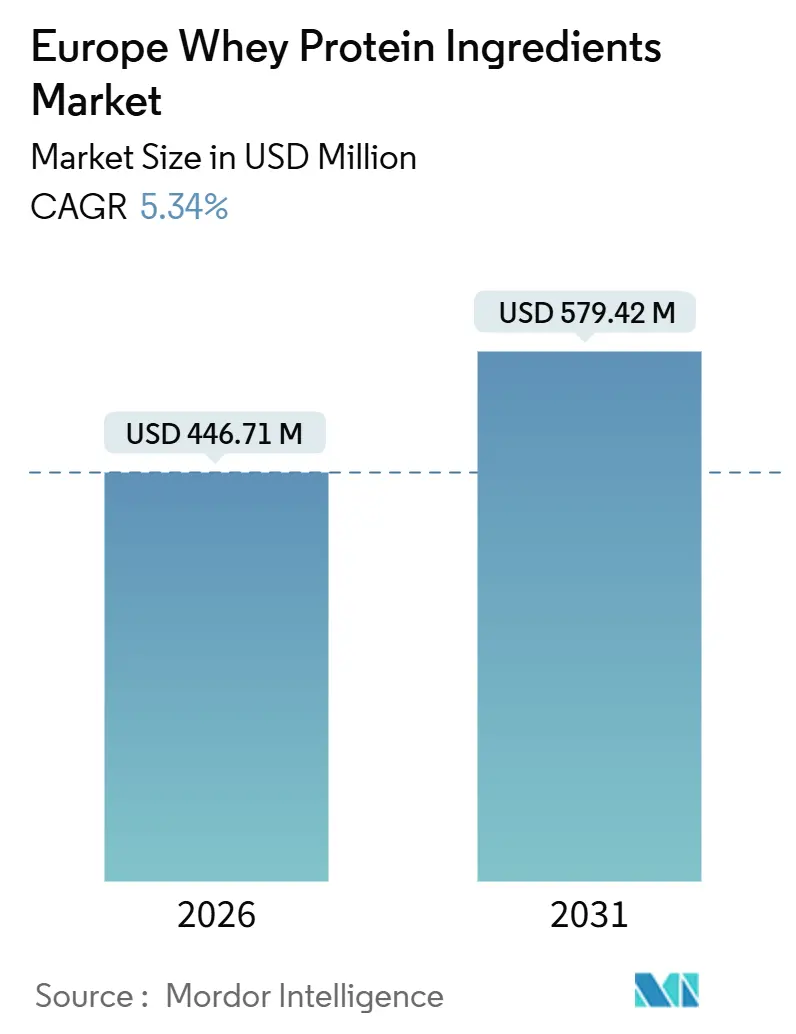
| Market Size (2026) | USD 446.71 Million |
| Market Size (2031) | USD 579.42 Million |
| Growth Rate (2026 - 2031) | 5.34% CAGR |
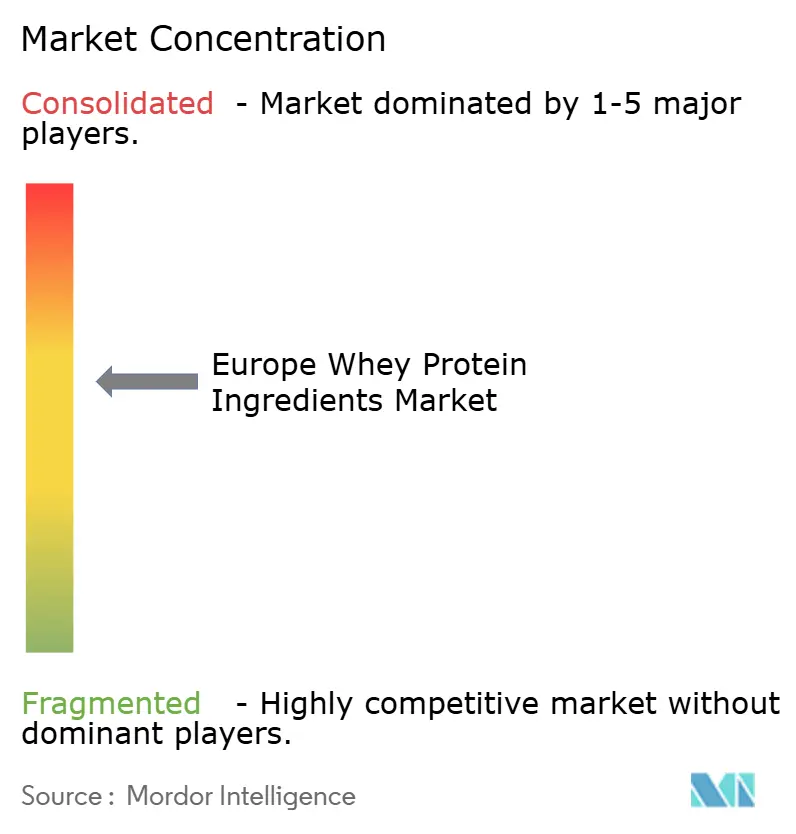
| Market Concentration | Medium |
Major Players
*Disclaimer: Major Players sorted in no particular order Image © Mordor Intelligence. Reuse requires attribution under CC BY 4.0. |
|
Europe Whey Protein Ingredients Market Analysis by Mordor Intelligence
The Europe Whey Protein Ingredients Market was valued at USD 446.71 million in 2026 and is expected to grow to USD 579.42 million by 2031, registering a CAGR of 5.34% during the forecast period. Increasing health consciousness among European consumers has led manufacturers to focus on protein enrichment as a key strategy to enhance product value. Whey protein is gaining preference due to its recognized nutritional benefits and versatility across various applications. Market growth is further driven by the rising demand for convenient and functional protein formats, particularly ready-to-consume and on-the-go products that align with modern lifestyles. Advances in whey protein processing are improving taste, texture, and stability, enabling brands to introduce consumer-friendly protein products without compromising sensory quality.
Key Report Takeaways
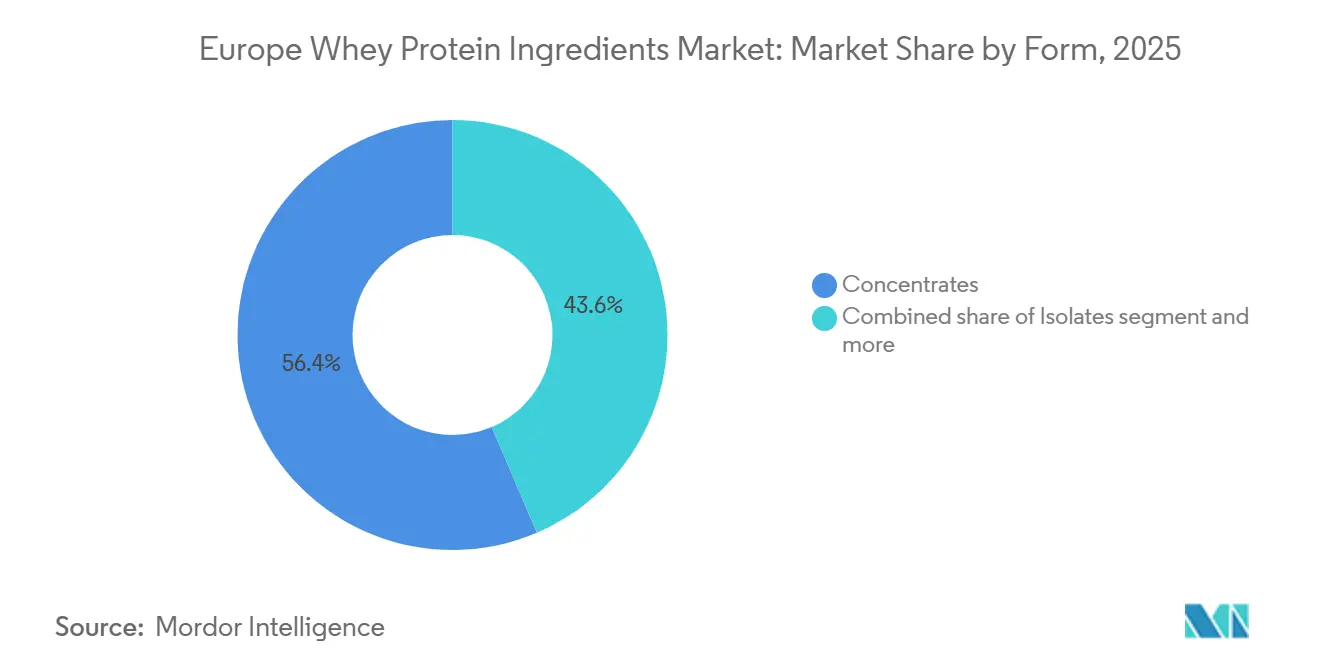
- By form, concentrates held 56.43% of the Europe whey protein ingredients market share in 2025, while isolates are forecast to post a 6.28% CAGR through 2031.
- By category, conventional grades dominated with an 84.74% share in 2025; organic whey is expected to expand at a 7.08% CAGR to 2031.
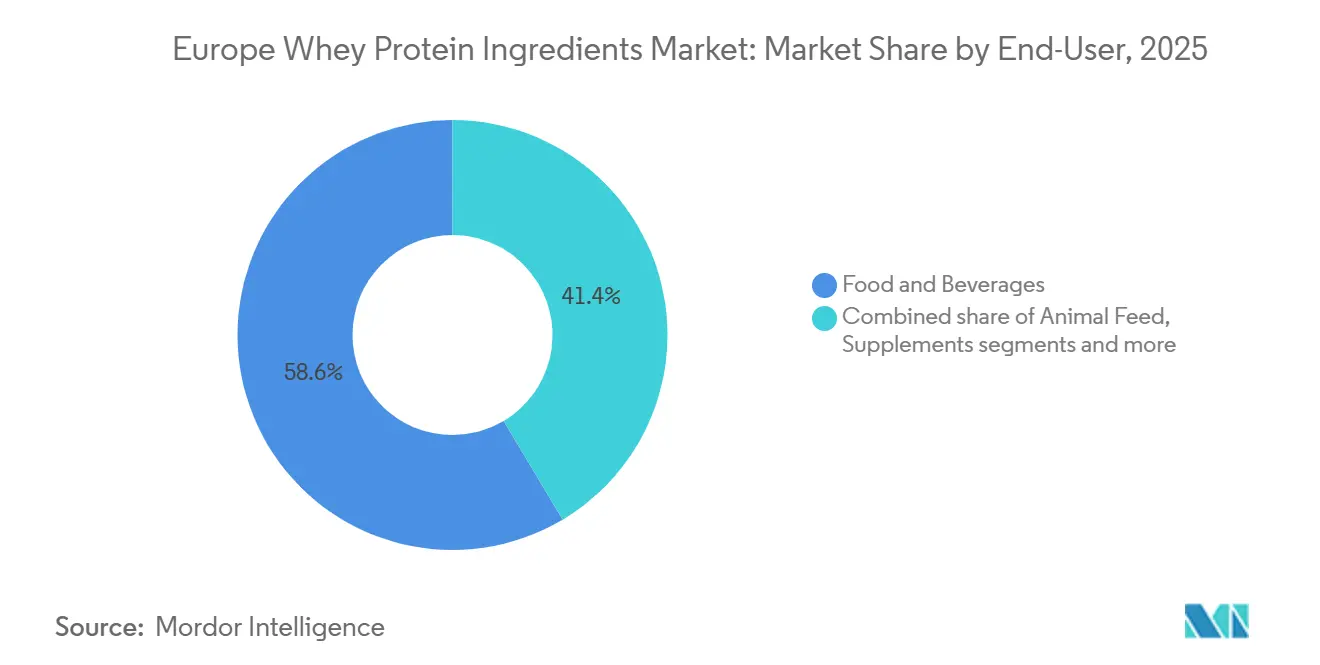
- By end-user, food and beverages accounted for 58.56% of volume in 2025, whereas supplements are projected to grow at a 6.78% CAGR over the same horizon.
- By geography, Germany commanded 24.43% of the 2025 market, and Turkey is set to register the fastest 5.78% CAGR through 2031.
Note: Market size and forecast figures in this report are generated using Mordor Intelligence’s proprietary estimation framework, updated with the latest available data and insights as of January 2026.
Europe Whey Protein Ingredients Market Trends and Insights
Drivers Impact Analysis*
| Driver | (~) % Impact on CAGR Forecast | Geographic Relevance | Impact Timeline |
|---|---|---|---|
| Strong growth of sports nutrition and active lifestyle products | +1.2% | Germany, United Kingdom, France, Netherlands, Poland | Medium term (2-4 years) |
| Growing health and wellness consciousness among consumers | +0.9% | Pan-European, with elevated penetration in Western Europe | Long term (≥ 4 years) |
| Increasing preference for clean-label and naturally sourced proteins | +0.8% | Germany, United Kingdom, Netherlands, Sweden, France | Medium term (2-4 years) |
| Rising focus on muscle health and healthy aging nutrition | +1.0% | Germany, Italy, France, Spain, United Kingdom | Long term (≥ 4 years) |
| Higher interest in weight management and satiety-focused diets | +0.6% | United Kingdom, Germany, France, Spain | Short term (≤ 2 years) |
| Innovation in whey protein formats is supporting the market growth | +0.9% | Germany, United Kingdom, Netherlands, France | Medium term (2-4 years) |
| Source: Mordor Intelligence | |||
Strong growth of sports nutrition and active lifestyle products
The strong growth of sports nutrition and active lifestyle products is a key driver for the Europe whey protein ingredients market. Increasing participation in regular physical activity has significantly boosted the demand for convenient, high-protein formats that support performance, recovery, and muscle maintenance. As more consumers adopt gym routines, endurance sports, and structured fitness habits, whey protein continues to be a highly preferred ingredient in products tailored for strength-building and post-workout recovery. This is particularly evident in protein powders, ready-to-mix drinks, and high-protein convenience nutrition, which cater to the needs of both professional athletes and fitness enthusiasts. Additionally, the growing awareness of the health benefits associated with protein consumption has further fueled the market's expansion. For instance, Sport England reported that in 2024, 30 million adults in England engaged in sports or physical activities weekly, highlighting the widespread adoption of active lifestyles [1]Source: Sport England, "Record numbers playing sport and taking part in physical activity", sportengland.org. This increasing focus on fitness and health significantly drives protein consumption among both core athletes and mainstream consumers.
Growing health and wellness consciousness among consumers
The growing awareness of health and wellness among consumers is significantly influencing the market, as individuals transition from occasional dieting to a consistent focus on improving daily nutrition. Across Europe, there is an increasing emphasis on protein intake, food quality, and functional benefits, with higher-protein consumption being associated with goals such as maintaining lean muscle, enhancing satiety, supporting energy levels, and achieving overall fitness objectives. This trend is expanding the use of whey protein beyond traditional sports nutrition into everyday consumption through high-protein snacks, fortified dairy products, functional beverages, and convenient nutrition formats. Consumers are seeking products that are both healthy and satisfying. Additionally, wellness-focused buyers are prioritizing simple, high-quality proteins with strong nutritional credibility. Whey protein remains a preferred choice due to its complete amino acid profile and established reputation for performance.
Increasing preference for clean-label and naturally sourced proteins
Increasing consumer preference for clean-label and naturally sourced proteins is a significant driver for the Europe whey protein ingredients market. Consumers are seeking protein products that are simple, recognizable, and closer to nature, with fewer concerns related to processing. This trend is encouraging manufacturers to reformulate and enhance their protein offerings, focusing on ingredient transparency and minimal processing claims. This is particularly evident in high-protein dairy products, beverages, and everyday nutrition formats, where label scrutiny is more pronounced. For instance, Lactalis offers Pronativ Whey Protein, which emphasizes clean-label values by highlighting minimal processing and the absence of chemicals or additives. This approach aligns with the growing consumer demand for naturally sourced protein solutions, reinforcing the importance of clean-label positioning in driving market growth. Additionally, the shift toward clean-label products is not only shaping product innovation but also influencing marketing strategies, as companies aim to build trust and loyalty among health-conscious consumers by addressing their expectations for transparency and natural ingredients.
Rising focus on muscle health and healthy aging nutrition
The growing emphasis on muscle health and nutrition for healthy aging is a key driver of the Europe whey protein ingredients market. Protein consumption is increasingly associated not only with fitness objectives but also with long-term mobility, strength preservation, and overall quality of life. In Europe, middle-aged and older consumers are becoming more aware of age-related muscle loss and the importance of consistent dietary protein intake to support muscle maintenance, recovery, and functional independence. This trend is driving the integration of whey protein ingredients into everyday nutrition products. Manufacturers are developing offerings focused on strength support, active aging, and daily protein requirements, rather than solely targeting post-workout recovery. Whey protein is particularly well-suited for this market due to its compatibility with muscle-related nutritional needs. It is widely incorporated into products aimed at sustained wellness, including convenient high-protein foods and specialized nutrition solutions for older adults.
Restraints Impact Analysis*
| Restraint | (~) % Impact on CAGR Forecast | Geographic Relevance | Impact Timeline |
|---|---|---|---|
| Rising lactose intolerance and dairy sensitivity concerns | -0.8% | Italy, Poland, France, Spain, with lower impact in Northern Europe | Long term (≥ 4 years) |
| High product pricing and premium positioning | -0.6% | Southern and Eastern Europe, price-sensitive segments | Medium term (2-4 years) |
| Competition from plant-based proteins | -0.7% | Germany, United Kingdom, Netherlands, France | Long term (≥ 4 years) |
| Processing stability limitations in high-heat applications | -0.3% | Pan-European, affecting bakery and UHT beverage segments | Medium term (2-4 years) |
| Source: Mordor Intelligence | |||
Rising lactose intolerance and dairy sensitivity concerns
Rising concerns about lactose intolerance and dairy sensitivity represent a significant restraint for the Europe whey protein ingredients market. An increasing number of consumers are actively reducing or avoiding dairy-based products due to digestive discomfort and perceived risks of intolerance. This trend poses a challenge for the adoption of whey protein in mass-market foods, beverages, and supplements, particularly in products where whey is associated with lactose-related bloating or stomach sensitivity. As a result, many consumers are opting for dairy-free alternatives, which are perceived as safer and more suitable for sensitive individuals. Supporting this restraint, data from the Food Standards Agency indicates that in 2024, approximately 12% of survey respondents in England, Wales, and Northern Ireland reported having a food intolerance, underscoring the size of the consumer segment that may be reluctant to purchase whey-based nutrition products. This highlights the need for manufacturers to address these concerns through product innovation, such as lactose-free whey protein options, to cater to this growing consumer base.
High product pricing and premium positioning
High product pricing and premium positioning serve as restraints in the Europe whey protein ingredients market, particularly for advanced whey formats marketed for their purity, performance, and specialized nutrition benefits. Many whey-based products, especially those targeting sports nutrition, medical nutrition, and lifestyle wellness, are priced at a premium due to higher processing requirements, strict quality standards, and brand-driven value perceptions. This premium positioning can limit adoption among price-sensitive consumers, preventing whey protein from becoming a regular dietary staple. This is particularly evident when consumers compare it to more affordable protein sources or alternative nutrition options. In mass-market channels, the perception of whey as a fitness-specific or specialized product further reduces purchase frequency, slowing volume growth despite the growing interest in high-protein diets.
*Our forecasts treat driver/restraint impacts as directional, not additive. The impact forecasts reflect baseline growth, mix effects, and variable interactions.
Segment Analysis
By Form: Isolates Gain Share Through Clear-Whey Demand
Whey protein concentrates (WPC) are projected to maintain a 56.43% value share in 2025, primarily due to their strong balance of protein enrichment, functionality, and commercial scalability across various food and nutrition formats. Manufacturers prefer WPC for its reliable performance in texture-building, water binding, emulsification, and creaminess enhancement, making it ideal for high-volume applications without significantly increasing formulation complexity. Additionally, Whey protein concentrates are driving market growth as it aligns with Europe’s shift toward high-protein mainstream consumption. This ingredient supports higher protein claims while maintaining acceptable taste and mouthfeel for a broader consumer base, extending beyond athletes.
Whey protein isolates (WPI) are expected to grow at a 6.28% CAGR between 2026 and 2031 in the Europe whey protein ingredients market. This growth is attributed to the region’s increasing preference for high-purity, performance-oriented, and lifestyle-friendly protein solutions. The segment is fueled by rising demand for lean protein enrichment in products targeting fitness, weight management, and clean nutrition. WPI is increasingly used in ready-to-drink protein beverages, clear/high-protein drinks, and premium sports nutrition products, as it offers higher protein density with minimal additional nutritional components. Furthermore, Whey protein isolates support a smoother consumer experience, meeting modern expectations for lighter mouthfeel and improved drinkability in everyday protein consumption.


By Category: Organic Whey Rides Farm-to-Fork Momentum
Conventional whey accounted for a significant 84.74% share in 2025 in the Europe whey protein ingredients market. This dominance is primarily due to its widespread availability and operational reliability for high-volume protein fortification across food, beverage, and nutrition applications. The category continues to drive the market, supported by strong supply chain integration within Europe’s established dairy processing ecosystem. Conventional whey proteins are produced at scale, benefiting from mature manufacturing capabilities, consistent specifications, and predictable functionality across various formulations. Additionally, its leading position is reinforced by mainstream consumer preferences for performance, familiar taste, and proven nutrition over certification-based differentiation, making conventional whey the default choice for everyday protein products.
Organic whey protein is projected to grow at a 7.08% CAGR from 2026 to 2031 in the Europe whey protein ingredients market. This growth is driven by Europe’s increasing shift toward clean-label nutrition, sustainability-focused purchasing, and premium protein positioning. The expanding organic ecosystem in key European markets, particularly Germany, strongly supports this trend. For example, the German Federation of Organic Food Producers (BÖLW) reported that organic food revenues in Germany reached EUR 16.99 billion in 2024, indicating that organic purchasing has transitioned from a niche to a regular consumption habit [2]Source: German Federation of Organic Food Producers (BÖLW), "Revenue from organic food in Germany", boelw.de. As consumer trust in organic products strengthens across Europe, whey protein brands are leveraging organic certification to enhance value propositions centered on traceability, responsible sourcing, and minimal processing. These attributes are particularly significant in sports nutrition, lifestyle nutrition, and premium functional food segments.
By End-User: Supplements Outpace Food as Aging and Fitness Converge
The food and beverages segment accounted for a 58.56% share in 2025 in the Europe whey protein ingredients market, highlighting the expansion of whey protein beyond sports supplements into everyday consumption formats. This segment drives the market as manufacturers in mainstream food categories increasingly use whey protein for protein fortification, texture enhancement, and functional performance in frequently purchased products. High-protein positioning has become a key strategy in Europe for foods focused on satiety, balanced nutrition, and active wellness. This trend is boosting whey protein inclusion in widely consumed products such as dairy-based items, beverages, bakery goods, and protein-rich snacks. Additionally, the food and beverage industry benefits from whey protein's ability to enhance smooth mouthfeel, stability, and sensory appeal, enabling brands to increase protein content without compromising taste and texture, an essential factor for mass-market acceptance.
The supplements segment in the Europe whey protein ingredients market is projected to grow at a 6.78% CAGR from 2026 to 2031. This growth is driven by the increasing influence of sports nutrition, elderly/medical nutrition, and infant formula sub-segments. Elderly and medical nutrition, in particular, is emerging as a high-margin channel due to its premium positioning and specialized formulation needs. The sports nutrition segment continues to expand whey protein in performance and recovery-focused products. Meanwhile, the medical nutrition segment is driving demand for clinically oriented, high-quality protein solutions aimed at supporting muscle maintenance, strength, and recovery in older adults. For example, European Commission reports that as of 2024, over one-fifth (21.6%) of the EU population was aged 65 years and older, underscoring the long-term demand for nutrition products that promote healthy aging and condition-specific dietary management [3]Source: European Commission, "Population structure and ageing", ec.europa.eu.
Geography Analysis
ermany is projected to hold a 24.43% share of the European whey protein ingredients market in 2025, driven by robust end-market demand and structural supply advantages. The country's well-established sports nutrition market continues to consume significant whey volumes, extending beyond gym-focused consumers to include broader lifestyle nutrition applications. On the supply side, Germany benefits from advanced dairy-processing infrastructure, ensuring consistent production, quality standardization, and scalable output tailored to food, beverage, and supplement requirements. Additionally, strategic re-export flows to neighboring European markets position Germany as a regional hub, where domestic manufacturing capabilities support cross-border distribution and trade-driven volume stability.
Turkey is expected to grow at a 5.78% CAGR between 2026 and 2031, representing the fastest growth rate among all geographies. This growth is attributed to increasing demand for whey protein ingredients, driven by evolving consumption trends and industrial development. The rising fitness culture and growing adoption of sports nutrition are expanding protein supplementation beyond early adopters to a broader urban consumer base. Concurrently, Turkey's expanding domestic dairy-processing capacity is enhancing supply-side readiness, ensuring greater availability and consistency for local formulation needs. Furthermore, government incentives promoting value-added food exports are encouraging investments in higher-margin dairy ingredients, strengthening Turkey's role as a growing production and consumption hub within the European whey protein market.
In addition to Germany and Turkey, markets such as the United Kingdom, France, Italy, Spain, Poland, and the Netherlands are also experiencing above-average growth. This growth is influenced by increasing sports-nutrition penetration across mainstream channels, which is driving volume expansion. Aging demographics are further boosting the demand for whey proteins in active-aging and specialized nutrition segments. Simultaneously, rising investments in organic dairy infrastructure are supporting the adoption of premium whey products in select markets, where traceability, certification-driven demand, and higher-value formulations are gaining traction.

Competitive Landscape
The Europe whey protein ingredients market is moderately concentrated, with competition driven by a combination of large, integrated dairy processors and specialized sports-nutrition ingredient suppliers. Key players in the region include Agrial S.A., Arla Foods amba, Carbery Group, Glanbia plc, and Groupe Lactalis S.A. These companies benefit from robust procurement networks, established dairy-processing capabilities, and long-standing relationships with food, beverage, and supplement manufacturers. Competitive strength in this market is closely linked to the ability to deliver consistent quality, scalable production volumes, application performance, and compliance with stringent regional food standards. These factors enable incumbents to maintain their market share in mainstream and high-volume protein fortification segments.
New opportunities are emerging in rapidly evolving product formats such as clear-whey beverages, elderly medical nutrition, and hybrid dairy–plant protein formulations. These segments demand higher formulation complexity and sensory performance, making them strategic areas of competition. Success in these categories relies less on large-scale commodity supply and more on specialized capabilities, including advanced processing techniques, stability performance, and superior taste delivery. In these areas, incumbents often face challenges related to enzymatic-hydrolysis expertise and high-precision flavor optimization. This creates opportunities for agile ingredient developers and formulation-focused partners to secure contracts through innovation-driven performance rather than price competition.
Emerging technologies beyond traditional dairy processing are also influencing competitive dynamics. Precision-fermentation startups, though still in pre-commercial stages in Europe, are gaining venture capital interest for producing animal-free whey proteins through microbial fermentation. These innovations have the potential to reshape the market by addressing sustainability concerns, enhancing supply flexibility, and supporting dairy-free claims. While these solutions do not pose an immediate volume threat, they are strategically significant as they offer brands a way to deliver whey-like protein benefits without relying on conventional dairy streams. In response, incumbent players are likely to explore partnerships, invest selectively in next-generation processing technologies, and upgrade their portfolios to focus on innovation. These strategies aim to protect premium market segments and capitalize on emerging high-growth applications.
Europe Whey Protein Ingredients Industry Leaders
-
Agrial S.A.
-
Arla Foods amba
-
Carbery Group
-
Glanbia plc
-
Groupe Lactalis S.A.
- *Disclaimer: Major Players sorted in no particular order

Recent Industry Developments
- November 2025: Tirlán has announced a EUR 126 million investment in a whey processing facility at its Ballyragget site in Kilkenny. The facility will specialize in producing an advanced nutritional whey protein product portfolio, including clear whey protein.
- March 2025: FrieslandCampina Ingredients introduced Nutri Whey ProHeat, an innovative heat-stable whey protein solution designed to meet the specific needs of the active nutrition segment within the nutraceutical market.
- November 2024: Arla Foods Ingredients has introduced a new whey protein hydrolysate, Lacprodan DI-3092, aimed at addressing critical challenges in peptide-based medical nutrition. The product provides 10 g of protein per 100 ml.


Europe Whey Protein Ingredients Market Report Scope
Whey protein is defined as a high-quality, water-soluble, complete protein typically derived as a byproduct of the dairy industry during the cheese-making or paneer process.
The Europe whey protein ingredients market is segmented by form, category, end-user, and geography. By form, the market is segmented into Isolates, Concentrates, and Hydrolyzed/Textured. By Category, the market is segmented into Conventional and Organic. By end-user, the market is segmented into animal feed, food and beverages, personal care and cosmetics, and supplements. The food and beverages segment is further segmented into bakery, beverages, breakfast cereals, condiments/sauces, dairy and dairy alternative products, meat/poultry/seafood alternatives, RTE/RTC Meals, and snacks. Similarly, the supplements segment is further segmented into baby food and infant formula, elderly nutrition and medical nutrition, and sport/performance nutrition. By geography, the market is segmented into Germany, the United Kingdom, Italy, France, Spain, the Netherlands, Poland, Belgium, Sweden, and the Rest of Europe. The market sizing has been done in value terms in USD and volume in tons for all the abovementioned segments.
By Form
| Isolates |
| Concentrates |
| Hydrolyzed/Textured |
By Category
| Conventional |
| Organic |
By End-User
| Animal Feed | |
| Food and Beverages | Bakery |
| Beverages | |
| Breakfast Cereals | |
| Condiments/Sauces | |
| Dairy and Dairy Alternatives | |
| Meat/Poultry/Seafood Alternatives | |
| RTE/RTC Meals | |
| Snacks | |
| Personal Care and Cosmetics | |
| Supplements | Baby Food and Infant Formula |
| Elderly and Medical Nutrition | |
| Sport/Performance Nutrition |
By Geography
| Germany |
| United Kingdom |
| Italy |
| France |
| Spain |
| Netherlands |
| Poland |
| Belgium |
| Sweden |
| Rest of Europe |
| By Form | Isolates | |
| Concentrates | ||
| Hydrolyzed/Textured | ||
| By Category | Conventional | |
| Organic | ||
| By End-User | Animal Feed | |
| Food and Beverages | Bakery | |
| Beverages | ||
| Breakfast Cereals | ||
| Condiments/Sauces | ||
| Dairy and Dairy Alternatives | ||
| Meat/Poultry/Seafood Alternatives | ||
| RTE/RTC Meals | ||
| Snacks | ||
| Personal Care and Cosmetics | ||
| Supplements | Baby Food and Infant Formula | |
| Elderly and Medical Nutrition | ||
| Sport/Performance Nutrition | ||
| By Geography | Germany | |
| United Kingdom | ||
| Italy | ||
| France | ||
| Spain | ||
| Netherlands | ||
| Poland | ||
| Belgium | ||
| Sweden | ||
| Rest of Europe | ||


Market Definition
- End User - The Protein Ingredients Market operates on a B2B basis. Food, Beverages, Supplements, Animal Feed, and Personal Care & Cosmetic manufacturers are considered to be end-consumers in the market studied. The scope excludes manufacturers buying liquid/dry whey to be used for application as a binding agent or thickener or other non-protein applications.
- Penetration Rate - Penetration Rate is defined as the percentage of Protein-Fortified End User Market Volume in the Overall End User Market Volume.
- Average Protein Content - Average protein content is the average protein content present per 100 g of product manufactured by all end-user companies considered under the scope of this report.
- End User Market Volume - End-user market volume is the consolidated volume of all types and forms of end-user products in the country or region.
| Keyword | Definition |
|---|---|
| Alpha-lactalbumin (α-Lactalbumin) | It is a protein that regulates the production of lactose in the milk of almost all mammalian species. |
| Amino acid | It is an organic compound that contains both amino and carboxylic acid functional groups, which are required for the synthesis of body protein and other important nitrogen-containing compounds, such as creatine, peptide hormones, and some neurotransmitters. |
| Blanching | It is the process of briefly heating vegetables with steam or boiling water. |
| BRC | British Retail Consortium |
| Bread improver | It is a flour-based blend of several components with specific functional properties designed to modify dough characteristics and give quality attributes to bread. |
| BSF | Black Soldier Fly |
| Caseinate | It is a substance produced by adding an alkali to acid casein, a derivative of casein. |
| Celiac disease | Celiac disease is an immune reaction to eating gluten, a protein found in wheat, barley, and rye. |
| Colostrum | It is a milky fluid that’s released by mammals that have recently given birth before breast milk production begins. |
| Concentrate | It is the least processed form of protein and has a protein content ranging from 40-90% by weight. |
| Dry protein basis | It refers to the percentage of "pure protein" present in a supplement after the water in it is completely removed through heat. |
| Dry whey | It is the product resulting from drying fresh whey which has been pasteurized and to which nothing has been added as a preservative. |
| Egg protein | It is a mixture of individual proteins, including ovalbumin, ovomucoid, ovoglobulin, conalbumin, vitellin, and vitellenin. |
| Emulsifier | It is a food additive that facilitates the blending of foods that are immiscible with one another, such as oil and water. |
| Enrichment | It is the process of addition of micronutrients that are lost during the processing of the product. |
| ERS | Economic Research Service of the USDA |
| Extrusion | It is the process of forcing soft mixed ingredients through an opening in a perforated plate or die designed to produce the required shape. The extruded food is then cut to a specific size by blades. |
| Fava | Also known as Faba, it is another word for yellow split beans. |
| FDA | Food and Drug Administration |
| Flaking | It is a process in which typically a cereal grain (like corn, wheat, or rice) is broken down into grits, cooked with flavors and syrups, and then pressed into flakes between cooled rollers. |
| Foaming agent | It is a food ingredient that makes it possible to form or maintain a uniform dispersion of a gaseous phase in a liquid or solid food. |
| Foodservice | It refers to the part of the food industry which includes businesses, institutions, and companies which prepare meals outside the home. It includes restaurants, school and hospital cafeterias, catering operations, and many other formats. |
| Fortification | It is the deliberate addition of micronutrients that are not found in them naturally or which are lost during processing, to improve a food product's nutritional value. |
| FSANZ | Food Standards Australia New Zealand |
| FSIS | Food Safety and Inspection Service |
| FSSAI | Food Safety and Standards Authority of India |
| Gelling agent | It is an ingredient that functions as a stabilizer and thickener to provide thickening without stiffness through the formation of gel. |
| GHG | Greenhouse Gas |
| Gluten | It is a family of proteins found in grains, including wheat, rye, spelt, and barley. |
| Hemp | It is a botanical class of Cannabis sativa cultivars grown specifically for industrial or medicinal use. |
| Hydrolysate | It is a form of protein manufactured by exposing the protein to enzymes that can partially break the bonds between the protein's amino acids and break down large, complicated proteins into smaller pieces. Its processing makes it easier and quicker to digest. |
| Hypoallergenic | It refers to a substance that causes fewer allergic reactions. |
| Isolate | It is the purest and most processed form of protein which has undergone separation to obtain a pure protein fraction. It typically contains ≥ 90% of protein by weight. |
| Keratin | It is a protein that helps form hair, nails, and the outer layer of skin. |
| Lactalbumin | It is the albumin contained in milk and obtained from whey. |
| Lactoferrin | It is an iron‑binding glycoprotein that is present in the milk of most mammals. |
| Lupin | It is the yellow legume seeds of the genus Lupinus. |
| Millenial | Also known as Generation Y or Gen Y, it refers to the people born from 1981 to 1996. |
| Monogastric | It refers to an animal with a single-compartmented stomach. Examples of monogastric include humans, poultry, pigs, horses, rabbits, dogs, and cats. Most monogastric are generally unable to digest much cellulose food materials such as grasses. |
| MPC | Milk protein concentrate |
| MPI | Milk protein isolate |
| MSPI | Methylated soy protein isolate |
| Mycoprotein | Mycoprotein is a form of single-cell protein, also known as fungal protein, derived from fungi for human consumption. |
| Nutricosmetics | It is a category of products and ingredients that act as nutritional supplements to care for skin, nails, and hair natural beauty. |
| Osteoporosis | It is a medical condition in which the bones become brittle and fragile from loss of tissue, typically as a result of hormonal changes, or deficiency of calcium or vitamin D. |
| PDCAAS | Protein digestibility-corrected amino acid score (PDCAAS) is a method of evaluating the quality of a protein based on both the amino acid requirements of humans and their ability to digest it. |
| Per-capita consumption of animal protein | It is the average amount of animal protein (such as milk, whey, gelatin, collagen, and egg proteins) that is readily available for consumption by each person in an actual population. |
| Per-capita consumption of plant protein | It is the average amount of plant protein (such as soy, wheat, pea, oat, and hemp proteins) that is readily available for consumption by each person in an actual population. |
| Quorn | It is a microbial protein manufactured using mycoprotein as an ingredient, in which the fungus culture is dried and mixed with egg albumen or potato protein, which acts as a binder, and then is adjusted in texture and pressed into various forms. |
| Ready-to-Cook (RTC) | It refers to food products that include all of the ingredients, where some preparation or cooking is required through a process that is given on the package. |
| Ready-to-Eat (RTE) | It refers to a food product prepared or cooked in advance, with no further cooking or preparation required before being eaten. |
| RTD | Ready-to-Drink |
| RTS | Ready-to-Serve |
| Saturated fat | It is a type of fat in which the fatty acid chains have all single bonds. It is generally considered unhealthy. |
| Sausage | It is a meat product made of finely chopped and seasoned meat, which may be fresh, smoked, or pickled and which is then usually stuffed into a casing. |
| Seitan | It is a plant-based meat substitute made out of wheat gluten. |
| Softgel | It is a gelatin-based capsule with a liquid fill. |
| SPC | Soy protein concentrate |
| SPI | Soy protein isolate |
| Spirulina | It is a biomass of cyanobacteria that can be consumed by humans and animals. |
| Stabilizer | It is an ingredient added to food products to help maintain or enhance their original texture, and physical and chemical characteristics. |
| Supplementation | It is the consumption or provision of concentrated sources of nutrients or other substances that are intended to supplement nutrients in the diet and is intended to correct nutritional deficiencies. |
| Texturant | It is a specific type of food ingredient that is used to control and alter the mouthfeel and texture of food and beverage products. |
| Thickener | It is an ingredient that is used to increase the viscosity of a liquid or dough and make it thicker, without substantially changing its other properties. |
| Trans fat | Also called trans-unsaturated fatty acids or trans fatty acids, it is a type of unsaturated fat that naturally occurs in small amounts in meat. |
| TSP | Textured soy protein |
| TVP | Textured vegetable protein |
| WPC | Whey protein concentrate |
| WPI | Whey protein isolate |


Research Methodology
Mordor Intelligence follows a four-step methodology in all our reports.
- Step-1: Identify Key Variables: The quantifiable key variables (industry and extraneous) pertaining to the specific product segment and country are selected from a group of relevant variables & factors based on desk research & literature review; along with primary expert inputs. These variables are further confirmed through regression modeling (wherever required).
- Step-2: Build a Market Model: In order to build a robust forecasting methodology, the variables and factors identified in Step-1 are tested against available historical market numbers. Through an iterative process, the variables required for market forecast are set and the model is built on the basis of these variables.
- Step-3: Validate and Finalize: In this important step, all market numbers, variables and analyst calls are validated through an extensive network of primary research experts from the market studied. The respondents are selected across levels and functions to generate a holistic picture of the market studied.
- Step-4: Research Outputs: Syndicated Reports, Custom Consulting Assignments, Databases & Subscription Platforms


