Market Overview
| Study Period | 2021 - 2031 |
|---|---|
| Forecast Data Period | 2026 - 2031 |
| Historical Data Period | 2021 - 2024 |
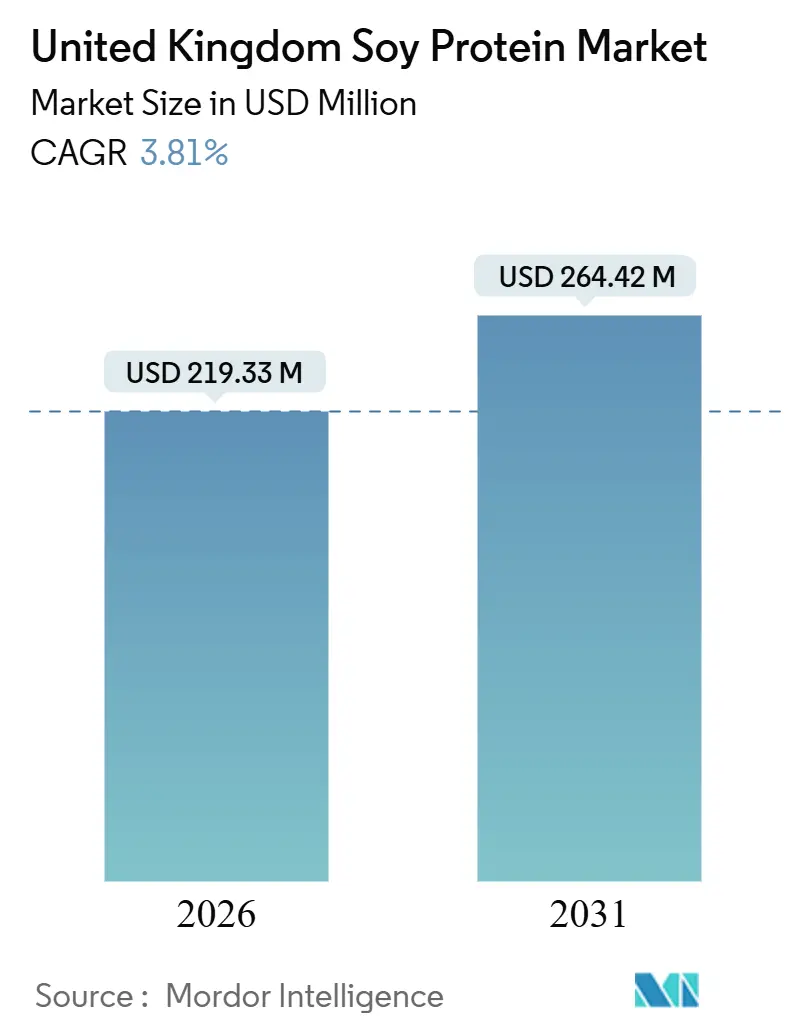
| Market Size (2026) | USD 219.33 Million |
| Market Size (2031) | USD 264.42 Million |
| Growth Rate (2026 - 2031) | 3.81% CAGR |
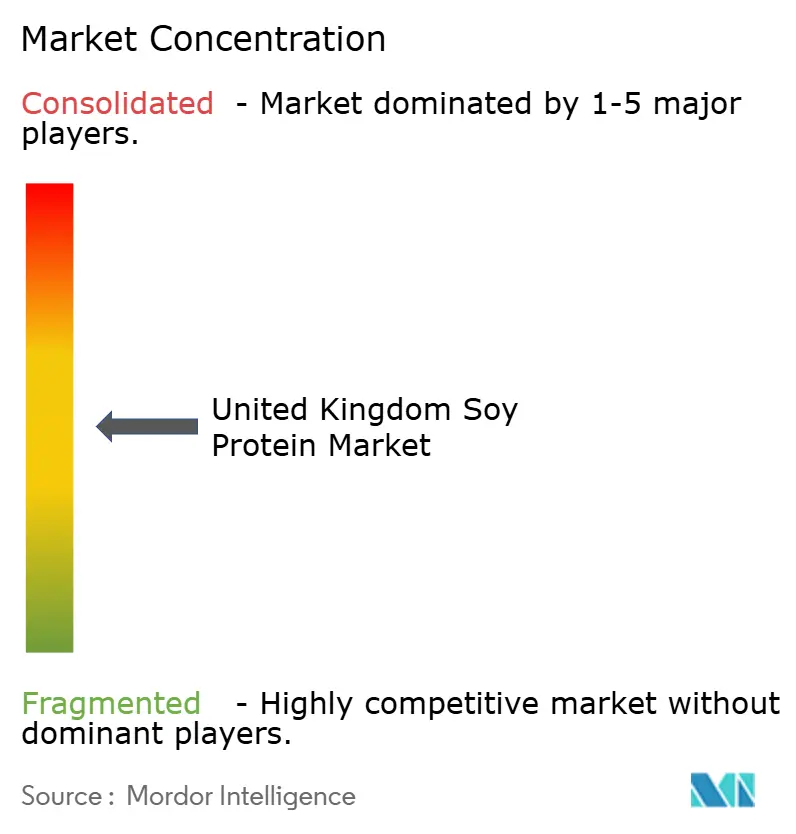
| Market Concentration | Medium |
Major Players
*Disclaimer: Major Players sorted in no particular order Image © Mordor Intelligence. Reuse requires attribution under CC BY 4.0. |
|
United Kingdom Soy Protein Market Analysis by Mordor Intelligence
The United Kingdom soy protein market size is estimated to be valued at USD 219.33 million in 2026 and is forecast to reach USD 264.42 million by 2031, advancing at a 3.81% CAGR during 2026-2031. Demand momentum stems from plant-based diet adoption, high-fat-high-sugar (HFSS) reformulation incentives, and mainstream fitness culture, while headwinds include competition from domestically grown pea and oat proteins, commodity-price swings, and consumer concerns regarding genetically modified organisms and deforestation. Market participants respond with vertical integration, enzyme innovation, and sustainability certifications to protect their share in a moderately fragmented landscape.
Key Report Takeaways
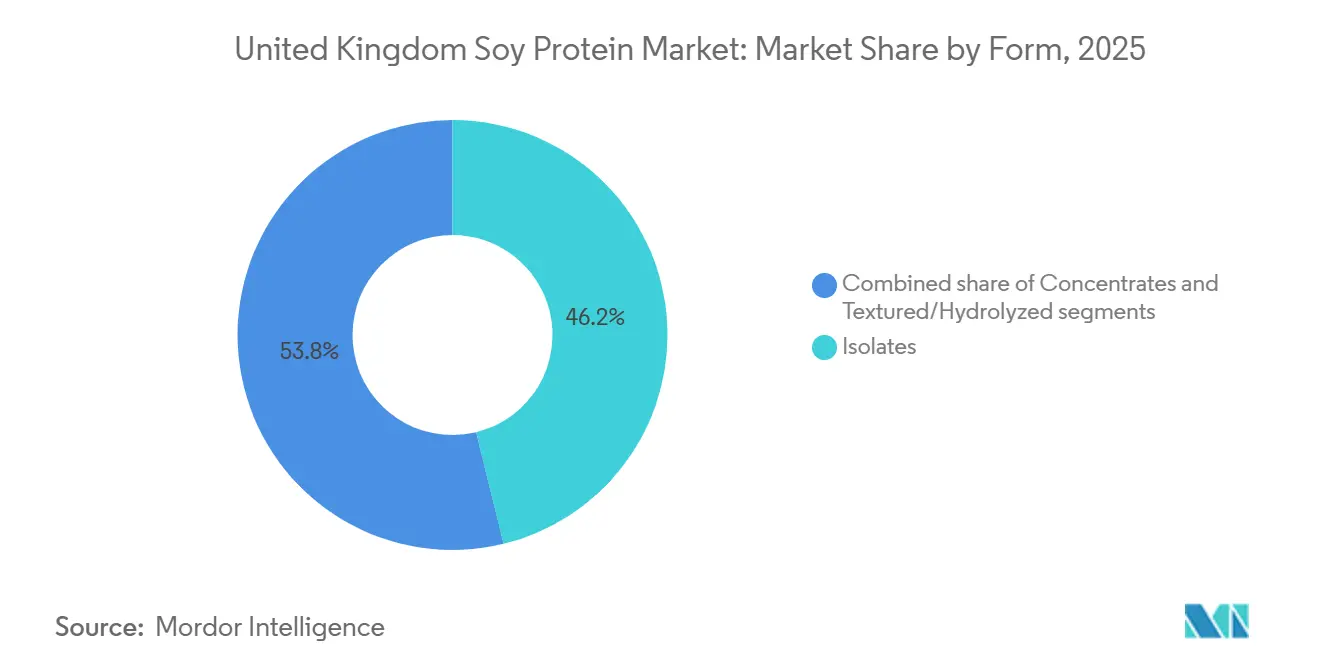
- By form, isolates captured 46.19% of 2025 demand, while textured and hydrolyzed variants are projected to record a 4.88% CAGR through 2031.
- By category, conventional soy protein commanded 76.47% of 2025 volume, whereas organic offerings are forecast to expand at a 6.03% CAGR to 2031.
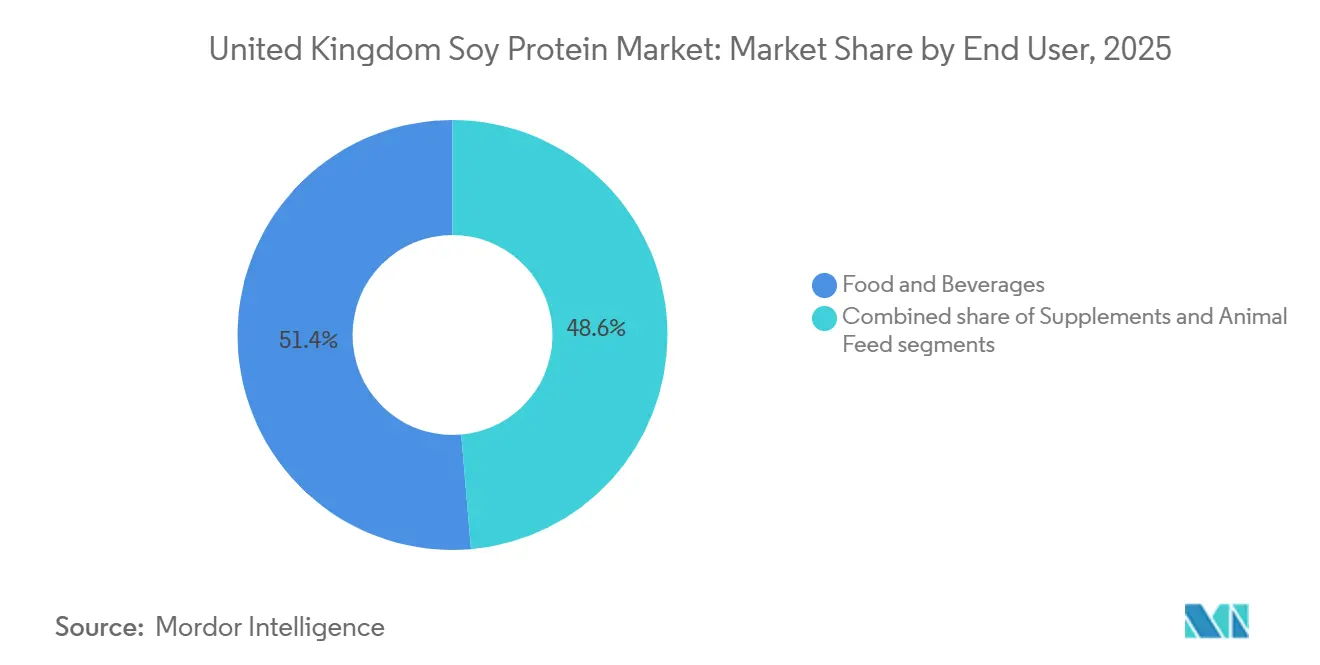
- By end user, food and beverages generated 51.38% of 2025 demand, while supplements are projected to rise at a 5.35% CAGR during 2026-2031.
Note: Market size and forecast figures in this report are generated using Mordor Intelligence’s proprietary estimation framework, updated with the latest available data and insights as of January 2026.
United Kingdom Soy Protein Market Trends and Insights
Drivers Impact Analysis*
| Driver | (~) % Impact on CAGR Forecast | Geographic Relevance | Impact Timeline |
|---|---|---|---|
| Shift towards plant-based and flexitarian diets | +0.8% | National, with higher penetration in London, Manchester, Edinburgh | Medium term (2-4 years) |
| Rising demand for lactose-free protein alternatives | +0.6% | National, driven by urban centers and younger demographics | Short term (≤ 2 years) |
| Fitness/sports nutrition popularity | +0.7% | National, concentrated in England's urban gyms and online retail | Medium term (2-4 years) |
| HFSS reformulation boosting soy inclusion | +0.5% | National, affecting major food manufacturers in East Midlands, Yorkshire | Short term (≤ 2 years) |
| Innovation in formulations improving taste/digestibility | +0.4% | National, led by research and developments hubs in England and Scotland | Long term (≥ 4 years) |
| Sustainability preferences over animal agriculture environmental impact | +0.6% | National, with policy reinforcement from DEFRA and FSA | Long term (≥ 4 years) |
| Source: Mordor Intelligence | |||


Shift towards plant‑based and flexitarian diets
The increasing shift toward plant-based and flexitarian diets is driving demand for soy protein in the United Kingdom, as consumers prioritize sustainable and health-focused alternatives to animal proteins. A report by the Good Food Institute Europe (GFI Europe) indicates that by 2025, 51% of British adults plan to adjust their diets by either increasing plant-based food consumption or reducing animal meat and dairy intake, with approximately 20% intending to do both [1]Source: Good Food Institute Europe (GFI Europe), "Research: Four in 10 German and UK Adults Plan to Eat More Plant-Based Food," gfieurope.org. This trend is fueling the use of soy ingredients in reformulated products, particularly among millennials and Gen Z, who are drawn to health benefits such as cholesterol reduction. Manufacturers are responding by incorporating high-purity soy protein isolates from suppliers like Archer Daniels Midland Company (ADM) to enhance emulsification and nutritional value in plant-based meats and beverages. Flexitarian consumers are also driving demand for functional foods, with soy's gelling properties, offered by brands such as IFF's ALPHA® concentrates, enabling improved textures in dairy alternatives and aligning dietary preferences with advancements in taste and digestibility. Additionally, soy is increasingly recognized for addressing lactose intolerance and supporting fitness nutrition, with verified ingredient suppliers like Roquette and Kerry Group providing tailored soy solutions to meet the evolving demands of the UK food market.
Fitness/sports nutrition popularity
The increasing focus on fitness and sports nutrition is driving demand for soy protein in the United Kingdom, as protein supplementation shifts from a niche bodybuilding audience to mainstream wellness between 2020 and 2025. Supermarkets are allocating entire aisles to protein bars, ready-to-drink shakes, and powders aimed at office workers and casual gym-goers. Sports England reports that between November 2023 and November 2024, 63.7% of adults in England, representing 30 million individuals, engaged in sports or physical activities weekly [2]Source: Sport England, "Record Numbers Playing Sport and Taking Part in Physical Activity," sportengland.org. This trend has boosted the appeal of soy protein isolates, which provide 90% protein by weight and compete with whey protein in cost-sensitive segments, particularly among lactose-intolerant consumers and those seeking dairy alternatives. National Health Service campaigns linking protein intake to healthy aging further reinforce this shift, with soy protein benefiting from decades of safety data and its Generally Recognized as Safe (GRAS) status. Supplement brands often source reliable soy protein isolates from manufacturers like Cargill for use in shakes and bars. While influencer-driven trends toward novel proteins, such as cricket or algae, pose challenges, soy protein maintains an edge due to clinical validation and high disposable incomes in urban areas, supporting widespread adoption.
HFSS reformulation boosting soy inclusion
The HFSS (High Fat, Sugar, and Salt) reformulation is driving increased soy inclusion in the United Kingdom, as the Nutrient Profiling Model (NPM) 2018 enforces restrictions on HFSS products, creating a regulatory advantage for soy protein in categories such as breakfast cereals and confectionery [3]Source: Department of Health & Social Care, "Nutrient Profiling Model 2018: Worked Examples änd Further Advice on Calculations," gov.uk. Products exceeding NPM thresholds face advertising bans on broadcast media before 9 PM, online restrictions, and exclusion from checkout and aisle-end displays in stores larger than 2,000 square feet. To comply with these regulations, reformulation strategies often involve substituting 5% to 10% of flour or fat with soy protein concentrate, reducing calorie density sufficiently to meet promotional thresholds while maintaining product texture. This approach is evident in protein-enriched biscuits and granola bars, which frequently utilize functional soy protein concentrates from manufacturers like IFF (earlier DuPont). These concentrates enable compliance without compromising taste profiles. This regulatory-driven demand for soy protein is time-sensitive, as the Food Standards Agency plans a 2026 consultation to tighten NPM guidelines in line with World Health Organization sodium recommendations. Such changes could prompt a second wave of reformulation, further solidifying soy protein's role as a compliance ingredient and helping stabilize demand, shielding it from the taste and price fluctuations that affect retail plant-based meat products.
Sustainability preferences over animal agriculture environmental impact
Growing consumer preferences for sustainability and concerns over the environmental impact of animal agriculture are influencing the United Kingdom soy protein market. Surveys by the Food Foundation indicate that UK consumers ranked environmental impact as the second-most-important factor driving plant-based purchases in 2024, following health and ahead of animal welfare. Soy cultivation's lower greenhouse gas emissions per gram of protein, compared to beef or dairy, have bolstered its appeal, despite debates surrounding UK soy imports linked to deforestation in Brazil's Cerrado and Amazon biomes. The UK Food Security Report 2024 highlights increasing deforestation impacts tied to consumption from 2019 to 2021, prompting the May 2024 launch of the UK Soy Manifesto, which commits signatories to achieving deforestation-free supply chains by 2025 through traceability systems. These systems are expected to raise landed costs by 2% to 4%, creating challenges for smaller importers, while larger companies like Bunge leverage satellite monitoring and audits to gain an edge in retailer tenders from Tesco and Sainsbury's, both under NGO scrutiny. This has led to a bifurcated market, with premium brands investing in certified soy to protect their equity, while value-tier manufacturers explore alternatives like UK-grown peas, despite functionality limitations. Sustainability has thus emerged as a strategic compliance measure, offering a competitive advantage amid increasing environmental scrutiny.
Restraints Impact Analysis*
| Restraint | (~) % Impact on CAGR Forecast | Geographic Relevance | Impact Timeline |
|---|---|---|---|
| Rising competition from pea, oat, and other proteins | -0.5% | National, with research and development concentration in England and Scotland | Medium term (2-4 years) |
| Price volatility of soy commodities | -0.3% | National, affecting UK importers dependent on Brazil and Argentina | Short term (≤ 2 years) |
| Soy allergen/GMO and deforestation concerns | -0.4% | National, amplified by NGO campaigns and media coverage | Long term (≥ 4 years) |
| Regulatory hurdles related to protein content claims and labeling standards | -0.2% | National, governed by FSA and EU-retained regulations | Medium term (2-4 years) |
| Source: Mordor Intelligence | |||
Rising competition from pea, oat, and other proteins
Competition from pea, oat, and other proteins is impacting the soy protein market in the United Kingdom by challenging soy's established role in plant-based formulations. Consumers and manufacturers are increasingly opting for pea protein due to its neutral taste and complete amino acid profile, while oat protein is preferred for its superior solubility in beverages. These alternatives compete directly with soy's functional dominance in meat analogs and dairy alternatives, offering cleaner labels and avoiding GMO-related concerns. Additionally, soy allergies and digestive issues are prompting formulators to shift toward pea and oat proteins to better address the needs of lactose-intolerant and sensitive consumers. Rising concerns over GMOs further drive demand for non-soy options, which are perceived as more traceable and sustainable. Supply chain vulnerabilities in soy imports are also increasing the appeal of locally sourced pea protein, further fragmenting demand. Manufacturers, such as Fuji Oil Holdings, are reallocating resources toward hybrid blends, reducing reliance on pure soy protein. These combined factors are pressuring soy ingredient suppliers to innovate in response to the growing substitution threats posed by versatile competitors.
Soy allergen/GMO and deforestation concerns
The soy protein market in the United Kingdom faces significant challenges due to allergen regulations, GMO concerns, and deforestation scrutiny. Soy is classified as one of the UK's top 14 declarable allergens under retained EU Regulation 1169/2011, requiring bold labeling that restricts its use in allergen-sensitive demographics such as infant formula and elderly nutrition. The UK Committee on Toxicity's 2018 assessment further advised that soy-based infant formula should only be used in exceptional cases due to isoflavone exposure concerns. Negative perceptions surrounding GMOs and hormonal effects from phytoestrogens have driven formulators toward hypoallergenic alternatives like rice and oat proteins, which are not subject to similar restrictions. Bold labeling requirements also limit the discreet inclusion of soy in functional foods, despite its nutritional benefits. Additionally, deforestation concerns related to soy imports and supply chain vulnerabilities have further reduced its appeal. Manufacturers are increasingly opting for alternatives to avoid allergen disclosure mandates, while suppliers such as Fuji Oil Holdings are under pressure to develop low-allergen soy variants to meet compliance requirements. These interconnected challenges continue to constrain soy protein's penetration in high-value market segments, as stricter labeling and safety perceptions shape consumer and industry preferences.
*Our forecasts treat driver/restraint impacts as directional, not additive. The impact forecasts reflect baseline growth, mix effects, and variable interactions.
Segment Analysis
By Form: Isolates Anchor Functionality, Textured Variants Capture Meat-Analogue Momentum
Isolates accounted for 46.19% of the projected 2025 demand, emphasizing their importance in applications requiring high protein purity, neutral flavor, and solubility. These attributes are critical for dairy-alternative creamers, sports nutrition shakes, and infant formula, where off-notes can lead to consumer rejection. Textured and hydrolyzed soy proteins are expected to grow at the fastest rate of 4.88% through 2031, driven by demand from meat-analogue manufacturers seeking cost-effective scaffolding that replicates the fibrous texture of chicken or beef at a fraction of the cost of whole-muscle cuts. Concentrates, containing 60% to 70% protein, serve as a cost-efficient alternative. Bakeries use them to enhance protein content in bread and biscuits without incurring the higher costs of isolates, while ready-to-eat meal manufacturers incorporate them as binders in vegetable patties and grain bowls.
The functional differentiation between isolates and textured soy proteins is expanding as biotechnology enables greater customization. For instance, IFF's SUPRO MAX soy protein isolate, launched in 2024, employs enzyme modification to improve emulsification stability in plant-based ice cream, addressing a recurring issue where coconut fat separates during freeze-thaw cycles. Textured soy protein producers are also exploring hybrid extrusion techniques that combine soy with pea or wheat gluten to create anisotropic structures, fibers aligned in one direction, that replicate the texture of steak or pork loin. This innovation is particularly relevant as the plant-based meat category experienced a sales decline in 2024, largely due to consumer dissatisfaction with texture. Hydrolyzed soy proteins, broken into peptides for rapid absorption, remain a niche segment but are gaining traction in elderly nutrition and clinical formulas. In these applications, digestive efficiency outweighs cost considerations, and this segment is expected to grow as the over-65 population continues to expand.


By Category: Conventional Dominates, Organic Rides Clean-Label Premiumization
Conventional soy protein is expected to account for 76.47% of the 2025 volume, driven by its cost advantages in bulk applications such as animal feed, bakery fortification, and value-tier meat analogues. These segments prioritize affordability over certification labels, making conventional soy protein a preferred choice. Organic soy protein, however, is projected to grow at a compound annual growth rate (CAGR) of 6.03% through 2031, supported by its premium positioning in infant formula, clean-label snacks, and sports nutrition products. Health-conscious consumers are willing to pay 20% to 30% premiums for non-GMO and pesticide-free assurances. Despite this growth, the organic soy protein market faces challenges due to limited domestic supply and reliance on imports from Europe, the United States, and Canada, where certification standards vary, and traceability costs inflate landed prices.
Infant formula remains the highest-value application for organic soy protein, despite regulatory hurdles such as the UK Committee on Toxicity's cautious stance on soy-based formulas for infants. The Infant Formula and Follow-on Formula (England) Regulations 2007 impose strict compositional requirements, including a pesticide residue limit of 0.01 mg/kg, effectively mandating organic sourcing to minimize regulatory risks. However, organic certification adds 15% to 25% to raw material costs, compressing margins in a market where plant-based products already carry price premiums over conventional meat and dairy. As cost-of-living pressures persist, organic soy protein risks becoming a luxury product accessible primarily to affluent urban consumers, limiting its potential to drive mass-market adoption of plant-based products.
By End User: Food and Beverages Lead, Supplements Accelerate on Mainstream Fitness Culture
Soy protein demand in 2025 is expected to be driven by food and beverages, accounting for 51.38% of the market. Key applications include dairy alternatives, bakery fortification, meat analogues, and ready-to-eat meals. The supplements segment is projected to grow at 5.35% through 2031, fueled by the mainstream adoption of sports nutrition and the increasing need for allergen-diversified protein blends in elderly nutrition. Within food and beverages, dairy alternatives such as soy milk, yogurt, and creamers dominate, though oat milk's rising popularity has reduced soy milk's market share in 2024. Bakery applications, including bread and cakes, remain resilient due to soy protein concentrate's ability to enhance shelf life and crumb structure, offering operational advantages to industrial bakers.
Supplements' growth reflects the broader acceptance of protein for wellness, elderly sarcopenia prevention, and weight management. Infant formula remains constrained by regulatory concerns over isoflavones, limiting soy-based formulas to under 5% of the infant nutrition market. Elderly nutrition offers growth potential as the over-65 population expands, though soy's allergen status and phytoestrogen content create opportunities for alternatives like rice and oat proteins. Meanwhile, animal feed, the largest consumer of soy imports, faces increasing competition from insect protein and algae alternatives promoted for sustainability and cost reduction.
Geography Analysis
England remains the primary driver of soy protein consumption and processing in the UK, supported by food manufacturing hubs in the East Midlands, Yorkshire, and the East of England. These regions house major producers of bakery goods, dairy alternatives, and meat analogues, relying on soy isolates and concentrates for large-scale production. London, while not a manufacturing center, plays a pivotal role as the retail and distribution hub where plant-based product launches and consumer trends originate before expanding to other regions. The capital's higher adoption of plant-based products, driven by its younger, affluent, and diverse population, underscores its influence. However, this urban-centric demand also poses risks, as economic shifts or changing consumer preferences in metropolitan areas could significantly impact the market.
Scotland's food and drink sector, which generated GBP 19 billion in turnover in 2025 according to the Scottish Government, is witnessing growing interest in plant-based products, particularly in cities like Edinburgh and Glasgow. These urban centers are fostering innovation in soy-based meat analogues and dairy alternatives through vegan restaurants and specialty retailers. However, Scotland's smaller population and dispersed geography present challenges for soy protein distributors, leading to higher landed costs, 5% to 10% more than in England's industrial regions. Despite these limitations, Scotland's focus on innovation positions it as a key contributor to the market's development.
Wales and Northern Ireland, while smaller and more rural markets, benefit from cross-border supply chains. Wales leverages its proximity to England's manufacturing hubs, while Northern Ireland relies on the Republic of Ireland's agri-food sector for soy protein ingredient access. Northern Ireland's livestock and dairy-focused agri-food sector is gradually exploring soy protein meal blends to address rising feed costs and sustainability concerns. Future growth is expected to concentrate in England's urban areas, with Scotland driving innovation, while Wales and Northern Ireland adopt proven products with limited incremental volume potential.
Competitive Landscape
The soy protein market in the UK exhibits moderate fragmentation, with global companies such as Archer Daniels Midland, Cargill, and Kerry Group leading the supply of soy protein isolates and concentrates through vertically integrated operations, spanning from crushing to fractionation. Regional players like Nordic Soya, Sojaprotein, and Lehmann Ingredients effectively compete by offering textured-protein customization, shorter lead times, and niche applications such as organic certification and non-GMO sourcing. This combination of global scale and regional agility creates a dynamic market environment, driven by the growing demand for plant-based products.
Strategic approaches in the market highlight a division between multinational corporations and smaller regional firms. Larger companies are focusing on biotechnology platforms, including enzymes, fermentation, and precision breeding, to enhance the functionality and taste of soy protein, targeting high-value applications. Meanwhile, smaller players, with limited research and development budgets, emphasize sustainability certifications such as deforestation-free sourcing, Rainforest Alliance, and Fair Trade. These certifications help secure procurement contracts from United Kingdom retailers, who face pressure from NGOs and reputational risks. Together, these strategies balance innovation-driven value with compliance-focused reliability, sustaining market competitiveness.
Growth opportunities are emerging in hybrid proteins and invisible fortification. Combining soy with other proteins such as pea, fava, or rice creates complete amino acid profiles, appealing to vegan athletes and formulators seeking versatile solutions. Additionally, embedding soy concentrates into everyday staples like pasta, bread, and sauces enhances protein content without overtly marketing them as plant-based, reducing potential consumer resistance. Suppliers like Wilmar International play a critical role in providing consistent and cost-effective soy concentrates for these applications. These niches align with broader competitive strategies, enabling soy protein to expand into new categories beyond its traditional uses.
United Kingdom Soy Protein Industry Leaders
-
Archer Daniels Midland Company
-
International Flavors & Fragrances, Inc.
-
Kerry Group PLC
-
Wilmar International Ltd
-
Cargill, Incorporated
- *Disclaimer: Major Players sorted in no particular order

Recent Industry Developments
- June 2025: ACI Group announced a strategic distribution agreement with IFF, securing the rights to distribute IFF’s soy and pea protein ingredients in the UK and Ireland. This long-term partnership enhanced ACI’s role in the traditional meat and plant-based food markets, providing customers with access to a comprehensive range of non-GMO protein solutions supported by advanced technical expertise.
- March 2025: ACI Group announced a new range of plant-based proteins, expanding its portfolio to address the increasing demand for sustainable and functional ingredients in food manufacturing. The new offerings included a wide variety of pea, soy, and wheat proteins, as well as a blended plant protein concentrate designed for diverse product formulations.
- August 2024: Imperial College London co-launched the National Alternative Protein Innovation Centre (NAPIC) to advance accessible, sustainable, and appealing alternatives to animal-based proteins. Supported by GBP 15 million in funding from the UKRI Biotechnology and Biological Sciences Research Council and Innovate UK, NAPIC focused on advancing alternative protein sources, including plant-based, fungal, insect-derived, fermentation-derived, and lab-grown options. The initiative aimed to enhance taste, nutrition, affordability, safety, and sustainability, facilitating the transition of these proteins from research to commercialisation.


United Kingdom Soy Protein Market Report Scope
Concentrates, Isolates, Textured/Hydrolyzed are covered as segments by Form. Animal Feed, Food and Beverages, Supplements are covered as segments by End User.
By Form
| Concentrates |
| Isolates |
| Textured/Hydrolyzed |
By Category
| Conventional |
| Organic |
By End User
| Animal Feed | |
| Food and Beverages | Bakery |
| Beverages | |
| Breakfast Cereals | |
| Condiments/Sauces | |
| Confectionery | |
| Dairy and Dairy Alternatives | |
| Meat/Poultry/Seafood and Alternatives | |
| RTE/RTC Foods | |
| Snacks | |
| Supplements | Baby Food and Infant Formula |
| Elderly and Medical Nutrition | |
| Sport and Dietary Supplements |
| By Form | Concentrates | |
| Isolates | ||
| Textured/Hydrolyzed | ||
| By Category | Conventional | |
| Organic | ||
| By End User | Animal Feed | |
| Food and Beverages | Bakery | |
| Beverages | ||
| Breakfast Cereals | ||
| Condiments/Sauces | ||
| Confectionery | ||
| Dairy and Dairy Alternatives | ||
| Meat/Poultry/Seafood and Alternatives | ||
| RTE/RTC Foods | ||
| Snacks | ||
| Supplements | Baby Food and Infant Formula | |
| Elderly and Medical Nutrition | ||
| Sport and Dietary Supplements | ||


Market Definition
- End User - The Protein Ingredients Market operates on a B2B basis. Food, Beverages, Supplements, Animal Feed, and Personal Care & Cosmetic manufacturers are considered to be end-consumers in the market studied. The scope excludes manufacturers buying liquid/dry whey to be used for application as a binding agent or thickener or other non-protein applications.
- Penetration Rate - Penetration Rate is defined as the percentage of Protein-Fortified End User Market Volume in the Overall End User Market Volume.
- Average Protein Content - Average protein content is the average protein content present per 100 g of product manufactured by all end-user companies considered under the scope of this report.
- End User Market Volume - End-user market volume is the consolidated volume of all types and forms of end-user products in the country or region.
| Keyword | Definition |
|---|---|
| Alpha-lactalbumin (α-Lactalbumin) | It is a protein that regulates the production of lactose in the milk of almost all mammalian species. |
| Amino acid | It is an organic compound that contains both amino and carboxylic acid functional groups, which are required for the synthesis of body protein and other important nitrogen-containing compounds, such as creatine, peptide hormones, and some neurotransmitters. |
| Blanching | It is the process of briefly heating vegetables with steam or boiling water. |
| BRC | British Retail Consortium |
| Bread improver | It is a flour-based blend of several components with specific functional properties designed to modify dough characteristics and give quality attributes to bread. |
| BSF | Black Soldier Fly |
| Caseinate | It is a substance produced by adding an alkali to acid casein, a derivative of casein. |
| Celiac disease | Celiac disease is an immune reaction to eating gluten, a protein found in wheat, barley, and rye. |
| Colostrum | It is a milky fluid that’s released by mammals that have recently given birth before breast milk production begins. |
| Concentrate | It is the least processed form of protein and has a protein content ranging from 40-90% by weight. |
| Dry protein basis | It refers to the percentage of "pure protein" present in a supplement after the water in it is completely removed through heat. |
| Dry whey | It is the product resulting from drying fresh whey which has been pasteurized and to which nothing has been added as a preservative. |
| Egg protein | It is a mixture of individual proteins, including ovalbumin, ovomucoid, ovoglobulin, conalbumin, vitellin, and vitellenin. |
| Emulsifier | It is a food additive that facilitates the blending of foods that are immiscible with one another, such as oil and water. |
| Enrichment | It is the process of addition of micronutrients that are lost during the processing of the product. |
| ERS | Economic Research Service of the USDA |
| Extrusion | It is the process of forcing soft mixed ingredients through an opening in a perforated plate or die designed to produce the required shape. The extruded food is then cut to a specific size by blades. |
| Fava | Also known as Faba, it is another word for yellow split beans. |
| FDA | Food and Drug Administration |
| Flaking | It is a process in which typically a cereal grain (like corn, wheat, or rice) is broken down into grits, cooked with flavors and syrups, and then pressed into flakes between cooled rollers. |
| Foaming agent | It is a food ingredient that makes it possible to form or maintain a uniform dispersion of a gaseous phase in a liquid or solid food. |
| Foodservice | It refers to the part of the food industry which includes businesses, institutions, and companies which prepare meals outside the home. It includes restaurants, school and hospital cafeterias, catering operations, and many other formats. |
| Fortification | It is the deliberate addition of micronutrients that are not found in them naturally or which are lost during processing, to improve a food product's nutritional value. |
| FSANZ | Food Standards Australia New Zealand |
| FSIS | Food Safety and Inspection Service |
| FSSAI | Food Safety and Standards Authority of India |
| Gelling agent | It is an ingredient that functions as a stabilizer and thickener to provide thickening without stiffness through the formation of gel. |
| GHG | Greenhouse Gas |
| Gluten | It is a family of proteins found in grains, including wheat, rye, spelt, and barley. |
| Hemp | It is a botanical class of Cannabis sativa cultivars grown specifically for industrial or medicinal use. |
| Hydrolysate | It is a form of protein manufactured by exposing the protein to enzymes that can partially break the bonds between the protein's amino acids and break down large, complicated proteins into smaller pieces. Its processing makes it easier and quicker to digest. |
| Hypoallergenic | It refers to a substance that causes fewer allergic reactions. |
| Isolate | It is the purest and most processed form of protein which has undergone separation to obtain a pure protein fraction. It typically contains ≥ 90% of protein by weight. |
| Keratin | It is a protein that helps form hair, nails, and the outer layer of skin. |
| Lactalbumin | It is the albumin contained in milk and obtained from whey. |
| Lactoferrin | It is an iron‑binding glycoprotein that is present in the milk of most mammals. |
| Lupin | It is the yellow legume seeds of the genus Lupinus. |
| Millenial | Also known as Generation Y or Gen Y, it refers to the people born from 1981 to 1996. |
| Monogastric | It refers to an animal with a single-compartmented stomach. Examples of monogastric include humans, poultry, pigs, horses, rabbits, dogs, and cats. Most monogastric are generally unable to digest much cellulose food materials such as grasses. |
| MPC | Milk protein concentrate |
| MPI | Milk protein isolate |
| MSPI | Methylated soy protein isolate |
| Mycoprotein | Mycoprotein is a form of single-cell protein, also known as fungal protein, derived from fungi for human consumption. |
| Nutricosmetics | It is a category of products and ingredients that act as nutritional supplements to care for skin, nails, and hair natural beauty. |
| Osteoporosis | It is a medical condition in which the bones become brittle and fragile from loss of tissue, typically as a result of hormonal changes, or deficiency of calcium or vitamin D. |
| PDCAAS | Protein digestibility-corrected amino acid score (PDCAAS) is a method of evaluating the quality of a protein based on both the amino acid requirements of humans and their ability to digest it. |
| Per-capita consumption of animal protein | It is the average amount of animal protein (such as milk, whey, gelatin, collagen, and egg proteins) that is readily available for consumption by each person in an actual population. |
| Per-capita consumption of plant protein | It is the average amount of plant protein (such as soy, wheat, pea, oat, and hemp proteins) that is readily available for consumption by each person in an actual population. |
| Quorn | It is a microbial protein manufactured using mycoprotein as an ingredient, in which the fungus culture is dried and mixed with egg albumen or potato protein, which acts as a binder, and then is adjusted in texture and pressed into various forms. |
| Ready-to-Cook (RTC) | It refers to food products that include all of the ingredients, where some preparation or cooking is required through a process that is given on the package. |
| Ready-to-Eat (RTE) | It refers to a food product prepared or cooked in advance, with no further cooking or preparation required before being eaten. |
| RTD | Ready-to-Drink |
| RTS | Ready-to-Serve |
| Saturated fat | It is a type of fat in which the fatty acid chains have all single bonds. It is generally considered unhealthy. |
| Sausage | It is a meat product made of finely chopped and seasoned meat, which may be fresh, smoked, or pickled and which is then usually stuffed into a casing. |
| Seitan | It is a plant-based meat substitute made out of wheat gluten. |
| Softgel | It is a gelatin-based capsule with a liquid fill. |
| SPC | Soy protein concentrate |
| SPI | Soy protein isolate |
| Spirulina | It is a biomass of cyanobacteria that can be consumed by humans and animals. |
| Stabilizer | It is an ingredient added to food products to help maintain or enhance their original texture, and physical and chemical characteristics. |
| Supplementation | It is the consumption or provision of concentrated sources of nutrients or other substances that are intended to supplement nutrients in the diet and is intended to correct nutritional deficiencies. |
| Texturant | It is a specific type of food ingredient that is used to control and alter the mouthfeel and texture of food and beverage products. |
| Thickener | It is an ingredient that is used to increase the viscosity of a liquid or dough and make it thicker, without substantially changing its other properties. |
| Trans fat | Also called trans-unsaturated fatty acids or trans fatty acids, it is a type of unsaturated fat that naturally occurs in small amounts in meat. |
| TSP | Textured soy protein |
| TVP | Textured vegetable protein |
| WPC | Whey protein concentrate |
| WPI | Whey protein isolate |


Research Methodology
Mordor Intelligence follows a four-step methodology in all our reports.
- Step-1: Identify Key Variables: The quantifiable key variables (industry and extraneous) pertaining to the specific product segment and country are selected from a group of relevant variables & factors based on desk research & literature review; along with primary expert inputs. These variables are further confirmed through regression modeling (wherever required).
- Step-2: Build a Market Model: In order to build a robust forecasting methodology, the variables and factors identified in Step-1 are tested against available historical market numbers. Through an iterative process, the variables required for market forecast are set and the model is built on the basis of these variables.
- Step-3: Validate and Finalize: In this important step, all market numbers, variables and analyst calls are validated through an extensive network of primary research experts from the market studied. The respondents are selected across levels and functions to generate a holistic picture of the market studied.
- Step-4: Research Outputs: Syndicated Reports, Custom Consulting Assignments, Databases & Subscription Platforms


