Market Overview
| Study Period | 2021 - 2031 |
|---|---|
| Forecast Data Period | 2026 - 2031 |
| Historical Data Period | 2021 - 2024 |
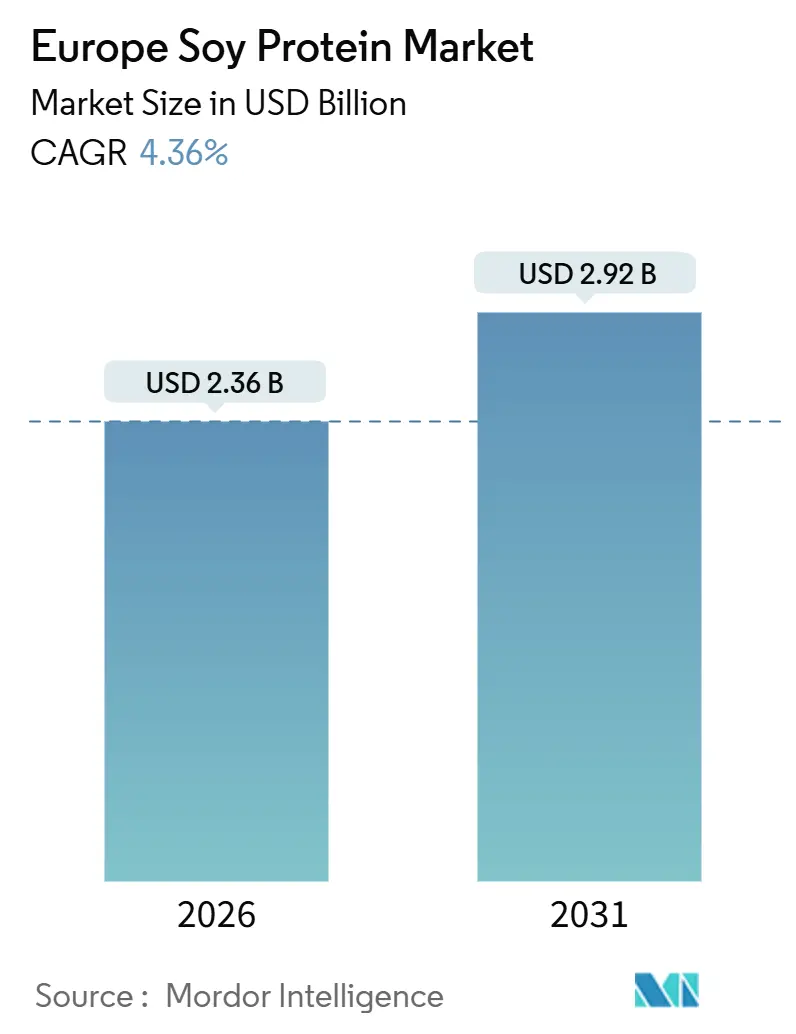
| Market Size (2026) | USD 2.36 Billion |
| Market Size (2031) | USD 2.92 Billion |
| Growth Rate (2026 - 2031) | 4.36% CAGR |
| Market Concentration | Medium |
Major Players
*Disclaimer: Major Players sorted in no particular order Image © Mordor Intelligence. Reuse requires attribution under CC BY 4.0. |
|
Europe Soy Protein Market Analysis by Mordor Intelligence
The Europe soy protein market is projected to reach USD 2.36 billion by 2026 and is expected to grow to USD 2.92 billion by 2031, registering a CAGR of 4.36%. This growth is driven by the region's increasing preference for protein-enriched, plant-based nutrition. The rising emphasis on high-protein diets, active lifestyles, and wellness-focused consumption is boosting the use of soy protein in functional foods, nutritional products, and convenient formats that enhance protein intake without significant dietary adjustments. The market is further supported by the demand for ingredients that deliver consistent performance at scale, making soy protein a suitable choice for processed foods and commercial manufacturing systems. Additionally, advancements in soy protein processing are improving taste neutrality and formulation flexibility, enhancing its competitiveness in the market.
Key Report Takeaways
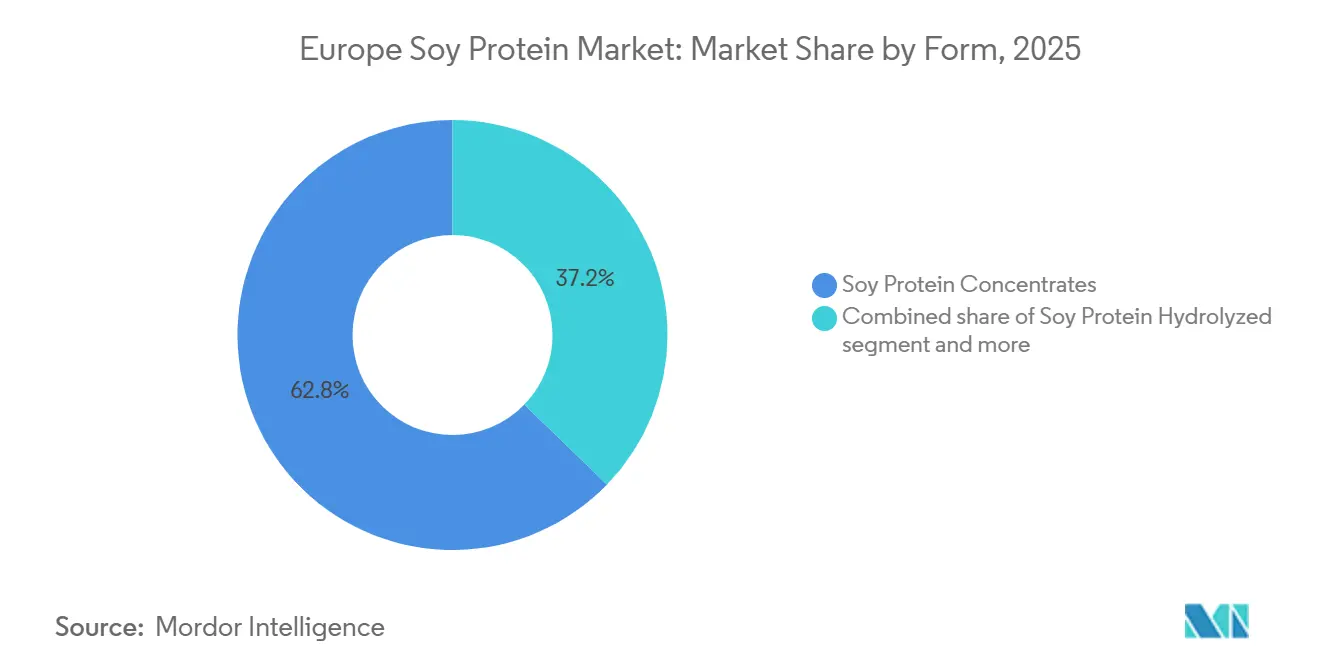
- By form, soy protein concentrates held 62.76% of the Europe soy protein market share in 2025; soy protein hydrolysates are projected to expand at a 4.66% CAGR between 2026 and 2031.
- By category, conventional variants dominated with 76.63% revenue share in 2025, and organic soy protein will register the highest CAGR at 6.43% during 2026-2031.
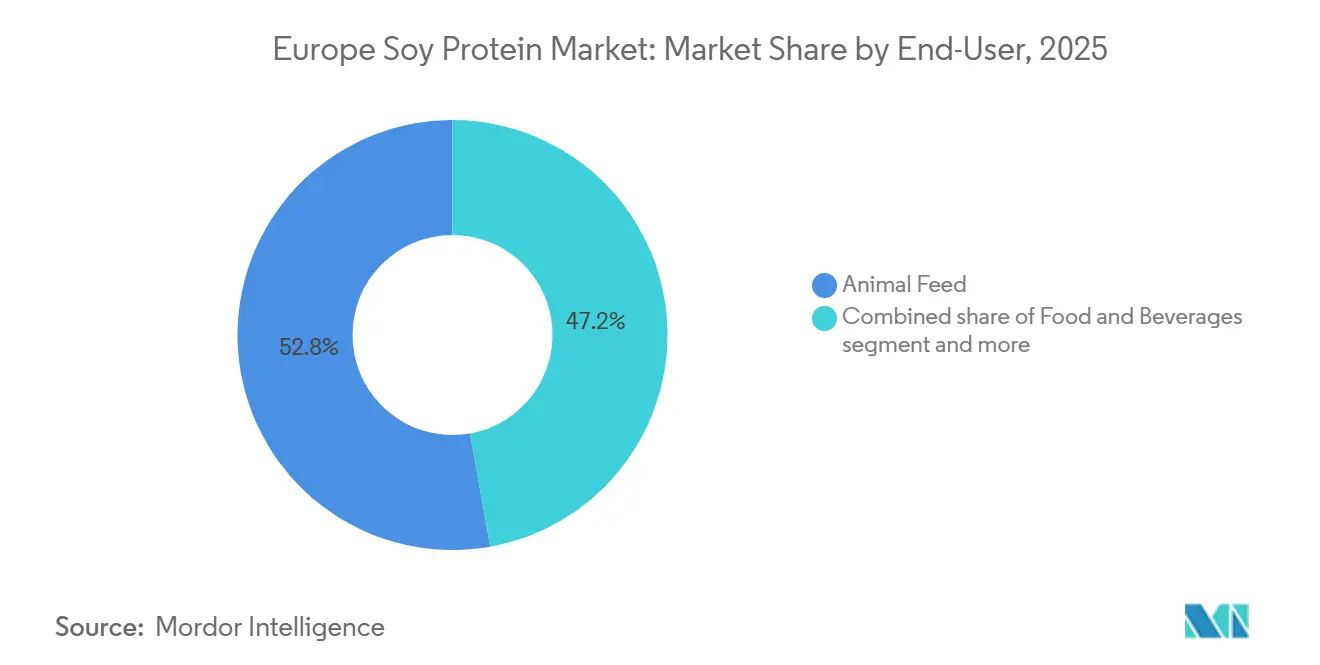
- By end-user, animal feed captured 52.81% share in 2025; supplements are forecast to rise at a 5.34% CAGR through 2031.
- By geography, Germany led with 26.12% revenue share in 2025, and the Netherlands is set to grow fastest at a 6.11% CAGR to 2031
Note: Market size and forecast figures in this report are generated using Mordor Intelligence’s proprietary estimation framework, updated with the latest available data and insights as of January 2026.
Europe Soy Protein Market Trends and Insights
Drivers Impact Analysis*
| Driver | (~) % Impact on CAGR Forecast | Geographic Relevance | Impact Timeline |
|---|---|---|---|
| Rising demand for plant-based meat and dairy alternatives | +1.2% | Western Europe (Germany, United Kingdom, France, Netherlands), expanding to Southern Europe | Medium term (2-4 years) |
| High focus on protein-rich nutrition and active lifestyles | +0.9% | Pan-European, strongest in Nordic countries and Germany | Short term (≤ 2 years) |
| Growing demand for clean-label and minimally processed protein ingredients | +0.8% | Western and Northern Europe, driven by retail mandates | Medium term (2-4 years) |
| Technological advancements in soy protein processing | +0.6% | Germany, Netherlands, Belgium (processing hubs) | Long term (≥ 4 years) |
| Increasing demand for sustainable and lower-carbon protein options | +0.7% | EU-wide, regulatory push strongest in Nordic and Benelux regions | Long term (≥ 4 years) |
| Strong functionality of soy protein in processed food applications | +0.5% | Pan-European, concentrated in food manufacturing clusters | Short term (≤ 2 years) |
| Source: Mordor Intelligence | |||
Rising demand for plant-based meat and dairy alternatives
The growing demand for plant-based meat and dairy alternatives is a key driver of the Europe soy protein market. Soy protein is widely recognized as a scalable and functional protein base, offering the texture, structure, and protein density that consumers expect from meat analogues and dairy substitutes. As European households increasingly adopt and repurchase plant-based products, manufacturers are expanding their product portfolios and reformulating existing offerings to enhance attributes such as texture, creaminess, and nutritional value. This trend directly increases the demand for reliable soy protein inputs. According to the Good Food Institute (GFI), 37% of households in Germany purchased plant-based milk, and 32% purchased plant-based meat at least once in 2024, indicating widespread mainstream adoption rather than niche consumption [1]Source: Good Food Institute (GFI), "Plant-based retail sales in six European countries", gfieurope.org. Consequently, soy protein experiences consistent demand across both plant-based dairy and meat categories, driving higher production volumes, more frequent innovation, and sustained long-term ingredient demand within Europe’s evolving alternative protein market.
High focus on protein-rich nutrition and active lifestyles
The increasing emphasis on protein-rich diets and active lifestyles is a significant driver for the Europe soy protein market. Consumers are prioritizing higher daily protein intake to support muscle maintenance, fitness performance, satiety, and healthy aging. In Europe, protein is no longer limited to sports nutrition; it has become a mainstream health focus. This trend has encouraged manufacturers to fortify everyday foods and beverages with added protein while maintaining acceptable taste and texture. Soy protein benefits from this shift as it allows brands to provide meaningful protein enrichment across various convenient formats. This supports product claims such as "high protein" and "source of protein," catering to gym-goers, working professionals, and wellness-oriented consumers. As active lifestyle habits extend beyond niche athletic groups to broader populations, the demand for soy protein continues to grow as a reliable plant-based solution that helps manufacturers address performance nutrition needs on a larger scale.
Growing demand for clean-label and minimally processed protein ingredients
The growing demand for clean-label and minimally processed protein ingredients is driving the market, as consumers increasingly assess products based on not only protein content but also ingredient simplicity, perceived naturalness, and production transparency. This trend is prompting manufacturers to reformulate protein-fortified foods and beverages with fewer additives and more recognizable ingredients, enhancing the role of soy protein formats that offer strong functionality without requiring extensive formulation support. Simultaneously, the European Union Organic Regulation 2018/848 has introduced stricter requirements for organic integrity, traceability, and production standards, encouraging brands to adopt cleaner ingredient systems and compliant sourcing strategies within the organic and "better-for-you" protein segment. Consequently, clean-label positioning is emerging as a critical competitive factor across Europe, with soy protein demand increasing due to its ability to meet modern label expectations while maintaining the performance required for large-scale commercial food production.
Technological advancements in soy protein processing
Technological advancements in soy protein processing are significantly driving the growth by addressing key adoption challenges such as taste, texture, stability, and application versatility. These advancements enhance the competitiveness of soy protein in modern plant-based and protein-fortified food products. Improved processing methods are reducing the characteristic beany off-notes and bitterness that previously restricted soy's use in mild-flavored applications. Additionally, enhanced solubility and dispersion capabilities allow soy protein to perform better in beverages, shakes, and nutritional formats without issues like sedimentation or graininess. Furthermore, advancements in texturization technologies are enabling soy protein to provide a more convincing structure and bite, which is essential for next-generation plant-based meat alternatives and hybrid foods, where consumers demand a closer resemblance to animal protein. These innovations also enhance batch-to-batch consistency and processing stability under conditions such as heat, shear, and storage, providing manufacturers with greater confidence to scale production and diversify product offerings.
Restraints Impact Analysis*
| Restraint | (~) % Impact on CAGR Forecast | Geographic Relevance | Impact Timeline |
|---|---|---|---|
| Allergen concerns and mandatory allergen labeling | -0.9% | EU-wide, particularly stringent in Germany, France, United Kingdom | Short term (≤ 2 years) |
| Preference shift toward alternative plant proteins | -1.1% | Western Europe (Netherlands, United Kingdom, Germany), spreading to Southern Europe | Medium term (2-4 years) |
| Limited processing infrastructure in certain European regions | -0.4% | Eastern Europe (Poland, Romania, Hungary), Southern Europe (Spain, Italy) | Medium term (2-4 years) |
| Supply chain complexity for certified soy | -0.5% | EU-wide, acute for smaller processors lacking direct sourcing relationships | Short term (≤ 2 years) |
| Source: Mordor Intelligence | |||
Allergen concerns and mandatory allergen labeling
Allergen concerns and mandatory allergen labeling present significant challenges for the Europe soy protein market. Soy is widely recognized as a priority allergen, which can limit consumer acceptance and reduce its appeal for free-from positioning in mainstream packaged foods. In Europe, manufacturers using soy protein are required to clearly declare its presence on product labels. This requirement can deter allergen-sensitive consumers and households from purchasing soy-based products, even when these products align with health and sustainability trends. Regulatory frameworks, such as EU Regulation 1169/2011, classify soy among the 14 major allergens requiring mandatory labeling. Consequently, soy-containing products cannot avoid allergen disclosure and may face increased consumer scrutiny at the point of purchase. This dynamic can lead to a shift in demand toward alternative proteins, such as pea or faba bean, particularly in applications where allergen avoidance is a critical purchasing factor.
Preference shift toward alternative plant proteins
The preference shift toward alternative plant proteins poses a significant restraint for the Europe soy protein market. Many food and beverage manufacturers are increasingly moving away from soy and focusing on proteins such as pea, faba bean, oat, wheat, and other novel options to meet changing consumer expectations and align with brand positioning strategies. In Europe, soy is often regarded as a traditional plant protein, while alternative proteins are seen as more innovative or better suited for specific claims, such as soy-free, allergen-friendly, or regionally sourced plant protein solutions. This trend is particularly evident in plant-based meat and dairy alternatives, where brands are striving for differentiation by reformulating products to enhance flavor neutrality, address allergen concerns, and support cleaner marketing narratives. Additionally, the growing demand for sustainability and transparency in ingredient sourcing further drives the adoption of alternative proteins, as they are often perceived to have a lower environmental impact compared to soy.
*Our forecasts treat driver/restraint impacts as directional, not additive. The impact forecasts reflect baseline growth, mix effects, and variable interactions.
Segment Analysis
By Form: Hydrolyzed Variants Capture Functional Premium
Soy protein concentrates accounted for a 62.76% market share in 2025, reflecting their strong alignment with mainstream food manufacturing requirements. These concentrates are particularly valued for their ability to balance high protein enrichment, functional performance, and cost-effective formulation stability. Their dominance is attributed to their suitability for high-volume applications that require reliable processing characteristics, such as water-binding, emulsification, viscosity building, and texture enhancement. This makes them ideal for product categories where consistent mouthfeel, structure, and shelf stability are critical at scale. Soy protein concentrates offer a practical solution by providing significant protein levels while maintaining favorable sensory outcomes, enabling manufacturers to uphold product quality in plant-based and protein-fortified foods.
The annual growth rate of 4.66% for hydrolyzed soy protein through 2031 underscores Europe's shift toward advanced, performance-driven protein solutions. Hydrolyzed proteins are increasingly incorporated into modern formats such as ready-to-mix powders, wellness beverages, and nutrition-focused foods, where smooth texture and quick mixing are essential for consumer satisfaction and repeat purchases. Hydrolyzed soy protein is preferred in applications requiring enhanced solubility, faster dispersion, smoother mouthfeel, and easier digestion. Additionally, its ability to integrate seamlessly into diverse formulations makes it a versatile choice for manufacturers aiming to innovate in high-demand categories such as sports nutrition, meal replacements, and functional beverages. These proteins also cater to the growing consumer preference for clean-label and allergen-friendly products, further driving their adoption in the market.


By Category: Organic Certification Commands Growth Premium
Conventional soy protein accounted for a 76.63% market share in 2025, highlighting the European market's focus on scale, stability, and broad industrial usability. Manufacturers prioritize reliable supply, consistent functionality, and established consumer acceptance. Conventional soy protein remains the leading category due to its deep integration into large-scale food and beverage manufacturing. It is particularly favored in applications requiring consistent performance across diverse production environments and extended distribution cycles. European processors and brand owners continue to prefer conventional soy protein for its dependable results in texture-building, moisture retention, emulsification, and structure formation, key factors in maintaining uniform product quality in mainstream packaged foods.
Organic soy protein, growing at a 6.43% CAGR through 2031, represents the fastest growth among segmentation types, reflecting Europe’s increasing shift toward certified, traceable, and trust-driven protein options. Ingredient credibility is becoming as significant as nutritional value. Organic soy protein is gaining traction as it aligns with prominent consumer trends in Europe, including clean-label eating, reduced chemical exposure, and a preference for responsibly produced ingredients. According to the German Federation of Organic Food Producers (BÖLW), organic food revenues in Germany reached EUR 16.99 billion in 2024, demonstrating that organic demand has transitioned from niche to mainstream consumer behavior [2]Source: German Federation of Organic Food Producers (BÖLW), "Revenue from organic food in Germany", boelw.de. This commercial growth strengthens the prospects for organic soy protein, as Germany often leads Europe in organic product launches, retailer organic offerings, and consumer expectations regarding certifications.
By End-User: Balanced Portfolio with Supplements Leading Growth
Animal feed accounted for a 52.81% share in 2025, highlighting the significant role of soy protein in Europe’s livestock nutrition system. Performance, consistency, and protein efficiency remain key priorities in this sector. Soy protein plays a critical role in supporting balanced diets for poultry, swine, cattle, and aquaculture by providing reliable nutritional value. It enables feed formulators to meet protein targets with consistent quality across large-scale operations. According to the European Feed Manufacturers' Federation (FEFAC), total industrial feed production in Europe reached 146.1 million tonnes in 2025, underscoring the scale of the industry and explaining why animal feed continues to dominate soy protein demand [3]Source: the European Feed Manufacturers' Federation (FEFAC), "EU Compound Feed Production Market Forecast 2025", fefac.eu. This large-scale production necessitates ingredient systems that are dependable and compatible with modern feed processing methods, such as pelletizing and high-throughput mixing. Soy protein ingredients offer both functional and nutritional benefits in these processes.
The supplements market, growing at a 5.34% CAGR through 2031, reflects a steady shift in soy protein demand toward higher-value, nutrition-focused applications. Consumers are increasingly seeking convenient ways to enhance daily protein intake. This growth is fueled by the expansion of lifestyle and wellness nutrition, where products like protein powders, ready-to-mix formats, and functional nutrition items are becoming part of routine health management, extending beyond athletes. Soy protein aligns well with this trend by supporting protein enrichment in products aimed at muscle maintenance, satiety, and general wellness. It also appeals to consumers who prefer plant-based protein sources or seek alternatives to dairy-based proteins.
Geography Analysis
Germany accounted for a 26.12% market share in 2025, establishing itself as the primary market for soy protein demand in Europe. This leadership is supported by its advanced food manufacturing sector and strong consumer preference for protein-enriched and plant-based diets. The country's position is further strengthened by its innovation in plant-based foods, where soy protein serves as a key ingredient, providing structure, texture, and protein density across various product categories. Additionally, Germany benefits from widespread adoption of high-protein nutrition trends, including flexitarian diets and functional wellness consumption. These factors ensure soy protein's strong presence not only in mainstream packaged foods but also in nutrition-focused product development. Germany's dominance is attributed to its high-volume processing capabilities, acceptance of plant proteins, and continuous product innovation pipelines.
The Netherlands is projected to grow at a 6.11% CAGR through 2031, making it the fastest-growing market among major European geographies. This growth is driven by its strategic role as a hub for food innovation, ingredient trade, and value-added processing. Dutch manufacturers and food technology ecosystems are increasingly focusing on advancements in plant-protein formulations, hybrid protein development, and enhanced processing techniques that improve the functional performance of soy protein in modern applications. Furthermore, the Netherlands' strong export-oriented supply chain, efficient logistics infrastructure, and concentration of protein solution providers facilitate rapid commercialization and scaling of soy-based ingredients and products. This combination of innovation and industrial efficiency positions the Netherlands as a high-growth market for soy protein across food and nutrition applications.
The United Kingdom, France, Italy, and Spain are experiencing steady growth as soy protein consumption expands from niche vegetarian segments to broader mainstream demand. In the United Kingdom and France, this growth is supported by increasing adoption of convenient plant-based meals, protein fortification, and health-driven product reformulation, particularly in ready-to-eat and on-the-go categories. Italy and Spain are also advancing as consumers seek balanced diets with higher plant protein inclusion. Manufacturers in these countries are responding with improved taste, texture, and locally familiar formats, making soy-based products more accessible. Collectively, these markets contribute to the overall growth of soy protein in Europe by expanding its use across everyday foods, supplements, and value-added applications, thereby strengthening the region's growth trajectory.

Competitive Landscape
The Europe soy protein market is moderately concentrated, characterized by a competitive landscape dominated by a few large, integrated ingredient companies. These companies leverage their scale, established customer relationships, and advanced processing expertise to maintain a strong market presence. Key players include Archer-Daniels-Midland Company, International Flavors & Fragrances Inc (IFF), Cargill, Incorporated, Kerry Group plc, and Wilmar International Limited. These firms lead the market by offering extensive soy protein portfolios catering to various end-use industries. Additionally, they provide technical formulation support, enabling manufacturers to optimize texture, stability, and protein delivery across diverse food and nutrition applications. Their robust presence ensures a reliable supply and facilitates the commercial adoption of soy protein, particularly among large European food processors that prioritize consistent performance, secure sourcing, and standardized quality specifications.
White-space opportunities in the market are increasingly focused on hybrid formulations that combine soy with other proteins, such as pea or faba bean. These blends allow brands to balance sensory performance and functionality while enhancing product positioning to meet evolving consumer expectations. Hybrid formulations help manufacturers mitigate formulation risks by improving mouthfeel and taste, while also addressing demand for differentiated labeling, such as allergen-aware or soy-reduced claims in specific categories. Additionally, hybrid protein strategies support cost and performance optimization, enabling brands to tailor texture, structure, and nutritional outcomes without relying solely on a single protein source. Consequently, innovation pipelines are shifting from single-protein approaches to multi-protein systems, offering greater flexibility across mainstream and premium product formats.
Technological advancements are emerging as a critical competitive differentiator in the soy protein market. Advanced processing techniques, such as high-moisture extrusion and supercritical CO₂ defatting, are increasingly central to improving functionality, achieving cleaner taste profiles, and delivering refined textural outcomes essential for next-generation plant-based foods. However, these technologies are capital-intensive, providing an advantage to established players with strong infrastructure and R&D capabilities. This dynamic enables leading companies to scale advanced soy protein solutions more efficiently, while smaller competitors often focus on niche specialization, partnerships, or unique sourcing claims to remain competitive.
Europe Soy Protein Industry Leaders
-
Archer-Daniels-Midland Company
-
International Flavors & Fragrances Inc (IFF)
-
Cargill, Incorporated
-
Kerry Group plc
-
Wilmar International Limited
- *Disclaimer: Major Players sorted in no particular order

Recent Industry Developments
- June 2025: ACI Group has collaborated with International Flavors & Fragrances (IFF) to distribute IFF's high-performance plant-based proteins, including soy and pea derivatives such as isolates and structured proteins.
- May 2025: Bunge has launched a new range of soy protein concentrates at IFFA in Frankfurt, aimed at addressing key challenges in the plant-based protein market. These concentrates are designed to provide a clean taste, neutral color, and cost-efficient options for food manufacturers.
- November 2024: ICL Food Specialties and DAIZ Engineering introduced an innovative soy protein specifically developed to overcome sensory challenges in the plant-based meat and seafood industry, enhancing texture and flavor profiles.


Europe Soy Protein Market Report Scope
The Europe soy protein market processes protein-rich ingredients derived from soybeans into versatile forms. These forms find diverse applications, spanning food processing, animal nutrition, and health products.
The Europe soy protein market is segmented by form into soy protein concentrates, soy protein hydrolyzed, and soy protein isolates. By category, the market is segmented into conventional and organic. The market is segmented by end user: animal feed, food and beverages, personal care and cosmetics, and supplements. The market is segmented by geography into Germany, the United Kingdom, Italy, France, Spain, the Netherlands, Poland, Belgium, Sweden, and the Rest of Europe. The market sizing has been done in value terms in USD and volume in tons for all the abovementioned segments.
By Form
| Soy Protein Concentrates |
| Soy Protein Hydrolyzed |
| Soy Protein Isolates |
By Category
| Conventional |
| Organic |
By End-User
| Animal Feed | |
| Food and Beverages | Bakery |
| Beverages | |
| Breakfast Cereals | |
| Condiments/Sauces | |
| Confectionery | |
| Dairy and Dairy Alternatives | |
| Meat/Poultry/Seafood and Meat Alternative Products | |
| RTE/RTC Foods | |
| Snacks | |
| Personal Care and Cosmetics | |
| Supplements | Baby Food and Infant Formula |
| Elderly and Medical Nutrition | |
| Sport/Performance Nutrition |
By Geography
| Germany |
| United Kingdom |
| Italy |
| France |
| Spain |
| Netherlands |
| Poland |
| Belgium |
| Sweden |
| Rest of Europe |
| By Form | Soy Protein Concentrates | |
| Soy Protein Hydrolyzed | ||
| Soy Protein Isolates | ||
| By Category | Conventional | |
| Organic | ||
| By End-User | Animal Feed | |
| Food and Beverages | Bakery | |
| Beverages | ||
| Breakfast Cereals | ||
| Condiments/Sauces | ||
| Confectionery | ||
| Dairy and Dairy Alternatives | ||
| Meat/Poultry/Seafood and Meat Alternative Products | ||
| RTE/RTC Foods | ||
| Snacks | ||
| Personal Care and Cosmetics | ||
| Supplements | Baby Food and Infant Formula | |
| Elderly and Medical Nutrition | ||
| Sport/Performance Nutrition | ||
| By Geography | Germany | |
| United Kingdom | ||
| Italy | ||
| France | ||
| Spain | ||
| Netherlands | ||
| Poland | ||
| Belgium | ||
| Sweden | ||
| Rest of Europe | ||


Market Definition
- End User - The Protein Ingredients Market operates on a B2B basis. Food, Beverages, Supplements, Animal Feed, and Personal Care & Cosmetic manufacturers are considered to be end-consumers in the market studied. The scope excludes manufacturers buying liquid/dry whey to be used for application as a binding agent or thickener or other non-protein applications.
- Penetration Rate - Penetration Rate is defined as the percentage of Protein-Fortified End User Market Volume in the Overall End User Market Volume.
- Average Protein Content - Average protein content is the average protein content present per 100 g of product manufactured by all end-user companies considered under the scope of this report.
- End User Market Volume - End-user market volume is the consolidated volume of all types and forms of end-user products in the country or region.
| Keyword | Definition |
|---|---|
| Alpha-lactalbumin (α-Lactalbumin) | It is a protein that regulates the production of lactose in the milk of almost all mammalian species. |
| Amino acid | It is an organic compound that contains both amino and carboxylic acid functional groups, which are required for the synthesis of body protein and other important nitrogen-containing compounds, such as creatine, peptide hormones, and some neurotransmitters. |
| Blanching | It is the process of briefly heating vegetables with steam or boiling water. |
| BRC | British Retail Consortium |
| Bread improver | It is a flour-based blend of several components with specific functional properties designed to modify dough characteristics and give quality attributes to bread. |
| BSF | Black Soldier Fly |
| Caseinate | It is a substance produced by adding an alkali to acid casein, a derivative of casein. |
| Celiac disease | Celiac disease is an immune reaction to eating gluten, a protein found in wheat, barley, and rye. |
| Colostrum | It is a milky fluid that’s released by mammals that have recently given birth before breast milk production begins. |
| Concentrate | It is the least processed form of protein and has a protein content ranging from 40-90% by weight. |
| Dry protein basis | It refers to the percentage of "pure protein" present in a supplement after the water in it is completely removed through heat. |
| Dry whey | It is the product resulting from drying fresh whey which has been pasteurized and to which nothing has been added as a preservative. |
| Egg protein | It is a mixture of individual proteins, including ovalbumin, ovomucoid, ovoglobulin, conalbumin, vitellin, and vitellenin. |
| Emulsifier | It is a food additive that facilitates the blending of foods that are immiscible with one another, such as oil and water. |
| Enrichment | It is the process of addition of micronutrients that are lost during the processing of the product. |
| ERS | Economic Research Service of the USDA |
| Extrusion | It is the process of forcing soft mixed ingredients through an opening in a perforated plate or die designed to produce the required shape. The extruded food is then cut to a specific size by blades. |
| Fava | Also known as Faba, it is another word for yellow split beans. |
| FDA | Food and Drug Administration |
| Flaking | It is a process in which typically a cereal grain (like corn, wheat, or rice) is broken down into grits, cooked with flavors and syrups, and then pressed into flakes between cooled rollers. |
| Foaming agent | It is a food ingredient that makes it possible to form or maintain a uniform dispersion of a gaseous phase in a liquid or solid food. |
| Foodservice | It refers to the part of the food industry which includes businesses, institutions, and companies which prepare meals outside the home. It includes restaurants, school and hospital cafeterias, catering operations, and many other formats. |
| Fortification | It is the deliberate addition of micronutrients that are not found in them naturally or which are lost during processing, to improve a food product's nutritional value. |
| FSANZ | Food Standards Australia New Zealand |
| FSIS | Food Safety and Inspection Service |
| FSSAI | Food Safety and Standards Authority of India |
| Gelling agent | It is an ingredient that functions as a stabilizer and thickener to provide thickening without stiffness through the formation of gel. |
| GHG | Greenhouse Gas |
| Gluten | It is a family of proteins found in grains, including wheat, rye, spelt, and barley. |
| Hemp | It is a botanical class of Cannabis sativa cultivars grown specifically for industrial or medicinal use. |
| Hydrolysate | It is a form of protein manufactured by exposing the protein to enzymes that can partially break the bonds between the protein's amino acids and break down large, complicated proteins into smaller pieces. Its processing makes it easier and quicker to digest. |
| Hypoallergenic | It refers to a substance that causes fewer allergic reactions. |
| Isolate | It is the purest and most processed form of protein which has undergone separation to obtain a pure protein fraction. It typically contains ≥ 90% of protein by weight. |
| Keratin | It is a protein that helps form hair, nails, and the outer layer of skin. |
| Lactalbumin | It is the albumin contained in milk and obtained from whey. |
| Lactoferrin | It is an iron‑binding glycoprotein that is present in the milk of most mammals. |
| Lupin | It is the yellow legume seeds of the genus Lupinus. |
| Millenial | Also known as Generation Y or Gen Y, it refers to the people born from 1981 to 1996. |
| Monogastric | It refers to an animal with a single-compartmented stomach. Examples of monogastric include humans, poultry, pigs, horses, rabbits, dogs, and cats. Most monogastric are generally unable to digest much cellulose food materials such as grasses. |
| MPC | Milk protein concentrate |
| MPI | Milk protein isolate |
| MSPI | Methylated soy protein isolate |
| Mycoprotein | Mycoprotein is a form of single-cell protein, also known as fungal protein, derived from fungi for human consumption. |
| Nutricosmetics | It is a category of products and ingredients that act as nutritional supplements to care for skin, nails, and hair natural beauty. |
| Osteoporosis | It is a medical condition in which the bones become brittle and fragile from loss of tissue, typically as a result of hormonal changes, or deficiency of calcium or vitamin D. |
| PDCAAS | Protein digestibility-corrected amino acid score (PDCAAS) is a method of evaluating the quality of a protein based on both the amino acid requirements of humans and their ability to digest it. |
| Per-capita consumption of animal protein | It is the average amount of animal protein (such as milk, whey, gelatin, collagen, and egg proteins) that is readily available for consumption by each person in an actual population. |
| Per-capita consumption of plant protein | It is the average amount of plant protein (such as soy, wheat, pea, oat, and hemp proteins) that is readily available for consumption by each person in an actual population. |
| Quorn | It is a microbial protein manufactured using mycoprotein as an ingredient, in which the fungus culture is dried and mixed with egg albumen or potato protein, which acts as a binder, and then is adjusted in texture and pressed into various forms. |
| Ready-to-Cook (RTC) | It refers to food products that include all of the ingredients, where some preparation or cooking is required through a process that is given on the package. |
| Ready-to-Eat (RTE) | It refers to a food product prepared or cooked in advance, with no further cooking or preparation required before being eaten. |
| RTD | Ready-to-Drink |
| RTS | Ready-to-Serve |
| Saturated fat | It is a type of fat in which the fatty acid chains have all single bonds. It is generally considered unhealthy. |
| Sausage | It is a meat product made of finely chopped and seasoned meat, which may be fresh, smoked, or pickled and which is then usually stuffed into a casing. |
| Seitan | It is a plant-based meat substitute made out of wheat gluten. |
| Softgel | It is a gelatin-based capsule with a liquid fill. |
| SPC | Soy protein concentrate |
| SPI | Soy protein isolate |
| Spirulina | It is a biomass of cyanobacteria that can be consumed by humans and animals. |
| Stabilizer | It is an ingredient added to food products to help maintain or enhance their original texture, and physical and chemical characteristics. |
| Supplementation | It is the consumption or provision of concentrated sources of nutrients or other substances that are intended to supplement nutrients in the diet and is intended to correct nutritional deficiencies. |
| Texturant | It is a specific type of food ingredient that is used to control and alter the mouthfeel and texture of food and beverage products. |
| Thickener | It is an ingredient that is used to increase the viscosity of a liquid or dough and make it thicker, without substantially changing its other properties. |
| Trans fat | Also called trans-unsaturated fatty acids or trans fatty acids, it is a type of unsaturated fat that naturally occurs in small amounts in meat. |
| TSP | Textured soy protein |
| TVP | Textured vegetable protein |
| WPC | Whey protein concentrate |
| WPI | Whey protein isolate |


Research Methodology
Mordor Intelligence follows a four-step methodology in all our reports.
- Step-1: Identify Key Variables: The quantifiable key variables (industry and extraneous) pertaining to the specific product segment and country are selected from a group of relevant variables & factors based on desk research & literature review; along with primary expert inputs. These variables are further confirmed through regression modeling (wherever required).
- Step-2: Build a Market Model: In order to build a robust forecasting methodology, the variables and factors identified in Step-1 are tested against available historical market numbers. Through an iterative process, the variables required for market forecast are set and the model is built on the basis of these variables.
- Step-3: Validate and Finalize: In this important step, all market numbers, variables and analyst calls are validated through an extensive network of primary research experts from the market studied. The respondents are selected across levels and functions to generate a holistic picture of the market studied.
- Step-4: Research Outputs: Syndicated Reports, Custom Consulting Assignments, Databases & Subscription Platforms


