Market Overview
| Study Period | 2021 - 2031 |
|---|---|
| Forecast Data Period | 2026 - 2031 |
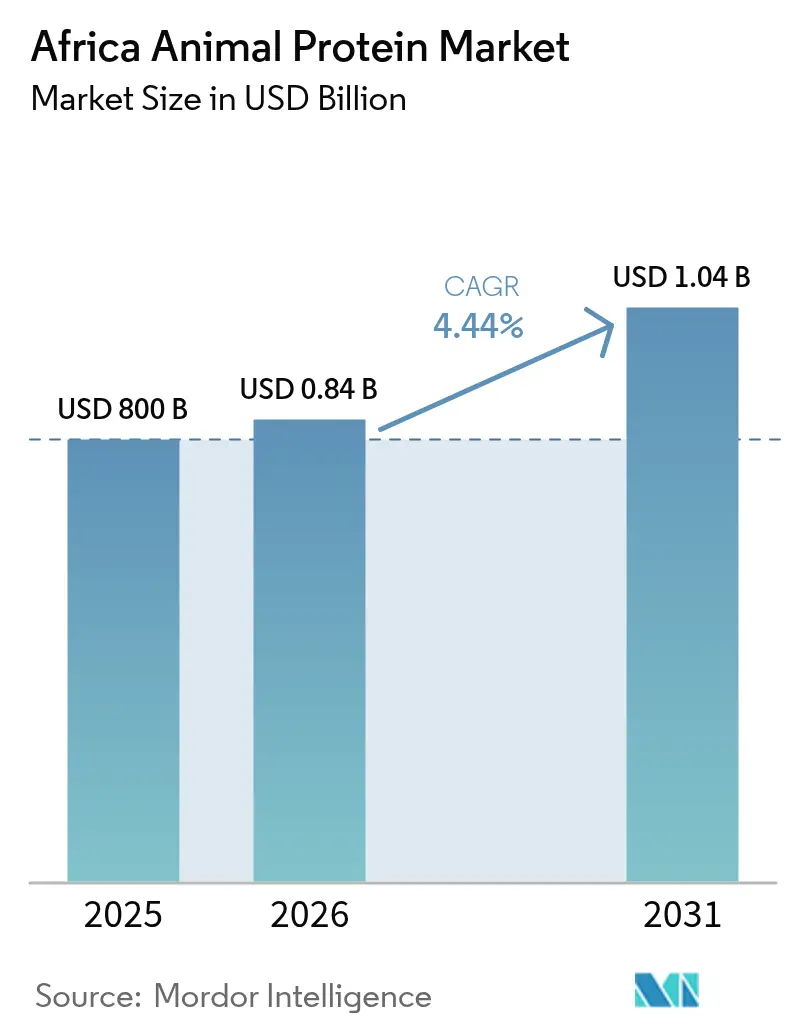
| Base Year Market Size (2025) | USD 800 Billion |
| Market Size (2026) | USD 0.84 Billion |
| Market Size (2031) | USD 1.04 Billion |
| Growth Rate (2026 - 2031) | 4.44% CAGR |
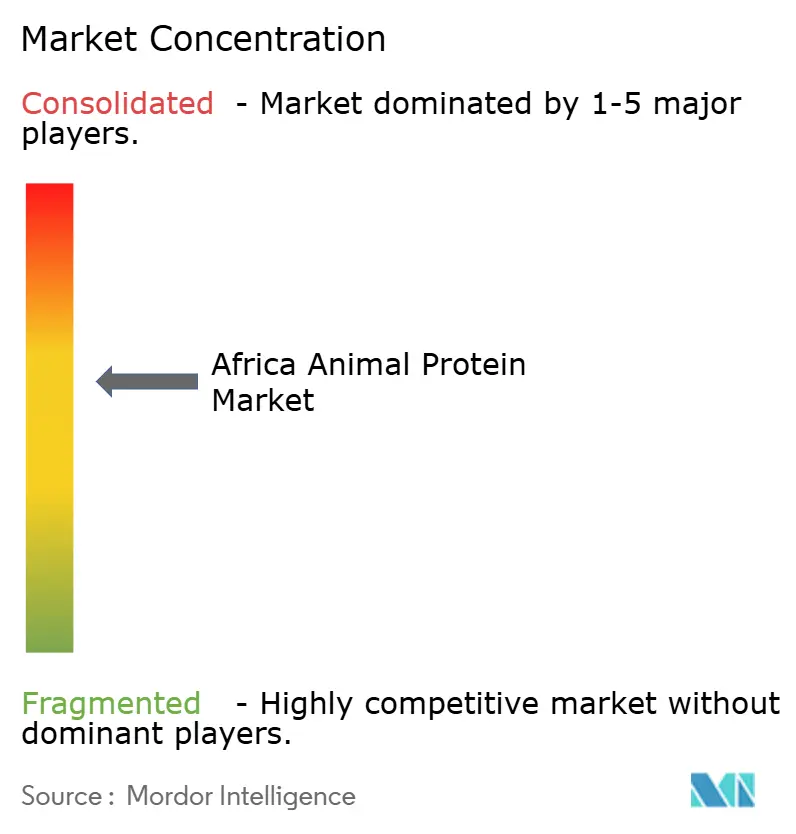
| Market Concentration | Medium |
Major Players *Disclaimer: Major Players sorted in no particular order Image © Mordor Intelligence. Reuse requires attribution under CC BY 4.0. | |
Africa Animal Protein Market Analysis by Mordor Intelligence
Africa animal protein market size in 2026 is estimated at USD 835.52 million, growing from 2025 value of USD 800 million with 2031 projections showing USD 1,038.22 million, growing at 4.44% CAGR over 2026-2031. This growth reflects a shift from import reliance to regional processing, driven by initiatives such as dairy self-sufficiency programs, aquaculture development, and private-sector investments in insect-protein production. Key contributors include Nigeria's National Dairy Policy, South Africa's consistent net-export position in whey and cheese, and Egypt's rapidly expanding aquafeed industry, which collectively boost demand for high-value products like isolates, concentrates, and collagen peptides. Additionally, consumer preferences for clean-label nutrition, fortified foods, and organic certifications are creating opportunities in premium price segments. This has prompted processors to adopt advanced technologies such as membrane filtration, spray drying, and hydrolysis, despite the high capital costs. Multinational suppliers are increasingly focusing on technology transfer and vertical integration to retain value within the continent, reducing reliance on exporting raw materials for processing abroad.
Key Report Takeaways
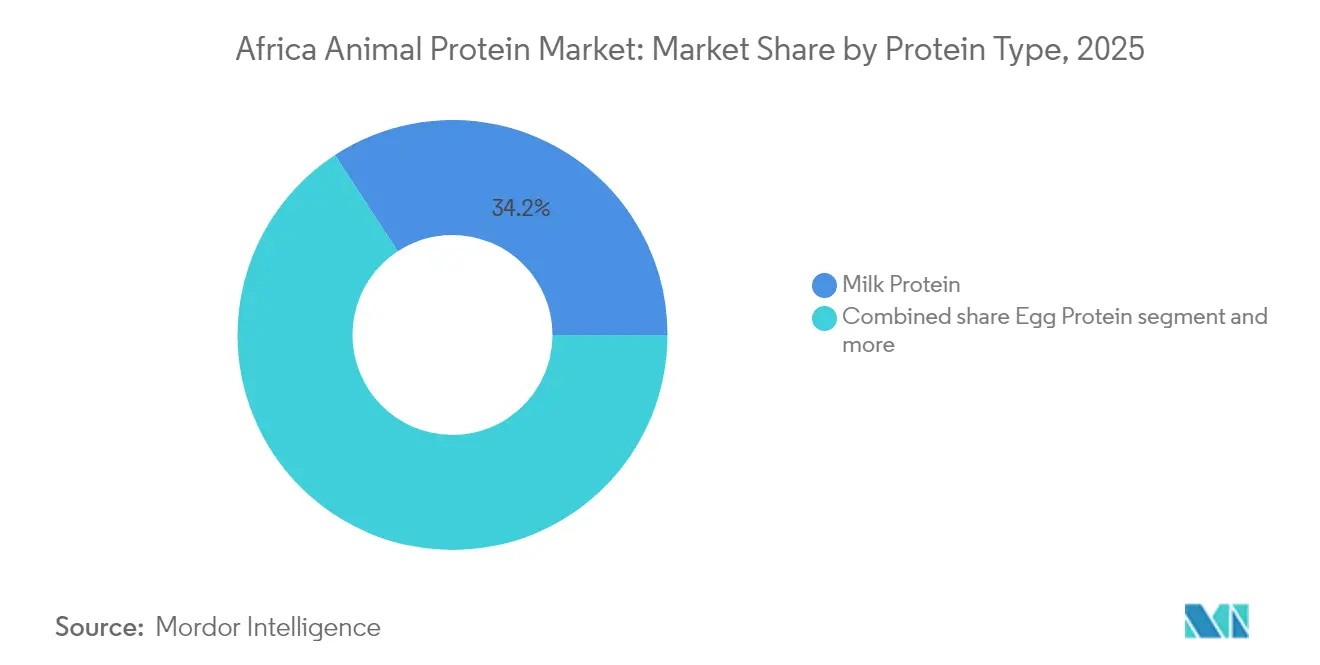
- By protein type, milk protein led with 34.21% of Africa animal protein market share in 2025, while insect protein is forecast to post the fastest 5.74% CAGR to 2031.
- By category, conventional variants commanded 82.96% of the Africa animal protein market size in 2025; organic proteins are advancing at a 5.67% CAGR through 2031.
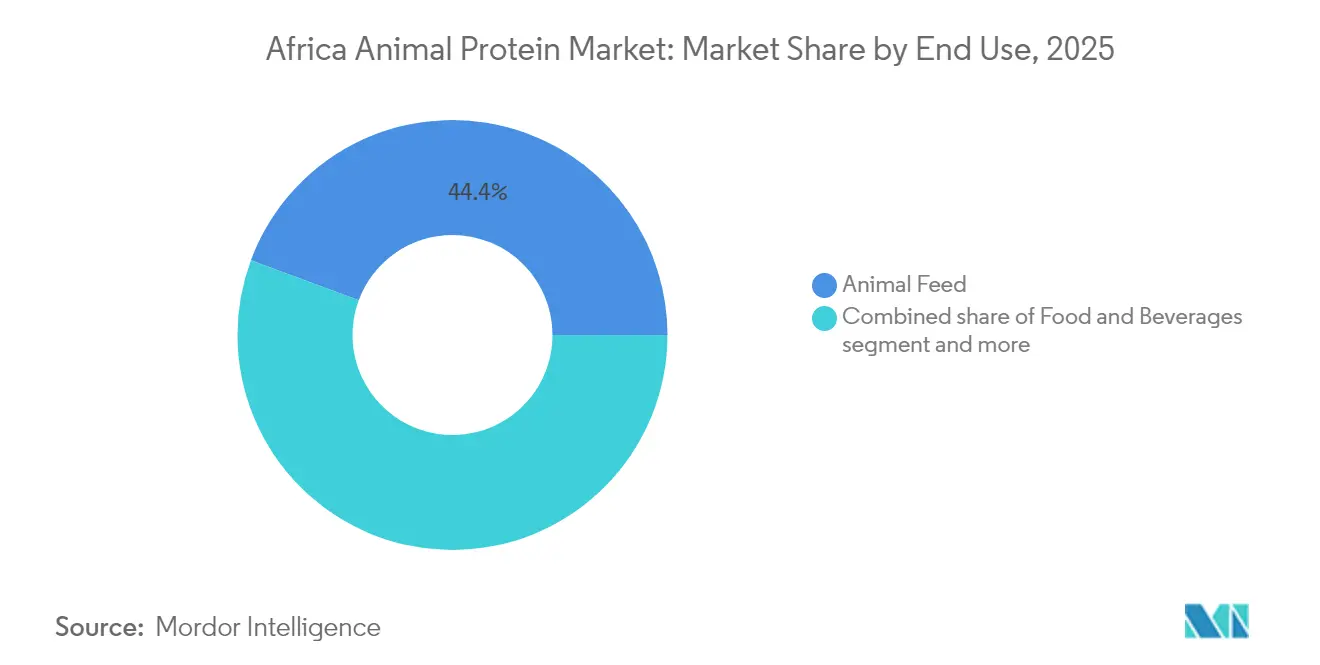
- By end user, animal feed accounted for 44.35% of revenue in 2025, whereas the food and beverages segment is set to expand at a 5.55% CAGR over the same period.
- By geography, Nigeria secured a 37.92% Africa animal protein market share in 2025 and is poised to grow at a 5.86% CAGR to 2031.
Note: Market size and forecast figures in this report are generated using Mordor Intelligence’s proprietary estimation framework, updated with the latest available data and insights as of 2026.
Africa Animal Protein Market Trends and Insights
Drivers Impact Analysis*
| Driver | (~)% Impact on CAGR Forecast | Geographic Relevance | Impact Timeline |
|---|---|---|---|
| Health and wellness trends emphasizing nutritious ingredients | +0.8% | Nigeria, South Africa, urban centers across Rest of Africa | Medium term (2–4 years) |
| High-protein, low-sugar, and clean-label product demand | +0.7% | South Africa, Nigeria, Kenya | Short term (≤ 2 years) |
| Preference for organic and sustainable protein options | +0.6% | South Africa, Kenya, Tanzania, Uganda | Long term (≥ 4 years) |
| Value-added and processed animal protein products rising | +0.5% | Nigeria, Egypt, South Africa | Medium term (2–4 years) |
| Interest in premium, high-quality, and ethnic meat options | +0.4% | Nigeria, South Africa, Ghana | Medium term (2–4 years) |
| Demand for diversified protein sources | +0.5% | Global, with early adoption in Egypt, Tunisia, South Africa | Long term (≥ 4 years) |
| Source: Mordor Intelligence | |||


Growing Health and Wellness Trends Emphasize Nutritious Ingredients
The expanding urban middle class in Nigeria and South Africa is significantly influencing protein consumption patterns, with a growing emphasis on the nutritional value and functional benefits of food rather than merely focusing on caloric intake. In Nigeria, the gap between domestic milk production and consumption remains substantial, resulting in a heavy dependence on imports and the associated financial burden. To address this challenge, the Nigerian government introduced the National Dairy Policy (NDP) in mid-2024, a strategic initiative designed to substantially boost domestic milk production over the coming years [1]Source: Federal Ministry of Agriculture and Food Security, “National Dairy Policy 2023–2028,” FMARD, fmard.gov.ng. This policy focuses on improving livestock breeds, providing feed subsidies, and fostering a sustainable dairy ecosystem, thereby aligning the twin objectives of enhancing nutrition security and achieving self-sufficiency in animal protein production. Additionally, the rising demand for wellness-oriented food products is expected to drive significant growth in the market. These impacts are likely to become more pronounced in the medium term as investments in infrastructure and cold-chain systems are strengthened to better support the availability of fresh and chilled protein products.
Increasing Demand for High-Protein, Low-Sugar, and Clean-Label Products
Regulatory emphasis on clean-label claims has gained significant traction, exemplified by the World Health Organization's (WHO) launch of the Alliance for Food Safety [2]Source: World Health Organization, “WHO Launches Alliance for Food Safety,” WHO, who.int. This initiative, which brings together multiple stakeholders, is focused on creating standardized guidelines for ingredient disclosure and allergen labeling across member states, thereby fostering greater transparency and trust within the food industry. In alignment with these regulatory developments, South Africa's dairy industry has taken proactive measures to adapt and thrive, particularly by increasing the production of whey-protein concentrate and isolate. Among concentrated products, whey powder has emerged as a significant segment, with South Africa achieving a notable surplus in exports compared to imports, highlighting its growing prominence in the global market. Collagen4Africa, a leading South African producer, offers hydrolyzed bovine collagen that is characterized by its high protein content, absence of sugar, and adherence to multiple certifications, including Halaal, Kosher, Hazard Analysis and Critical Control Points (HACCP), ISO 9001:2015, and Food Safety System Certification (FSSC) 22000:2010. These features make the product particularly well-suited for applications in sports nutrition and medical nutrition, addressing the evolving needs of health-conscious consumers. Furthermore, Fan Milk, a prominent player in the dairy sector, recently inaugurated a yogurt production line in Ibadan, Nigeria. This facility incorporates advanced membrane-filtration technology, which effectively removes lactose while preserving whey proteins, aligning with the increasing consumer preference for low-sugar and health-oriented products.
Stronger Preference for Organic and Sustainable Protein Options
Ecocert South Africa's certification footprint spans 15 countries, including Namibia, Zimbabwe, Mozambique, Zambia, Lesotho, Malawi, Botswana, Eswatini, Uganda, Ethiopia, Kenya, Tanzania, and Nigeria. This extensive reach enables dairy and livestock producers in these regions to access premium export markets in Europe and North America, providing significant opportunities for growth and market expansion. The Research Institute of Organic Agriculture (FiBL)'s 2024 guidance on organic dairy farming in Africa emphasizes critical practices such as breed selection, rotational grazing, and natural pest control. These sustainable practices, while beneficial, often require multi-year transitions and substantial upfront capital investments, which can pose challenges for many smallholder farmers. Furthermore, Symrise's October 2024 launch of regenerative agriculture projects, including a Madagascar vanilla initiative, demonstrates increasing corporate interest in developing traceable, low-carbon supply chains that resonate with buyers focused on Environmental, Social, and Governance (ESG) criteria. The long-term impact—0.6 percentage points—highlights the extended timelines for certification and the significant infrastructure investments required to scale organic protein production beyond niche markets in Kenya, Tanzania, and South Africa.
Demand for Value-Added and Processed Animal Protein Products Rising
Nigeria's livestock inventory comprises a significant number of chickens, cattle, goats, sheep, and pigs. Despite this substantial resource, it remains underutilized for value-added processing, as the majority of animals are slaughtered in informal settings that lack access to cold-chain infrastructure. In April 2025, Lactalis announced its intention to explore the establishment of a new dairy plant in Nigeria aimed at producing milk powder and caseinates. This initiative is expected to complement its earlier investment in a spray-dryer facility in South Africa, which was initiated in April 2023. The International Livestock Research Institute (ILRI) and the African Union are working together to create the continent's first safety guidelines for informal food markets. This framework is designed to standardize hygiene protocols and enable small processors to secure financing for adopting advanced technologies such as pasteurization and protein-fractionation equipment. The medium-term impact of this development is closely tied to the expansion of cold-chain infrastructure and the establishment of clear regulations for processed-protein labeling. Nigeria and Egypt are emerging as key players in driving these advancements forward.
Restraints Impact Analysis*
| Restraint | (~)% Impact on CAGR Forecast | Geographic Relevance | Impact Timeline |
|---|---|---|---|
| Regulatory complexities and inconsistent enforcement across countries | -0.6% | Nigeria, Kenya, Tanzania, Rest of Africa | Short term (≤ 2 years) |
| Competition from plant-based and insect-based protein alternatives | -0.5% | South Africa, Nigeria, Egypt | Medium term (2–4 years) |
| Limited access to modern technology and financing for small farmers | -0.4% | Nigeria, Kenya, Uganda, Tanzania, Rest of Africa | Long term (≥ 4 years) |
| Cultural barriers and traditional consumption preferences | -0.3% | Nigeria, Ghana, Rest of Africa | Long term (≥ 4 years) |
| Source: Mordor Intelligence | |||
Regulatory Complexities and Inconsistent Enforcement Across Countries
The Codex Alimentarius Committee on Food Hygiene, co-chaired by Kenya and Nigeria, advanced draft guidelines in 2024 aimed at improving traditional informal markets. These markets are responsible for handling a significant majority of East African milk but often operate outside formal inspection systems, posing challenges to food safety and quality. In the same year, the World Organisation for Animal Health (WOAH) updated its Terrestrial and Aquatic Animal Health Codes, introducing stricter residue limits for veterinary drugs to enhance animal product safety [3]Source: World Organisation for Animal Health, “Terrestrial and Aquatic Animal Health Codes 2024,” WOAH, woah.org. However, the capacity to enforce these updated standards varies widely across countries. For example, a dairy survey conducted in Rwanda during 2024 identified antibiotic residues in a notable portion of samples, exceeding the thresholds set by Codex. The short-term economic impact reflects immediate compliance costs and potential trade disruptions as governments work to align their standards. Among the affected nations, Nigeria, Kenya, and Tanzania are expected to encounter the most significant challenges in adjusting to these new requirements.
Competition from Plant-Based and Insect-Based Protein Alternatives
Soybean meal continues to be an essential component in poultry and aquaculture feed formulations across Africa, offering a high level of crude protein at a more affordable cost compared to alternatives like fishmeal and blood meal. This cost efficiency becomes particularly valuable during periods of rising maize prices, which can significantly increase feed expenses and heavily impact poultry production budgets in Nigeria. Plant-based protein isolates, including those derived from pea, faba bean, and sunflower, are gaining traction in human nutrition applications due to their versatility and nutritional benefits. Bühler's protein application center is making advancements in extrusion and texturization technologies to develop products with textures that closely mimic meat. Insect proteins, although derived from animals, are increasingly positioning themselves as viable alternatives to conventional dairy and meat proteins in feed markets. For instance, nextProtein's black soldier fly meal is specifically designed for aquaculture feeds, where it can serve as a substitute for fishmeal at substantial replacement rates, thereby reducing the dependency on traditional animal-protein ingredients.
*Our forecasts treat driver/restraint impacts as directional, not additive. The impact forecasts reflect baseline growth, mix effects, and variable interactions.
Segment Analysis
By Protein Type: Insect Proteins Disrupt Dairy's Dominance
Milk protein accounted for 34.21% of segment revenue in 2025, supported by South Africa's milk production of 3.46 million tonnes, reflecting a 3.56% year-on-year increase. This growth is further bolstered by Nigeria's initiative to double domestic milk output by 2028 under the National Dairy Policy, which aims to enhance self-sufficiency and reduce reliance on imports. Whey protein, categorized into whey protein concentrates (WPC), hydrolyzed whey protein, and whey protein isolates (WPI), benefits significantly from South Africa's net export position of 20,000 tonnes in 2024. Whey powder, which constitutes 13% of concentrated dairy products, finds widespread applications in sports nutrition and infant formula, highlighting its versatility and growing demand in these sectors.
Casein and caseinates primarily serve the industrial bakery and processed meat sectors, offering functional benefits such as improved texture and shelf life. Meanwhile, egg protein remains a niche market. In South Africa, Ovo Protein specializes in producing egg-white powder, which is utilized in confectionery and personal care applications. However, the Middle East and Africa egg-white powder market was valued at only USD 60.98 million in 2023, indicating limited regional demand. Insect protein has emerged as the fastest-growing segment, with a compound annual growth rate (CAGR) of 5.74% projected through 2031. This growth is driven by nextProtein's €18 million Series B funding secured in November 2025 to scale its black soldier fly facility in Tunisia, which has a production capacity of 12,000 tonnes per year. The facility focuses on producing larvae meal as a cost-effective and sustainable alternative to fishmeal for aquaculture feeds.


By Category: Organic Certification Networks Scale Despite Smallholder Constraints
Conventional proteins accounted for 82.96% of the market share in 2025, primarily due to cost sensitivity among consumers and the limited adoption of organic certification by smallholder farmers. These smallholders, who contribute over 80% of East Africa's milk supply, face challenges in meeting organic standards. In Rwanda's dairy sector, testing revealed that 12.9% of milk samples contained antibiotic residues, while 25.6% tested positive for Salmonella. These quality issues create significant barriers for producers aiming to enter organic export markets. Similarly, in Nigeria, conventional processing remains dominant, handling 563 million chickens and 58 million cattle. However, most animals are slaughtered in informal settings that lack traceability systems, which are essential for meeting organic certification requirements.
Organic animal proteins are expected to grow at a compound annual growth rate (CAGR) of 5.67% through 2031. This growth is driven by the certification efforts of Ecocert South Africa, a leading organic certification body, which operates across 15 countries, including Namibia, Zimbabwe, Mozambique, Zambia, Lesotho, Malawi, Botswana, Eswatini, Uganda, Ethiopia, Kenya, Tanzania, and Nigeria. These certifications provide dairy and livestock producers with the opportunity to access premium markets in Europe and North America, where demand for organic products continues to rise. By meeting stringent organic standards, producers can achieve higher profitability and expand their market reach.
By End User: Aquaculture Feed Demand Outpaces Food and Beverage Innovation
Animal Feed accounted for 44.35% of end-user revenue in 2025, primarily driven by the rapid expansion of aquaculture in Africa. Aquaculture production in the region increased from 2.9 million tonnes in 2022 and is projected to reach 7.1 million tonnes by 2030, growing at an annual rate of 12.3%, which is the fastest growth rate globally. Poultry production, which stood at 7.5 million tonnes in 2022, is expected to rise to 10.6 million tonnes by 2030. This growth is heavily dependent on essential feed components such as soybean meal, fishmeal, and feather meal. In Nigeria, feed costs represent a significant 70% of poultry production expenses, underscoring the critical role of feed in the overall cost structure of the industry.
The Food and Beverages segment is projected to grow at a compound annual growth rate (CAGR) of 5.55% through 2031, driven by diverse product categories such as Bakery, Beverages, Breakfast Cereals, Condiments/Sauces, Confectionery, Dairy and Dairy Alternatives, Ready-to-Eat (RTE) Foods, Ready-to-Cook (RTC) Foods, and Snacks. A notable development in this segment is Fan Milk's commissioning of a USD 9.1 million yoghurt production line in Ibadan in September 2024. This facility utilizes advanced membrane filtration technology to produce yoghurt formats that are low in lactose and high in protein, catering to evolving consumer preferences for healthier and functional food options.
Geography Analysis
In 2025, Nigeria stood out as the leading segment in the regional dairy market, capturing a notable 37.92% market share. This leadership is underpinned by the National Dairy Policy, introduced in June 2024, which aims to double domestic milk production by 2028. Despite producing 0.7 billion liters of milk annually, Nigeria faces a significant shortfall compared to its consumption of 1.6 billion liters, resulting in an import bill of USD 1.2 billion to USD 1.5 billion. To bridge this gap, the government has implemented initiatives such as breed improvement programs, feed subsidies, and the establishment of hygienic milk collection centers. FrieslandCampina's Value4Dairy consortium has also played a pivotal role, securing a USD 5 million grant from the Gates Foundation in January 2024 to train 10,000 smallholder farmers in herd health and milk handling practices. Furthermore, Arla Foods introduced its Dano products in October 2024, while Lactalis is evaluating the establishment of a new dairy plant, announced in April 2025. However, the country's vast livestock inventory, including 563 million chickens, 58 million cattle, 124 million goats, 60 million sheep, and 16 million pigs, remains underutilized for value-added processing, with informal slaughtering practices still prevalent. The National Livestock Transformation Plan (2019-2028) seeks to modernize abattoirs and cold chain infrastructure, although progress has been slower than expected.
South Africa represents the fastest-growing segment in the regional dairy market, with milk production reaching 3.46 million tonnes in 2025, reflecting a 3.56% year-on-year increase. The country has positioned itself as a net exporter of dairy products, achieving net exports of 20,000 tonnes, with 54,000 tonnes shipped and 34,000 tonnes imported. This growth highlights South Africa's strategic focus on export-oriented dairy processing, which has enabled it to strengthen its role as a key player in the regional market. By effectively balancing domestic production with export demands, South Africa continues to leverage its dairy industry for economic advancement.
The rest of Africa demonstrates a range of growth drivers and opportunities. Egypt leads the region in aquaculture, accounting for over 75% of Africa's production with 1.8 million tonnes in 2020. Tunisia is emerging as a significant player in insect protein production, with nextProtein securing €18 million in Series B funding in November 2025 to establish a 12,000-tonne-per-year black soldier fly facility. These developments underscore the diverse nature of growth across the region. While Nigeria's dairy market thrives on policy-driven initiatives and South Africa focuses on export-oriented processing, Egypt's growth is propelled by aquaculture feed demand. Meanwhile, other regions in Africa are striving to enhance smallholder productivity while addressing critical challenges related to infrastructure development and regulatory harmonization, which are essential for sustained growth.
Competitive Landscape
The market demonstrates moderate fragmentation, with multinational dairy processors such as FrieslandCampina, Arla Foods, Fonterra, and Lactalis competing alongside regional players like Clover and Woodlands in South Africa. Additionally, innovative insect-protein startups such as nextProtein and AgriProtein are emerging as key players. Strategic approaches in the market are increasingly focused on vertical integration and localized manufacturing. For example, Symrise, a global supplier of fragrances, flavors, and nutrition, announced in February 2025 the establishment of a 30,000-square-meter facility in Giza, Egypt. This facility consolidates two existing production sites and an innovation center, with the goal of doubling production capacity in the mid-term to serve 22 markets across Africa, the Middle East, Turkey, and Central Asia.
FrieslandCampina's Value4Dairy consortium, supported by a USD 5 million grant from the Bill & Melinda Gates Foundation in January 2024, is a noteworthy initiative aimed at training 10,000 Nigerian smallholders in hygienic milk handling practices. This program not only enhances the quality and safety of milk production but also strengthens upstream supply chains and fosters long-term brand loyalty. Such capacity-building efforts highlight the importance of empowering local farmers while ensuring a sustainable and reliable supply of raw materials for the dairy industry.
Emerging disruptors in the market include nextProtein, which raised EUR 18 million in November 2025 to scale its black soldier fly production to 12,000 tonnes annually in Tunisia, and AgriProtein, which plans to invest ZAR 500 million in a new facility in Gauteng, South Africa. This factory will focus on producing insect-based meal for poultry and aquaculture feeds, addressing the growing demand for sustainable protein sources. The competitive landscape increasingly rewards companies that combine upstream farmer training, mid-stream processing technologies, and downstream brand development. In contrast, businesses that rely heavily on commodity pricing and informal distribution channels face significant challenges in maintaining competitiveness.
Africa Animal Protein Industry Leaders
Amesi Group
Fonterra Co-operative Group Ltd
Hilmar Cheese Co Inc
Kerry Group plc
Lactoprot Deutschland GmbH
- *Disclaimer: Major Players sorted in no particular order

Recent Industry Developments
- November 2025: nextProtein has secured EUR 18 million in Series B funding to expand its black soldier fly production facility in Tunisia to a capacity of 12,000 tonnes per year. The company aims to supply aquaculture feeds, offering insect meal as a cost-effective and environmentally sustainable alternative to fishmeal.
- October 2024: Dano, under Arla Foods, launched two new dairy products in Nigeria and invested in a state-of-the-art dairy farm in Kaduna. This strengthens Nigeria’s dairy value chain, boosts availability of high-quality nutrition, and promotes sustainable dairy farming in Africa with modern global standards.
- July 2024: Equitane’s creation of PAPCO will boost Africa’s animal protein market by enhancing local production, fostering food security, and creating over 10,000 jobs. Starting in Benin, the initiative will expand to several countries, reduce imports, and promote sustainable economic growth.


Africa Animal Protein Market Report Scope
Casein and Caseinates, Collagen, Egg Protein, Gelatin, Insect Protein, Milk Protein, Whey Protein are covered as segments by Protein Type. Animal Feed, Food and Beverages, Personal Care and Cosmetics, Supplements are covered as segments by End User. Nigeria, South Africa are covered as segments by Country.By Protein Type
| Casein and Caseinates | |
| Collagen | |
| Egg Protein | |
| Gelatin | |
| Insect Protein | |
| Milk Protein | Concentrates |
| Hydrolyzed | |
| Isolates | |
| Whey Protein | Concentrates |
| Hydrolyzed | |
| Isolates | |
| Others |
By Category
| Organic |
| Conventional |
By End User
| Animal Feed | |
| Food and Beverages | Bakery |
| Beverages | |
| Breakfast Cereals | |
| Condiments/Sauces | |
| Confectionery | |
| Dairy & Dairy Alternatives | |
| RTE/RTC Foods | |
| Snacks | |
| Personal Care and Cosmetics | |
| Nutritional Supplements | Baby and Infant Formula |
| Elderly and Medical Nutrition | |
| Sport/Performance Nutrition |
By Geography
| Nigeria |
| South Africa |
| Rest of Africa |
| By Protein Type | Casein and Caseinates | |
| Collagen | ||
| Egg Protein | ||
| Gelatin | ||
| Insect Protein | ||
| Milk Protein | Concentrates | |
| Hydrolyzed | ||
| Isolates | ||
| Whey Protein | Concentrates | |
| Hydrolyzed | ||
| Isolates | ||
| Others | ||
| By Category | Organic | |
| Conventional | ||
| By End User | Animal Feed | |
| Food and Beverages | Bakery | |
| Beverages | ||
| Breakfast Cereals | ||
| Condiments/Sauces | ||
| Confectionery | ||
| Dairy & Dairy Alternatives | ||
| RTE/RTC Foods | ||
| Snacks | ||
| Personal Care and Cosmetics | ||
| Nutritional Supplements | Baby and Infant Formula | |
| Elderly and Medical Nutrition | ||
| Sport/Performance Nutrition | ||
| By Geography | Nigeria | |
| South Africa | ||
| Rest of Africa | ||


Market Definition
- End User - The Protein Ingredients Market operates on a B2B basis. Food, Beverages, Supplements, Animal Feed, and Personal Care & Cosmetic manufacturers are considered to be end-consumers in the market studied. The scope excludes manufacturers buying liquid/dry whey to be used for application as a binding agent or thickener or other non-protein applications.
- Penetration Rate - Penetration Rate is defined as the percentage of Protein-Fortified End User Market Volume in the Overall End User Market Volume.
- Average Protein Content - Average protein content is the average protein content present per 100 g of product manufactured by all end-user companies considered under the scope of this report.
- End User Market Volume - End-user market volume is the consolidated volume of all types and forms of end-user products in the country or region.
| Keyword | Definition |
|---|---|
| Alpha-lactalbumin (α-Lactalbumin) | It is a protein that regulates the production of lactose in the milk of almost all mammalian species. |
| Amino acid | It is an organic compound that contains both amino and carboxylic acid functional groups, which are required for the synthesis of body protein and other important nitrogen-containing compounds, such as creatine, peptide hormones, and some neurotransmitters. |
| Blanching | It is the process of briefly heating vegetables with steam or boiling water. |
| BRC | British Retail Consortium |
| Bread improver | It is a flour-based blend of several components with specific functional properties designed to modify dough characteristics and give quality attributes to bread. |
| BSF | Black Soldier Fly |
| Caseinate | It is a substance produced by adding an alkali to acid casein, a derivative of casein. |
| Celiac disease | Celiac disease is an immune reaction to eating gluten, a protein found in wheat, barley, and rye. |
| Colostrum | It is a milky fluid that’s released by mammals that have recently given birth before breast milk production begins. |
| Concentrate | It is the least processed form of protein and has a protein content ranging from 40-90% by weight. |
| Dry protein basis | It refers to the percentage of "pure protein" present in a supplement after the water in it is completely removed through heat. |
| Dry whey | It is the product resulting from drying fresh whey which has been pasteurized and to which nothing has been added as a preservative. |
| Egg protein | It is a mixture of individual proteins, including ovalbumin, ovomucoid, ovoglobulin, conalbumin, vitellin, and vitellenin. |
| Emulsifier | It is a food additive that facilitates the blending of foods that are immiscible with one another, such as oil and water. |
| Enrichment | It is the process of addition of micronutrients that are lost during the processing of the product. |
| ERS | Economic Research Service of the USDA |
| Extrusion | It is the process of forcing soft mixed ingredients through an opening in a perforated plate or die designed to produce the required shape. The extruded food is then cut to a specific size by blades. |
| Fava | Also known as Faba, it is another word for yellow split beans. |
| FDA | Food and Drug Administration |
| Flaking | It is a process in which typically a cereal grain (like corn, wheat, or rice) is broken down into grits, cooked with flavors and syrups, and then pressed into flakes between cooled rollers. |
| Foaming agent | It is a food ingredient that makes it possible to form or maintain a uniform dispersion of a gaseous phase in a liquid or solid food. |
| Foodservice | It refers to the part of the food industry which includes businesses, institutions, and companies which prepare meals outside the home. It includes restaurants, school and hospital cafeterias, catering operations, and many other formats. |
| Fortification | It is the deliberate addition of micronutrients that are not found in them naturally or which are lost during processing, to improve a food product's nutritional value. |
| FSANZ | Food Standards Australia New Zealand |
| FSIS | Food Safety and Inspection Service |
| FSSAI | Food Safety and Standards Authority of India |
| Gelling agent | It is an ingredient that functions as a stabilizer and thickener to provide thickening without stiffness through the formation of gel. |
| GHG | Greenhouse Gas |
| Gluten | It is a family of proteins found in grains, including wheat, rye, spelt, and barley. |
| Hemp | It is a botanical class of Cannabis sativa cultivars grown specifically for industrial or medicinal use. |
| Hydrolysate | It is a form of protein manufactured by exposing the protein to enzymes that can partially break the bonds between the protein's amino acids and break down large, complicated proteins into smaller pieces. Its processing makes it easier and quicker to digest. |
| Hypoallergenic | It refers to a substance that causes fewer allergic reactions. |
| Isolate | It is the purest and most processed form of protein which has undergone separation to obtain a pure protein fraction. It typically contains ≥ 90% of protein by weight. |
| Keratin | It is a protein that helps form hair, nails, and the outer layer of skin. |
| Lactalbumin | It is the albumin contained in milk and obtained from whey. |
| Lactoferrin | It is an iron‑binding glycoprotein that is present in the milk of most mammals. |
| Lupin | It is the yellow legume seeds of the genus Lupinus. |
| Millenial | Also known as Generation Y or Gen Y, it refers to the people born from 1981 to 1996. |
| Monogastric | It refers to an animal with a single-compartmented stomach. Examples of monogastric include humans, poultry, pigs, horses, rabbits, dogs, and cats. Most monogastric are generally unable to digest much cellulose food materials such as grasses. |
| MPC | Milk protein concentrate |
| MPI | Milk protein isolate |
| MSPI | Methylated soy protein isolate |
| Mycoprotein | Mycoprotein is a form of single-cell protein, also known as fungal protein, derived from fungi for human consumption. |
| Nutricosmetics | It is a category of products and ingredients that act as nutritional supplements to care for skin, nails, and hair natural beauty. |
| Osteoporosis | It is a medical condition in which the bones become brittle and fragile from loss of tissue, typically as a result of hormonal changes, or deficiency of calcium or vitamin D. |
| PDCAAS | Protein digestibility-corrected amino acid score (PDCAAS) is a method of evaluating the quality of a protein based on both the amino acid requirements of humans and their ability to digest it. |
| Per-capita consumption of animal protein | It is the average amount of animal protein (such as milk, whey, gelatin, collagen, and egg proteins) that is readily available for consumption by each person in an actual population. |
| Per-capita consumption of plant protein | It is the average amount of plant protein (such as soy, wheat, pea, oat, and hemp proteins) that is readily available for consumption by each person in an actual population. |
| Quorn | It is a microbial protein manufactured using mycoprotein as an ingredient, in which the fungus culture is dried and mixed with egg albumen or potato protein, which acts as a binder, and then is adjusted in texture and pressed into various forms. |
| Ready-to-Cook (RTC) | It refers to food products that include all of the ingredients, where some preparation or cooking is required through a process that is given on the package. |
| Ready-to-Eat (RTE) | It refers to a food product prepared or cooked in advance, with no further cooking or preparation required before being eaten. |
| RTD | Ready-to-Drink |
| RTS | Ready-to-Serve |
| Saturated fat | It is a type of fat in which the fatty acid chains have all single bonds. It is generally considered unhealthy. |
| Sausage | It is a meat product made of finely chopped and seasoned meat, which may be fresh, smoked, or pickled and which is then usually stuffed into a casing. |
| Seitan | It is a plant-based meat substitute made out of wheat gluten. |
| Softgel | It is a gelatin-based capsule with a liquid fill. |
| SPC | Soy protein concentrate |
| SPI | Soy protein isolate |
| Spirulina | It is a biomass of cyanobacteria that can be consumed by humans and animals. |
| Stabilizer | It is an ingredient added to food products to help maintain or enhance their original texture, and physical and chemical characteristics. |
| Supplementation | It is the consumption or provision of concentrated sources of nutrients or other substances that are intended to supplement nutrients in the diet and is intended to correct nutritional deficiencies. |
| Texturant | It is a specific type of food ingredient that is used to control and alter the mouthfeel and texture of food and beverage products. |
| Thickener | It is an ingredient that is used to increase the viscosity of a liquid or dough and make it thicker, without substantially changing its other properties. |
| Trans fat | Also called trans-unsaturated fatty acids or trans fatty acids, it is a type of unsaturated fat that naturally occurs in small amounts in meat. |
| TSP | Textured soy protein |
| TVP | Textured vegetable protein |
| WPC | Whey protein concentrate |
| WPI | Whey protein isolate |


Research Methodology
Mordor Intelligence follows a four-step methodology in all our reports.
- Step-1: Identify Key Variables: The quantifiable key variables (industry and extraneous) pertaining to the specific product segment and country are selected from a group of relevant variables & factors based on desk research & literature review; along with primary expert inputs. These variables are further confirmed through regression modeling (wherever required).
- Step-2: Build a Market Model: In order to build a robust forecasting methodology, the variables and factors identified in Step-1 are tested against available historical market numbers. Through an iterative process, the variables required for market forecast are set and the model is built on the basis of these variables.
- Step-3: Validate and Finalize: In this important step, all market numbers, variables and analyst calls are validated through an extensive network of primary research experts from the market studied. The respondents are selected across levels and functions to generate a holistic picture of the market studied.
- Step-4: Research Outputs: Syndicated Reports, Custom Consulting Assignments, Databases & Subscription Platforms


