Market Overview
| Study Period | 2021 - 2031 |
|---|---|
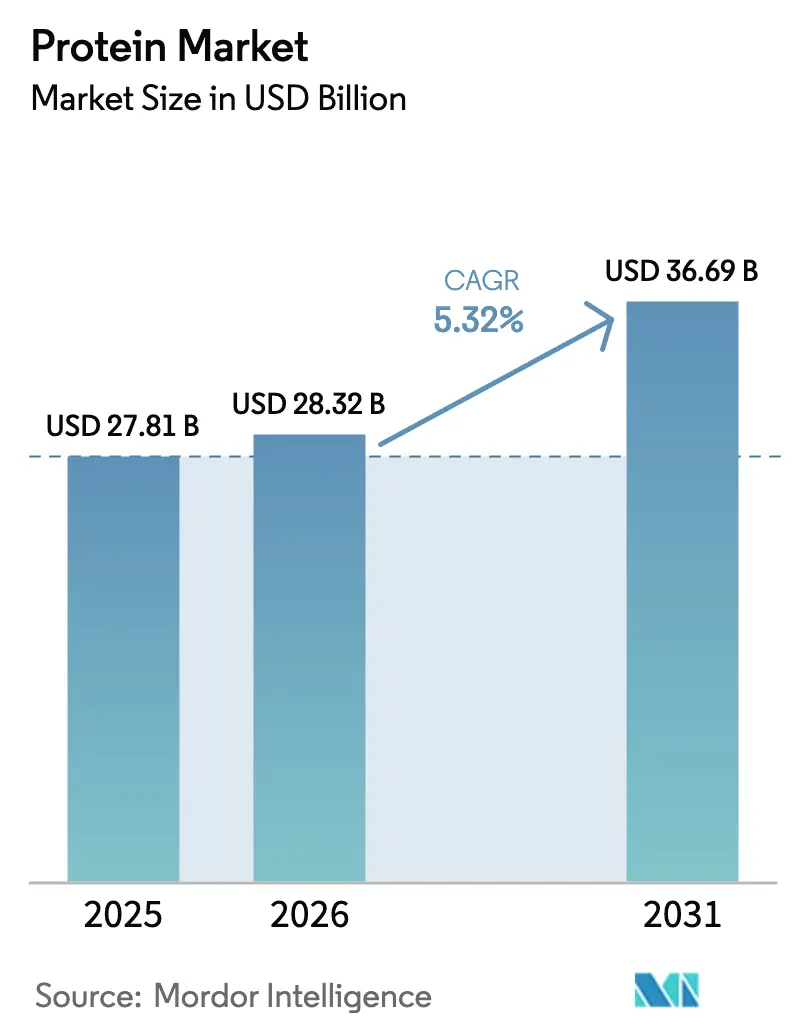
| Market Size (2026) | USD 28.32 Billion |
| Market Size (2031) | USD 36.69 Billion |
| Growth Rate (2026 - 2031) | 5.32% CAGR |
| Fastest Growing Market | Asia Pacific |
| Largest Market | North America |
| Market Concentration | Medium |
Major Players*Disclaimer: Major Players sorted in no particular order Image © Mordor Intelligence. Reuse requires attribution under CC BY 4.0. | |
Protein Market Analysis by Mordor Intelligence
The protein market size is expected to grow from USD 27.81 billion in 2025 to USD 28.32 billion in 2026 and is forecast to reach USD 36.69 billion by 2031 at a 5.32% CAGR over 2026-2031. This growth trajectory underscores a pronounced shift in demand towards premium isolates, hydrolysates, and ingredients derived from fermentation. Key drivers include the 2024 FDA GRAS status for precision-fermentation whey, the rising popularity of plant-based diets among Asia's burgeoning middle class, and a strategic reformulation in aquafeeds, replacing traditional fishmeal with insect and algae proteins to ensure supply stability. As processors harness enzymatic and membrane technologies, there's a notable shift from commodity dairy and soy to specialty proteins, leading to expanded margins. However, regulatory delays have birthed a two-tier market: while established animal and plant sources dominate in volume, novel proteins are fetching premium prices, especially in niches like sports nutrition and infant formulas. Today's competitive landscape is marked by strategies emphasizing vertical integration for cost efficiency, proprietary hydrolysis for enhanced performance claims, and targeted acquisitions as a buffer against commodity market fluctuations.
Key Report Takeaways
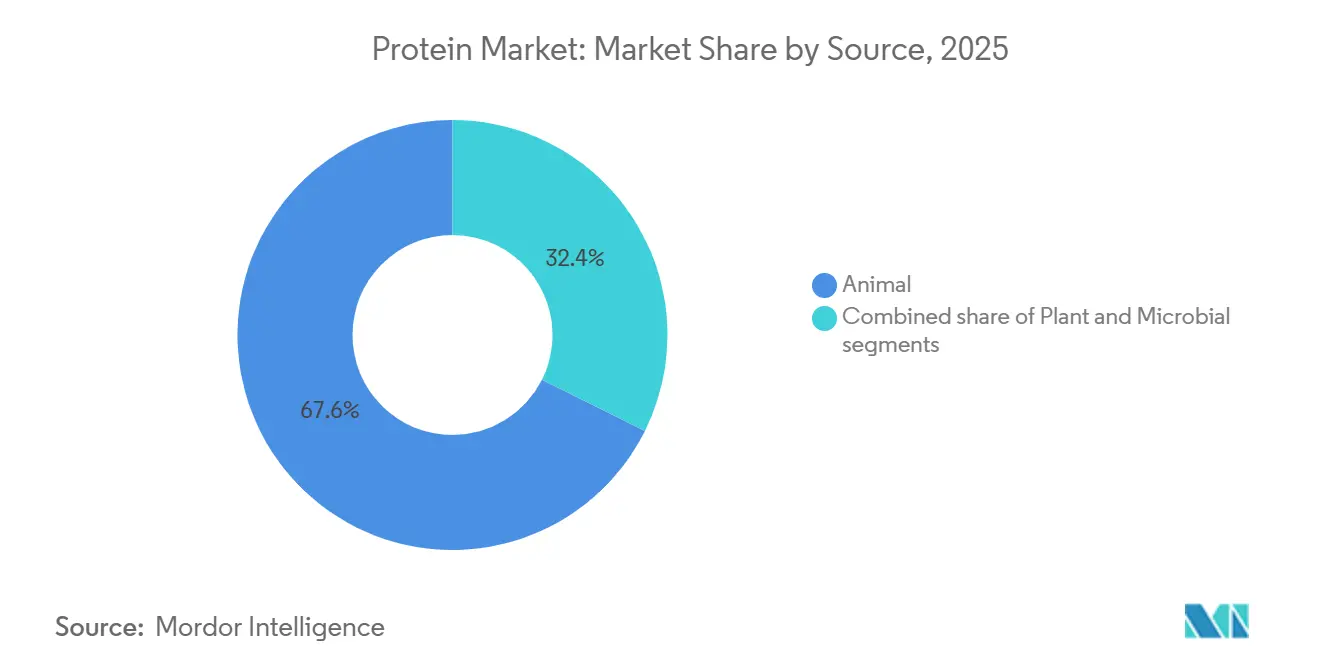
- By Source, animal-derived proteins led with 66.96% of protein market share in 2025, while plant proteins are advancing at a 7.80% CAGR through 2031.
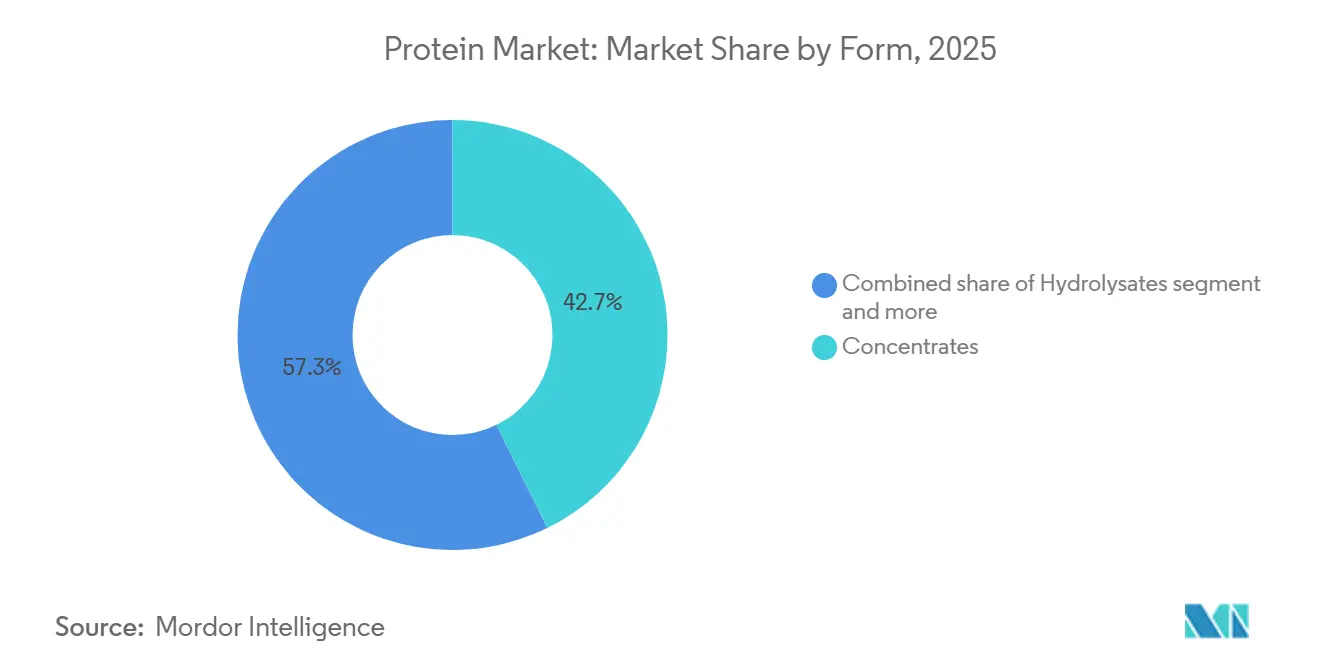
- By Form, concentrates captured a 42.74% share of the protein market size in 2025, whereas hydrolysates posted the fastest growth at a 7.93% CAGR through 2031.
- By Application, food and beverages accounted for 59.82% of 2025 revenue, while dietary supplements and sports nutrition are projected to record a 6.78% CAGR through 2031.
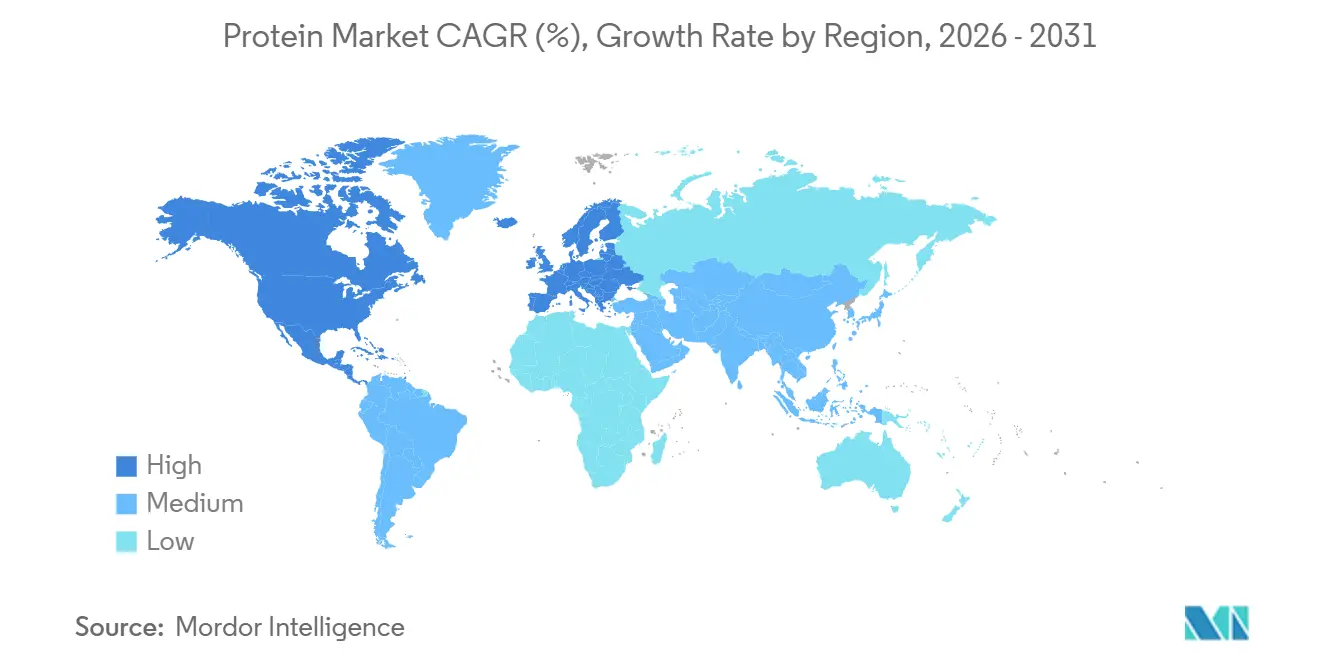
- By geography, North America held 35.43% of global revenue in 2025, with Asia-Pacific forecast to expand at a 7.56% CAGR to 2031.
Note: Market size and forecast figures in this report are generated using Mordor Intelligence’s proprietary estimation framework, updated with the latest available data and insights as of January 2026.
Global Protein Market Trends and Insights
Drivers Impact Analysis*
| Driver | (~) % Impact on CAGR Forecast | Geographic Relevance | Impact Timeline |
|---|---|---|---|
| Mainstream high-protein diets and sports nutrition adoption | +1.2% | Global, with concentration in North America, Europe, and urban Asia-Pacific | Medium term (2-4 years) |
| Rapid penetration of plant-based and alternative proteins in food and beverages | +1.5% | Global, led by North America and Europe, is accelerating in Asia-Pacific urban centers | Long term (≥ 4 years) |
| Protein fortification across functional foods and beverages | +0.8% | Global, with policy-driven gains in Asia-Pacific (China, India) and Latin America | Medium term (2-4 years) |
| Expansion of protein supplements and RTD formats | +0.7% | North America and Europe core, and spillover to the Asia-Pacific and the Middle East | Short term (≤ 2 years) |
| Precision fermentation scale-up for animal-free dairy proteins | +0.6% | North America and Europe have early adoption, and the Asia-Pacific regulatory lag | Long term (≥ 4 years) |
| Premium pet food and aquafeed demand for novel proteins | +0.5% | Global, with North America and Europe leading premium pet food, Asia-Pacific dominating aquafeed | Medium term (2-4 years) |
| Source: Mordor Intelligence | |||


Mainstream high-protein diets and sports nutrition adoption
Protein intake recommendations have moved from athletic circles to mainstream wellness. The International Society of Sports Nutrition's 2024 position endorses 1.6 to 2.2 grams per kilogram of body weight for active adults, driving demand for convenient protein formats, as noted by the Journal of the International Society of Sports Nutrition[1]Source: Lea Norton, “Position Stand: Protein and Exercise,” International Society of Sports Nutrition, issn.net. Cargill's 2025 Protein Profile survey shows 68% of global consumers seek high-protein claims on packaged foods, up from 54% in 2022. However, only 41% trust plant-based proteins to match amino-acid profiles, splitting demand between whey isolates for clinical use and pea blends for cost-sensitive categories. Direct-to-consumer protein powder subscriptions grew in 2024, bypassing retail and enabling brands to capture margins while personalizing leucine and creatine co-fortification. This shift pressures dairy cooperatives to launch e-commerce platforms or risk losing share to digital-first brands offering genetic testing and customized blends. Wearable fitness trackers estimating protein needs are sustaining demand for ready-to-drink formats, especially in the Asia-Pacific region, where smartphone penetration exceeds 80% but refrigerated retail infrastructure is limited.
Rapid penetration of plant-based and alternative proteins in food and beverages
In 2025, plant-based proteins took center stage, with pea isolates edging out soy in allergen-free formulations and potato proteins making waves in clean-label beverages. The Good Food Institute noted 127 new plant-based protein product launches in the first half of 2024. Notably, 62% of these products utilized pea-rice blends, mimicking whey’s branched-chain amino acid ratios. This approach not only approximates the desired amino acid profile but also diminishes the need for synthetic leucine fortification. Roquette's inauguration of a 120,000-metric-ton pea-protein facility in Manitoba in 2024 underscores a bullish stance on North America's pulse acreage. This move aims to meet rising demand while avoiding the price surges that unsettled soy markets in 2022. Yet, challenges persist: flavor masking is a hurdle. Kerry Group's TasteSense platform, which employs enzyme pre-treatment to mitigate off-notes in legume proteins, saw an 8 to 12% uptick in ingredient costs in 2025. This price increase has curtailed its adoption in budget-conscious bakery applications. Meanwhile, the European Union's Farm to Fork strategy is pushing member states to source 50% of school-meal protein from plant or alternative sources by 2027. This initiative not only guarantees a market for pea and faba-bean proteins but also highlights potential supply-chain challenges, given that European pulse yields trail behind North American standards.
Protein fortification across functional foods and beverages
In 2025, protein fortification made its way from the realm of sports nutrition to mainstream products. Global launches of protein-enriched items, including coffee, sparkling water, and breakfast cereals, surged as brands sought to capitalize on functional claims for added revenue. In late 2024, China's State Council mandated urban school districts to serve meals with a minimum of 20 grams of protein per serving. This directive is spurring domestic investments in soy-protein texturization and pea-protein isolation. Meanwhile, in 2024, India's National Sports Development Fund earmarked INR 500 crore to boost domestic pea-protein production. This move aims to curtail India's reliance on Canadian isolates, which constitute a hefty share of the nation's plant-protein supply. Beverage formulators are now gravitating towards hydrolyzed collagen peptides. This shift allows them to achieve protein fortification without the viscosity challenges posed by whey concentrates. As a result, global demand for collagen peptides surged by 22% in 2024. The trend towards clear, shelf-stable protein drinks necessitates isolates that boast over 95% solubility at pH 3.5. However, in 2024, only 18% of commercial plant proteins met this criterion, limiting formulation options and keeping prices high for acid-stable whey isolates.
Expansion of protein supplements and RTD formats
In 2025, ready-to-drink (RTD) protein beverages captured a prominent share of the sports-nutrition retail value, surpassing powder formats as convenience-seeking consumers favored single-serve packaging, according to the Beverage Marketing Corporation. Aseptic processing technologies extended shelf life to 12 months without refrigeration, enabling brands to penetrate convenience stores and vending machines. Kerry Group's 2024 launch of a microencapsulated whey-protein system addressed sedimentation issues in acidic RTD beverages, increasing protein loading from 15 grams to 25 grams per 330-milliliter serving, competing with powder reconstitution. However, RTD margins compressed as co-packers proliferated. Private-label RTD proteins, priced 35 to 40% lower than branded equivalents, claimed 19% of US supermarket sales in 2024, pushing brands to differentiate with functional add-ins like creatine monohydrate and beta-alanine. The Middle East's RTD protein market grew 47% in 2024, driven by Ramadan-timed launches of date-flavored whey beverages catering to cultural preferences and post-fasting protein demand.
Restraints Impact Analysis*
| Restraint | (~) % Impact on CAGR Forecast | Geographic Relevance | Impact Timeline |
|---|---|---|---|
| Allergenicity, clean-label, and GMO concerns in soy and legume proteins | -0.4% | Global, with heightened sensitivity in North America and Europe | Medium term (2-4 years) |
| Commodity price and supply volatility for dairy and soy inputs | -0.6% | Global, with an acute impact in Asia-Pacific and Latin America | Short term (≤ 2 years) |
| Flavor off-notes and processing challenges are driving higher costs | -0.3% | Global, particularly affecting plant-based formulations in food and beverages | Medium term (2-4 years) |
| Regulatory approvals are slowing insect and microbial protein adoption | -0.2% | North America and Asia-Pacific regulatory lag, Europe advancing | Long term (≥ 4 years) |
| Source: Mordor Intelligence | |||
Allergenicity, clean-label, and GMO concerns in soy and legume proteins
In 2025, food-service operators increasingly sought ingredients free from nuts, dairy, and soy, driving a 265% surge in the segment of multi-allergen-free formulations. However, the FDA's classification of soy protein as a major allergen limited its incorporation into these formulations[2]Source: U.S. Food and Drug Administration, “Major Food Allergens,” fda.gov. Advocacy groups championing clean-label initiatives raised concerns over hexane extraction, a method employed in 78% of commercial soy-protein isolates. They deemed it inconsistent with "natural" claims. In response, brands like Clif Bar pivoted to aqueous-extracted pea proteins, even with a 15 to 20% cost premium. The European Union, in 2024, tightened its GMO labeling thresholds. They reduced the permissible presence of genetically modified organisms in organic products from 0.9% to 0.5%. This move heightened supply-chain segregation demands and upped compliance costs for soy-protein importers by an estimated 8%[3]Source: European Commission, “Organic Regulation Update 2024,” europa.eu . Pea and faba-bean proteins, generally not deemed major allergens in many regions, made inroads into the infant formula and clinical nutrition markets. Yet, 2024 cross-reactivity studies unveiled IgE-binding epitopes in pea proteins, which could elicit reactions in 4 to 6% of individuals allergic to soy, muddying the allergen-free narrative. Ingredient suppliers are channeling investments into enzymatic hydrolysis, aiming to break down allergenic proteins to below 3 kilodaltons. This molecular-weight benchmark is known to diminish immunogenicity. However, this method inflates production costs by USD 1.20 to USD 1.80 per kilogram and may produce bitter peptides, necessitating further flavor masking.
Commodity price and supply volatility for dairy and soy inputs
In 2025, dairy protein prices fell 18% year-over-year, thanks to favorable weather boosting milk output in New Zealand and the European Union. However, the volatility index for whey-protein concentrate futures hit a 5-year peak, signaling trader jitters over Chinese import demand and the consolidation of the US dairy herd, as reported by the USDA National Agricultural Statistics Service and CME Group. Soybean prices jumped 22% in early 2024 due to droughts in Argentina's Pampas region. Yet, by year's end, they pulled back 14% as Brazil expanded its acreage. This price fluctuation led ingredient buyers to hedge 70% of their annual soy-protein volumes, a notable increase from 52% in 2023. Fonterra's 2024 annual report highlighted that volatility in input costs squeezed its protein-ingredients division's operating margins by 180 basis points. In response, the cooperative pivoted production towards higher-margin hydrolysates, moving away from commodity concentrates. Southeast Asian aquafeed producers, dependent on imported soy protein for 40% of their formulations, felt the pinch as the Thai baht's depreciation drove dollar-denominated soy costs up by 11% in 2024, per the Food and Agriculture Organization. To counter these challenges, producers are turning to strategies like forward contracting and vertical integration. A case in point: Cargill's 2024 move to acquire a 25% stake in a Ukrainian pea-processing facility, a strategic bid to secure a non-soy protein supply and lessen vulnerability to weather risks in South America.
*Our forecasts treat driver/restraint impacts as directional, not additive. The impact forecasts reflect baseline growth, mix effects, and variable interactions.
Segment Analysis
By Source: Plant Proteins Capture Volume as Fermentation Targets Margin
In 2025, FDA approvals for animal-free whey and casein via precision fermentation position microbial proteins to challenge dairy's 66.96% market share, though commercial-scale economics remain uncertain. Perfect Day's Singapore facility operates at 60% capacity due to customer hesitancy over a 22% price premium compared to traditional whey. Plant proteins, projected to grow at a 7.80% CAGR through 2031, are replacing soy in allergen-sensitive applications. Pea isolates account for a prominent share of plant-protein volume in 2025, while potato proteins gain traction in clean-label beverages for their lack of legume off-notes. Animal proteins, including whey, casein, collagen, gelatin, and egg, dominate clinical nutrition and sports recovery due to superior leucine content and digestibility scores above 95%, which plant blends replicate only with synthetic amino-acid fortification. Insect proteins, classified as animal sources, received European Food Safety Authority approvals for cricket and mealworm powders in 2024, but consumer acceptance in Western markets remains below 30%, limiting use to pet food and aquafeed.
Microbial proteins, algae, and mycoprotein hold a small share of the market in 2025 but attract significant investments. Corbion's AlgaPrime DHA, approved for Norwegian salmon feed in 2024, offers a non-marine omega-3 source to mitigate fishmeal supply shocks. Quorn's mycoprotein expansion into Asia faces delays as Japan and South Korea request additional Fusarium venenatum safety data. Hemp protein, legalized for food use in the European Union in 2024, is gaining popularity in organic bakery applications due to its 8-gram fiber content per 30-gram serving, which plant-based brands use to justify price premiums. Rice protein, previously limited to hypoallergenic infant formulas, is entering sports nutrition as enzymatic processes increase its leucine content from 8% to 12%, narrowing the gap with whey. Collagen peptides, derived from bovine and marine sources, grew 22% in 2024, driven by beauty-from-within trends emphasizing skin hydration. However, marine collagen's USD 18 to USD 25 per kilogram price premium restricts its adoption to premium cosmetics and functional beverages.


By Form: Hydrolysates Command Premiums Despite Bitterness Challenges
In 2025, concentrates held a 42.74% market share, driven by cost-conscious bakery and snack manufacturers prioritizing protein content over solubility. Margin pressures from private-label competition are pushing suppliers toward value-added isolates and hydrolysates. Hydrolysates, projected to grow at a 7.93% CAGR through 2031, offer rapid amino-acid absorption linked to accelerated muscle-protein synthesis, justifying price premiums of 40-60% over concentrates in sports-nutrition channels. In 2024, Arla Foods Ingredients launched Lacprodan HYDRO.Power, a controlled-hydrolysis whey protein with bitterness scores below sensory thresholds. Proprietary enzyme blends raised production costs by 18% but enabled formulation into clear, acidic beverages, previously dominated by isolates. Isolates, contributing a notable share of form-based revenue in 2025, are used in applications requiring over 90% protein purity, like ready-to-drink shakes and infant formula, though membrane-filtration costs add USD 1.80-2.40 per kilogram compared to spray-dried concentrates.
In infant nutrition, partially hydrolyzed formulas reduce allergenicity risk and improve gastric emptying rates, driving volume growth in 2024 despite regulatory scrutiny over hydrolysis-degree labeling inconsistencies. Collagen hydrolysates, marketed for joint health and skin elasticity, captured 11% of hydrolysate revenue in 2024, though efficacy claims remain debated. A 2024 meta-analysis in the Journal of Cosmetic Dermatology found significant skin hydration improvements only at daily doses above 10 grams, a threshold most functional beverages undershoot to control costs. Plant-protein hydrolysates face challenges, as enzymatic cleavage of pea proteins generates bitter peptides if not tightly controlled, limiting adoption to savory applications where umami flavors mask bitterness. Concentrates dominate animal feed, where cost per unit of nitrogen outweighs protein digestibility, but aquafeed formulators are shifting to insect-protein concentrates, which provide chitin co-benefits for shrimp exoskeleton development.
By Application: Dietary Supplements Outpace Food as Direct-to-Consumer Channels Scale
In 2025, food and beverages accounted for 59.82% of application revenue. Dietary supplements and sports nutrition are projected to grow at a 6.78% CAGR through 2031, driven by direct-to-consumer subscription models enabling personalized protein, creatine, and collagen blends. In 2024, protein fortification entered mainstream categories, with protein-enriched coffee, sparkling water, and breakfast cereals rising 29%. Formulation constraints limit protein loading to 5 to 8 grams per serving in shelf-stable beverages. Dairy and dairy-alternative products absorbed 22% of food-and-beverage protein volume in 2024, driven by Greek yogurt's popularity and oat-milk brands fortifying with pea protein to match dairy's 8-gram-per-cup benchmark. Meat and meat-alternative products, reliant on soy and pea proteins for texture and binding, saw volume declines in 2024 as interest in plant-based burgers plateaued and price premiums over ground beef widened to 35%.
In 2025, animal feed captured a significant share of application revenue, with aquafeed formulators replacing 12% of fishmeal with insect and algae proteins to stabilize supply chains amid declining anchovy catches off Peru's coast, according to the Food and Agriculture Organization. Personal care and cosmetics, a niche segment of the market, are growing as collagen peptides and silk proteins gain traction in anti-aging serums and hair-repair treatments, though efficacy claims face regulatory scrutiny. Infant nutrition, governed by Codex Alimentarius standards, specifies whey-casein ratios and amino-acid profiles that limit formulation flexibility, yet partially hydrolyzed proteins are penetrating hypoallergenic segments where conventional dairy proteins trigger adverse reactions. Ready-to-eat and ready-to-cook meals incorporated 14% more protein in 2024 versus 2023, reflecting demand for satiety and convenience, though sodium levels needed to mask plant-protein off-notes conflict with clean-label positioning. Snacks, particularly protein bars and chips, absorbed 9% of food-protein volume in 2024, but texture challenges like crispness loss and chewiness limit protein loading to 12 to 15 grams per serving.
Geography Analysis
In 2025, North America accounted for 35.43% of global protein revenue, supported by a strong whey-protein infrastructure and FDA regulations that expedite novel ingredient approvals. However, growth is slowing due to sports-nutrition saturation and private-label RTD proteins reducing branded margins. The U.S. contributed a majority share of regional revenue, driven by a 34% rise in direct-to-consumer protein-powder subscriptions in 2024 and increased clinical-nutrition demand from an aging population. Canada expanded pea-protein processing capacity by 18% in 2024 with Roquette's 120,000-metric-ton facility in Manitoba, positioning it to supply 40% of North American plant-protein isolates by 2027. Mexico's market is split, with urban areas adopting whey-based sports nutrition and rural areas relying on soy-fortified tortillas under government mandates requiring 12 grams of protein per 100 grams of masa. In the U.S., precision fermentation, led by Perfect Day's FDA GRAS-affirmed animal-free whey, is gaining traction, though a 22% cost premium limits adoption to premium brands.
Asia-Pacific is projected to grow at a 7.56% CAGR through 2031, driven by China's protein fortification in school meals and India's subsidies for domestic pea-protein capacity. China led regional revenue in 2024, with middle-class households adopting high-protein diets and Tmall reporting 41% growth in imported whey-protein sales. India's sports-nutrition market grew in 2024, supported by government fitness initiatives and domestic whey-pea blends priced 25% below imports. Southeast Asia's aquafeed sector replaced 12% of fishmeal with insect proteins in 2024 to counter El Niño-driven anchovy shortages, according to the FAO. Japan and South Korea faced regulatory delays for novel proteins, extending approval timelines beyond 12 months in 2024. Australia and New Zealand, exporting 68% of their dairy-protein production, are investing in precision fermentation to mitigate climate-related milk-supply risks, with startups securing government grants in 2024.
Europe's plant-based protein adoption accelerated after the European Food Safety Authority approved cricket powder for human consumption in 2024, enabling insect-protein snacks and pasta, though consumer acceptance remains below 30%. Germany and the UK, leading regional revenue, focus on pea and faba-bean proteins to meet the EU's Farm to Fork mandate requiring 50% of school-meal protein from plant or alternative sources by 2027. France's Ynsect, producing 15,000 metric tons of mealworm protein annually, secured supply deals with Nestlé Purina and Mars Petcare in 2024, covering a notable share of Europe's premium dog food protein supply. Spain and Italy are expanding collagen-peptide production for beauty applications, with marine collagen priced at USD 18–25 per kilogram. Poland and the Netherlands are emerging as pea-protein hubs due to proximity to pulse-growing regions and lower labor costs. In South America, Brazil's soy-protein exports compete with local dairy cooperatives, while Argentina's 2024 drought reduced soybean output by 22%, tightening supply and raising prices. The Middle East and Africa remain import-dependent, with Gulf Cooperation Council nations sourcing whey isolates for clinical nutrition and South Africa's aquaculture sector adopting insect proteins to reduce reliance on imported fishmeal.

Competitive Landscape
The global protein market exhibits moderate concentration, with the top major players such as Archer-Daniels-Midland, Cargill, Glanbia, Kerry Group, and Fonterra commanding a major share of revenue in 2025. However, the market remains fragmented, especially in specialty segments where precision-fermentation startups and regional pea-protein processors compete through innovation rather than scale. Vertical integration is a key strategy for incumbents. For example, Cargill's 2024 acquisition of a 25% stake in a Ukrainian pea-processing facility secures a non-soy protein supply and mitigates risks tied to South American weather. Similarly, Archer-Daniels-Midland is expanding its soy-protein texturization capacity in Illinois to strengthen its position in meat-alternative applications. Glanbia and Kerry are capitalizing on proprietary hydrolysis patents to capture sports-nutrition premiums. Glanbia's 2024 launch of a leucine-enriched hydrolysate, which offers a 40% faster absorption rate than standard whey, is a notable development validated by third-party clinical trials. Meanwhile, precision-fermentation platforms like Perfect Day, The EVERY Company, and Imagindairy raised over USD 700 million in 2024 but face margin pressures due to an 18% year-over-year decline in dairy prices, narrowing the cost gap between recombinant and conventional proteins.
Emerging opportunities are concentrated in allergen-free, clean-label, and climate-resilient proteins. Potato protein, which avoids major allergen classifications and delivers a neutral flavor, is gaining traction in beverages, where pea proteins often introduce off-notes. However, global processing capacity for potato protein remains 40% below demand. Insect-protein suppliers such as Ynsect and Protix are pivoting from human food to pet food and aquafeed, where regulatory barriers are lower, and sustainability claims align with premium-brand positioning. To hedge against commodity volatility, ingredient suppliers are acquiring microbial-protein platforms. For instance, DSM-Firmenich's 2025 minority-stake acquisition in a mycoprotein producer diversifies its portfolio beyond dairy-derived solutions and positions the company for regulatory approvals in Asia-Pacific markets.
Technology adoption in the protein market is focused on flavor masking, solubility enhancement, and cost reduction. Kerry Group's TasteSense platform, which combines enzyme inactivation with natural flavor encapsulation, was licensed to 14 food manufacturers in 2024. This licensing generated recurring royalty revenue, offsetting research and development costs. Smaller players like PURIS and Axiom Foods are disrupting the market by securing long-term supply agreements with major food brands. These companies leverage non-GMO and organic certifications, which command premium prices in North American and European markets, challenging the dominance of larger incumbents.
Protein Industry Leaders
Archer Daniels Midland Company
Fonterra Co-operative Group Limited
International Flavors & Fragrances Inc.
Kerry Group PLC
Royal FrieslandCampina N.V
- *Disclaimer: Major Players sorted in no particular order

Recent Industry Developments
- January 2025: DSM-Firmenich acquired a minority stake in a European mycoprotein producer for an undisclosed sum, diversifying its protein portfolio beyond dairy-derived ingredients and positioning the company to capitalize on regulatory approvals for Fusarium venenatum-based proteins in Asia-Pacific markets. The transaction includes technology-sharing agreements that grant DSM-Firmenich access to proprietary fermentation processes optimized for low-cost glucose feedstocks.
- December 2024: Roquette commissioned a 120,000-metric-ton pea-protein processing facility in Manitoba, Canada, representing an investment exceeding USD 400 million and positioning the company to supply 40 percent of North American plant-protein isolates by 2027. The facility incorporates air-classification technology that reduces off-notes and delivers neutral-flavor isolates suitable for clear beverages.
- November 2024: Arla Foods Ingredients launched Lacprodan HYDRO. Power, a controlled-hydrolysis whey protein with bitterness scores below sensory thresholds, enabling formulation into clear, acidic beverages. The product required proprietary enzyme blends that increased production costs by 18% but unlocked premium pricing in sports-nutrition channels.


Global Protein Market Report Scope
Proteins refer to substances derived from natural sources (animal, plant, or microbial) that have been isolated or concentrated through processing to be used as additives in other products. The protein market is segmented by source, form, application, and geography. By source, the market is segmented into animal, microbial, and plant. Animal sources are further segmented into Casein and Caseinates, Collagen, Egg Protein, Gelatin, Insect Protein, Milk Protein, Whey Protein, and Other Animal Proteins. Microbial sources are further segmented into Algae Protein and Mycoprotein. Similarly, plant sources are segmented into Hemp Protein, Pea Protein, Potato Protein, Rice Protein, Soy Protein, Wheat Protein, and Other Plant Proteins. By form, the market is segmented into Concentrates, Isolates, Hydrolysates, and Other Forms. By application, the market is segmented into Food and Beverages, Personal Care and Cosmetics, Animal Feed, Dietary Supplements, and Sports Nutrition. The Food and Beverages segment is further segmented into Bakery, Beverages, Breakfast Cereals, Condiments/Sauces, Confectionery, Dairy and Dairy Alternative Products, Meat/Poultry/Seafood and Meat Alternative Products, RTE/RTC Food Products, Snacks, Infant Nutrition, and Other Food and Beverage Applications. By geography, the market is segmented into North America, Europe, Asia-Pacific, South America, and the Middle East and Africa. The Market Forecasts are Provided in Terms of Value (USD) and Volume (Tons).
Source
| Animal | Casein and Caseinates |
| Collagen | |
| Egg Protein | |
| Gelatin | |
| Insect Protein | |
| Milk Protein | |
| Whey Protein | |
| Other Animal Proteins | |
| Microbial | Algae Protein |
| Mycoprotein | |
| Plant | Hemp Protein |
| Pea Protein | |
| Potato Protein | |
| Rice Protein | |
| Soy Protein | |
| Wheat Protein | |
| Other Plant Proteins |
Form
| Concentrates |
| Isolates |
| Hydrolysates |
| Other Forms |
Application
| Food and Beverages | Bakery |
| Beverages | |
| Breakfast Cereals | |
| Condiments/Sauces | |
| Confectionery | |
| Dairy and Dairy Alternative Products | |
| Meat/Poultry/Seafood and Meat Alternative Products | |
| RTE/RTC Food Products | |
| Snacks | |
| Infant Nutrition | |
| Other Food and Beverage Applications | |
| Personal Care and Cosmetics | |
| Animal Feed | |
| Dietary Supplements and Sports Nutrition |
Geography
| North America | United States |
| Canada | |
| Mexico | |
| Rest of North America | |
| Europe | United Kingdom |
| Germany | |
| France | |
| Italy | |
| Spain | |
| Sweden | |
| Belgium | |
| Poland | |
| Netherlands | |
| Rest of Europe | |
| Asia-Pacific | China |
| Japan | |
| India | |
| Thailand | |
| Singapore | |
| Indonesia | |
| South Korea | |
| Australia | |
| New Zealand | |
| Rest of Asia-Pacific | |
| South America | Brazil |
| Argentina | |
| Peru | |
| Colombia | |
| Chile | |
| Rest of South America | |
| Middle East and Africa | South Africa |
| Nigeria | |
| Egypt | |
| Morocco | |
| Turkey | |
| Rest of Middle East and Africa |
| Source | Animal | Casein and Caseinates |
| Collagen | ||
| Egg Protein | ||
| Gelatin | ||
| Insect Protein | ||
| Milk Protein | ||
| Whey Protein | ||
| Other Animal Proteins | ||
| Microbial | Algae Protein | |
| Mycoprotein | ||
| Plant | Hemp Protein | |
| Pea Protein | ||
| Potato Protein | ||
| Rice Protein | ||
| Soy Protein | ||
| Wheat Protein | ||
| Other Plant Proteins | ||
| Form | Concentrates | |
| Isolates | ||
| Hydrolysates | ||
| Other Forms | ||
| Application | Food and Beverages | Bakery |
| Beverages | ||
| Breakfast Cereals | ||
| Condiments/Sauces | ||
| Confectionery | ||
| Dairy and Dairy Alternative Products | ||
| Meat/Poultry/Seafood and Meat Alternative Products | ||
| RTE/RTC Food Products | ||
| Snacks | ||
| Infant Nutrition | ||
| Other Food and Beverage Applications | ||
| Personal Care and Cosmetics | ||
| Animal Feed | ||
| Dietary Supplements and Sports Nutrition | ||
| Geography | North America | United States |
| Canada | ||
| Mexico | ||
| Rest of North America | ||
| Europe | United Kingdom | |
| Germany | ||
| France | ||
| Italy | ||
| Spain | ||
| Sweden | ||
| Belgium | ||
| Poland | ||
| Netherlands | ||
| Rest of Europe | ||
| Asia-Pacific | China | |
| Japan | ||
| India | ||
| Thailand | ||
| Singapore | ||
| Indonesia | ||
| South Korea | ||
| Australia | ||
| New Zealand | ||
| Rest of Asia-Pacific | ||
| South America | Brazil | |
| Argentina | ||
| Peru | ||
| Colombia | ||
| Chile | ||
| Rest of South America | ||
| Middle East and Africa | South Africa | |
| Nigeria | ||
| Egypt | ||
| Morocco | ||
| Turkey | ||
| Rest of Middle East and Africa | ||


Market Definition
- End User - The Protein Ingredients Market operates on a B2B basis. Food, Beverages, Supplements, Animal Feed, and Personal Care & Cosmetic manufacturers are considered to be end-consumers in the market studied. The scope excludes manufacturers buying liquid/dry whey to be used for application as a binding agent or thickener or other non-protein applications.
- Penetration Rate - Penetration Rate is defined as the percentage of Protein-Fortified End User Market Volume in the Overall End User Market Volume.
- Average Protein Content - Average protein content is the average protein content present per 100 g of product manufactured by all end-user companies considered under the scope of this report.
- End User Market Volume - End-user market volume is the consolidated volume of all types and forms of end-user products in the country or region.
| Keyword | Definition |
|---|---|
| Alpha-lactalbumin (α-Lactalbumin) | It is a protein that regulates the production of lactose in the milk of almost all mammalian species. |
| Amino acid | It is an organic compound that contains both amino and carboxylic acid functional groups, which are required for the synthesis of body protein and other important nitrogen-containing compounds, such as creatine, peptide hormones, and some neurotransmitters. |
| Blanching | It is the process of briefly heating vegetables with steam or boiling water. |
| BRC | British Retail Consortium |
| Bread improver | It is a flour-based blend of several components with specific functional properties designed to modify dough characteristics and give quality attributes to bread. |
| BSF | Black Soldier Fly |
| Caseinate | It is a substance produced by adding an alkali to acid casein, a derivative of casein. |
| Celiac disease | Celiac disease is an immune reaction to eating gluten, a protein found in wheat, barley, and rye. |
| Colostrum | It is a milky fluid that’s released by mammals that have recently given birth before breast milk production begins. |
| Concentrate | It is the least processed form of protein and has a protein content ranging from 40-90% by weight. |
| Dry protein basis | It refers to the percentage of "pure protein" present in a supplement after the water in it is completely removed through heat. |
| Dry whey | It is the product resulting from drying fresh whey which has been pasteurized and to which nothing has been added as a preservative. |
| Egg protein | It is a mixture of individual proteins, including ovalbumin, ovomucoid, ovoglobulin, conalbumin, vitellin, and vitellenin. |
| Emulsifier | It is a food additive that facilitates the blending of foods that are immiscible with one another, such as oil and water. |
| Enrichment | It is the process of addition of micronutrients that are lost during the processing of the product. |
| ERS | Economic Research Service of the USDA |
| Extrusion | It is the process of forcing soft mixed ingredients through an opening in a perforated plate or die designed to produce the required shape. The extruded food is then cut to a specific size by blades. |
| Fava | Also known as Faba, it is another word for yellow split beans. |
| FDA | Food and Drug Administration |
| Flaking | It is a process in which typically a cereal grain (like corn, wheat, or rice) is broken down into grits, cooked with flavors and syrups, and then pressed into flakes between cooled rollers. |
| Foaming agent | It is a food ingredient that makes it possible to form or maintain a uniform dispersion of a gaseous phase in a liquid or solid food. |
| Foodservice | It refers to the part of the food industry which includes businesses, institutions, and companies which prepare meals outside the home. It includes restaurants, school and hospital cafeterias, catering operations, and many other formats. |
| Fortification | It is the deliberate addition of micronutrients that are not found in them naturally or which are lost during processing, to improve a food product's nutritional value. |
| FSANZ | Food Standards Australia New Zealand |
| FSIS | Food Safety and Inspection Service |
| FSSAI | Food Safety and Standards Authority of India |
| Gelling agent | It is an ingredient that functions as a stabilizer and thickener to provide thickening without stiffness through the formation of gel. |
| GHG | Greenhouse Gas |
| Gluten | It is a family of proteins found in grains, including wheat, rye, spelt, and barley. |
| Hemp | It is a botanical class of Cannabis sativa cultivars grown specifically for industrial or medicinal use. |
| Hydrolysate | It is a form of protein manufactured by exposing the protein to enzymes that can partially break the bonds between the protein's amino acids and break down large, complicated proteins into smaller pieces. Its processing makes it easier and quicker to digest. |
| Hypoallergenic | It refers to a substance that causes fewer allergic reactions. |
| Isolate | It is the purest and most processed form of protein which has undergone separation to obtain a pure protein fraction. It typically contains ≥ 90% of protein by weight. |
| Keratin | It is a protein that helps form hair, nails, and the outer layer of skin. |
| Lactalbumin | It is the albumin contained in milk and obtained from whey. |
| Lactoferrin | It is an iron‑binding glycoprotein that is present in the milk of most mammals. |
| Lupin | It is the yellow legume seeds of the genus Lupinus. |
| Millenial | Also known as Generation Y or Gen Y, it refers to the people born from 1981 to 1996. |
| Monogastric | It refers to an animal with a single-compartmented stomach. Examples of monogastric include humans, poultry, pigs, horses, rabbits, dogs, and cats. Most monogastric are generally unable to digest much cellulose food materials such as grasses. |
| MPC | Milk protein concentrate |
| MPI | Milk protein isolate |
| MSPI | Methylated soy protein isolate |
| Mycoprotein | Mycoprotein is a form of single-cell protein, also known as fungal protein, derived from fungi for human consumption. |
| Nutricosmetics | It is a category of products and ingredients that act as nutritional supplements to care for skin, nails, and hair natural beauty. |
| Osteoporosis | It is a medical condition in which the bones become brittle and fragile from loss of tissue, typically as a result of hormonal changes, or deficiency of calcium or vitamin D. |
| PDCAAS | Protein digestibility-corrected amino acid score (PDCAAS) is a method of evaluating the quality of a protein based on both the amino acid requirements of humans and their ability to digest it. |
| Per-capita consumption of animal protein | It is the average amount of animal protein (such as milk, whey, gelatin, collagen, and egg proteins) that is readily available for consumption by each person in an actual population. |
| Per-capita consumption of plant protein | It is the average amount of plant protein (such as soy, wheat, pea, oat, and hemp proteins) that is readily available for consumption by each person in an actual population. |
| Quorn | It is a microbial protein manufactured using mycoprotein as an ingredient, in which the fungus culture is dried and mixed with egg albumen or potato protein, which acts as a binder, and then is adjusted in texture and pressed into various forms. |
| Ready-to-Cook (RTC) | It refers to food products that include all of the ingredients, where some preparation or cooking is required through a process that is given on the package. |
| Ready-to-Eat (RTE) | It refers to a food product prepared or cooked in advance, with no further cooking or preparation required before being eaten. |
| RTD | Ready-to-Drink |
| RTS | Ready-to-Serve |
| Saturated fat | It is a type of fat in which the fatty acid chains have all single bonds. It is generally considered unhealthy. |
| Sausage | It is a meat product made of finely chopped and seasoned meat, which may be fresh, smoked, or pickled and which is then usually stuffed into a casing. |
| Seitan | It is a plant-based meat substitute made out of wheat gluten. |
| Softgel | It is a gelatin-based capsule with a liquid fill. |
| SPC | Soy protein concentrate |
| SPI | Soy protein isolate |
| Spirulina | It is a biomass of cyanobacteria that can be consumed by humans and animals. |
| Stabilizer | It is an ingredient added to food products to help maintain or enhance their original texture, and physical and chemical characteristics. |
| Supplementation | It is the consumption or provision of concentrated sources of nutrients or other substances that are intended to supplement nutrients in the diet and is intended to correct nutritional deficiencies. |
| Texturant | It is a specific type of food ingredient that is used to control and alter the mouthfeel and texture of food and beverage products. |
| Thickener | It is an ingredient that is used to increase the viscosity of a liquid or dough and make it thicker, without substantially changing its other properties. |
| Trans fat | Also called trans-unsaturated fatty acids or trans fatty acids, it is a type of unsaturated fat that naturally occurs in small amounts in meat. |
| TSP | Textured soy protein |
| TVP | Textured vegetable protein |
| WPC | Whey protein concentrate |
| WPI | Whey protein isolate |


Research Methodology
Mordor Intelligence follows a four-step methodology in all our reports.
- Step-1: Identify Key Variables: The quantifiable key variables (industry and extraneous) pertaining to the specific product segment and country are selected from a group of relevant variables & factors based on desk research & literature review; along with primary expert inputs. These variables are further confirmed through regression modeling (wherever required).
- Step-2: Build a Market Model: In order to build a robust forecasting methodology, the variables and factors identified in Step-1 are tested against available historical market numbers. Through an iterative process, the variables required for market forecast are set and the model is built on the basis of these variables.
- Step-3: Validate and Finalize: In this important step, all market numbers, variables and analyst calls are validated through an extensive network of primary research experts from the market studied. The respondents are selected across levels and functions to generate a holistic picture of the market studied.
- Step-4: Research Outputs: Syndicated Reports, Custom Consulting Assignments, Databases & Subscription Platforms


