Market Overview
| Study Period | 2021 - 2031 |
|---|---|
| Forecast Data Period | 2026 - 2031 |
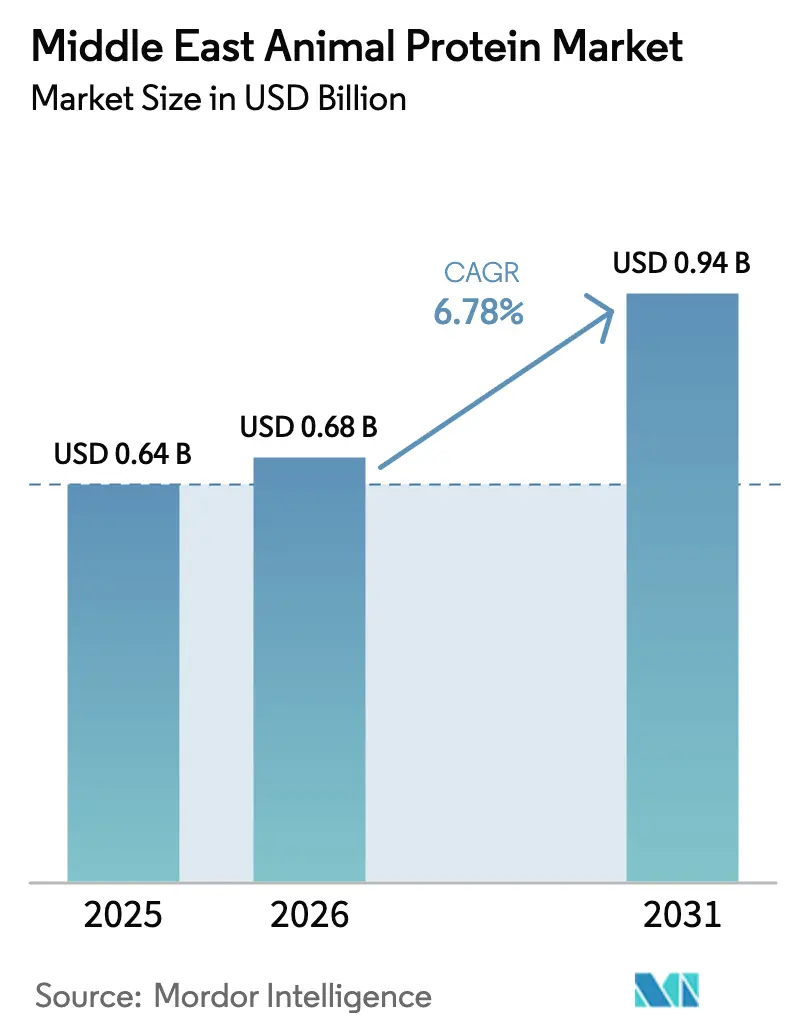
| Base Year Market Size (2025) | USD 0.64 Billion |
| Market Size (2026) | USD 0.68 Billion |
| Market Size (2031) | USD 0.94 Billion |
| Growth Rate (2026 - 2031) | 6.78% CAGR |
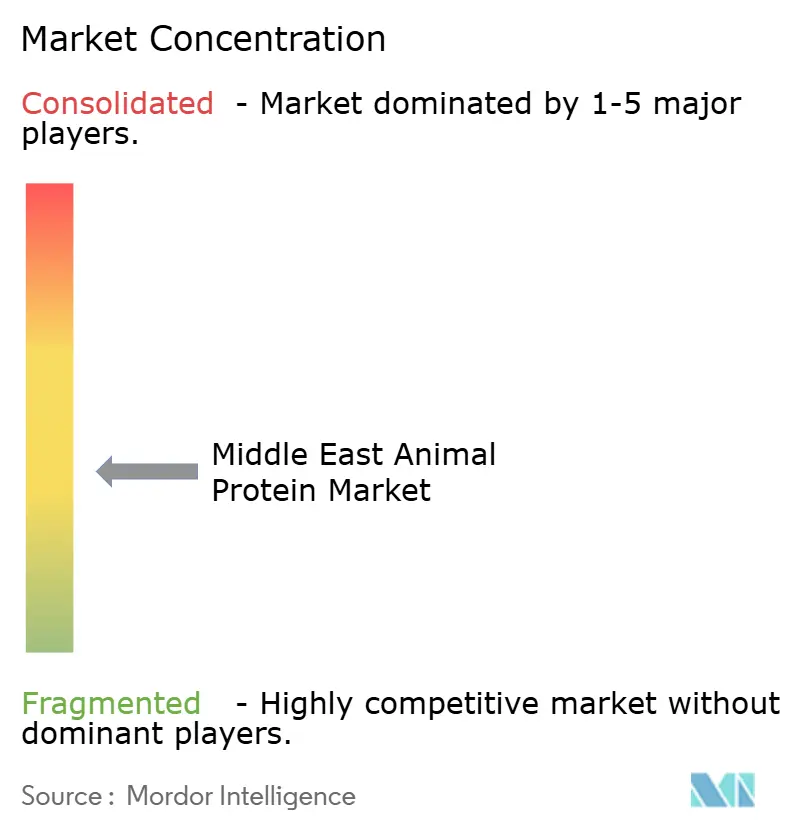
| Market Concentration | Medium |
Major Players*Disclaimer: Major Players sorted in no particular order Image © Mordor Intelligence. Reuse requires attribution under CC BY 4.0. |
|
Middle East Animal Protein Market Analysis by Mordor Intelligence
The Middle East animal protein market size was valued at USD 0.64 billion in 2025 and is estimated to grow from USD 0.68 billion in 2026 to reach USD 0.94 billion by 2031, at a CAGR of 6.78% during the forecast period (2026-2031). Robust population growth, a young demographic profile, and government-backed food-security programs are propelling demand for dairy, poultry, collagen, and specialty ingredients across retail, foodservice, and manufacturing channels. Cold-chain modernization at major ports such as Jebel Ali and Jeddah shortens transit times for imported whey and gelatin, enabling just-in-time replenishment and dampening spoilage risk. Halal certification tightening by the Saudi Food and Drug Authority (SFDA) and the Emirates Authority for Standardization and Metrology (ESMA) pushes suppliers to invest in traceability technologies that raise compliance costs but create premium-pricing opportunities. Subsidy programs worth SAR 1.2 billion in Saudi Arabia and comparable grants in the UAE accelerate livestock automation, feed-mill construction, and biosecurity upgrades that collectively expand domestic output[1]Source: Ministry of Environment, Water and Agriculture, "Subsidies", mewa.gov.sa . Rising consumer preference for high-protein, on-the-go foods, combined with sustained fitness and wellness campaigns under Saudi Vision 2030, provides additional tailwinds for ready-to-drink shakes, protein-enriched cereals, and halal collagen serums.
Key Report Takeaways
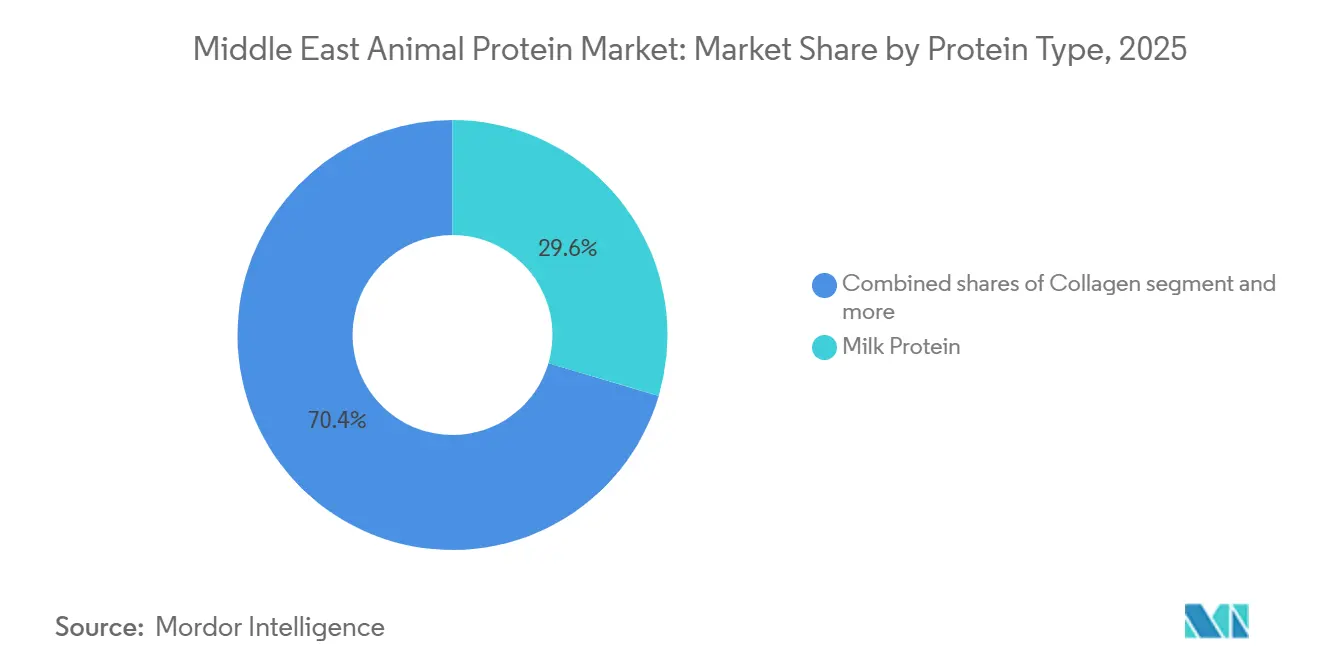
- By protein type, milk protein led the animal protein market with 29.57% share in 2025 and is forecast to expand at a 6.88% CAGR through 2031.
- By category, conventional formulations dominated with 88.03% of 2025 revenue, whereas organic variants are projected to register a 7.36% CAGR to 2031.
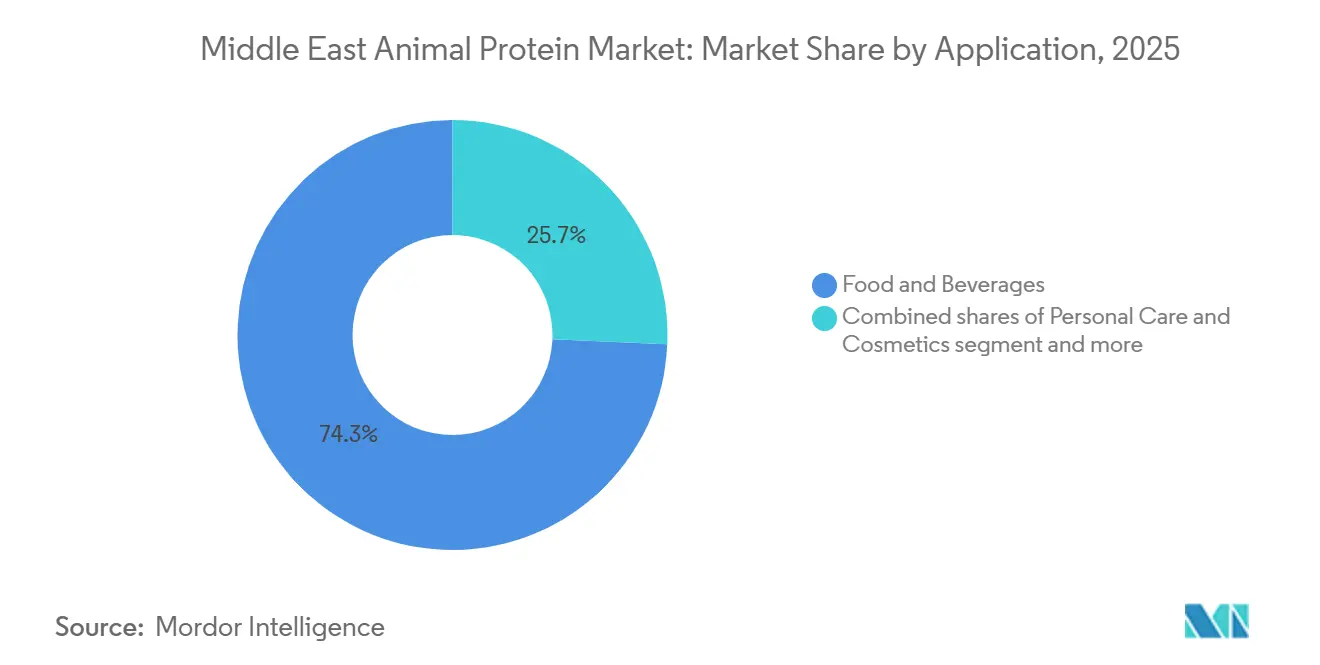
- By application, food and beverages accounted for 74.32% of 2025 demand, while personal care and cosmetics are advancing at a 7.28% CAGR through 2031.
- By geography, Saudi Arabia captured 62.65% of the 2025 animal protein market share, whereas Iran is poised for the fastest expansion at an 8.33% CAGR over the forecast horizon.
Note: Market size and forecast figures in this report are generated using Mordor Intelligence’s proprietary estimation framework, updated with the latest available data and insights as of January 2026.
Middle East Animal Protein Market Trends and Insights
Drivers Impact Analysis*
| Driver | (~) % Impact on CAGR Forecast | Geographic Relevance | Impact Timeline |
|---|---|---|---|
| Rising consumer preference for high-protein diets | +1.2% | Saudi Arabia, UAE (United Arab Emirates), with spillover to Kuwait and Bahrain | Medium term (2-4 years) |
| Increasing halal-certified meat consumption demand | +1.5% | Global, strongest in Saudi Arabia, the UAE, and the rest of the Middle East | Long term (≥ 4 years) |
| Advances in cold chain and storage technology | +0.9% | UAE (Jebel Ali, Dubai), Saudi Arabia (Riyadh, Jeddah), Oman | Short term (≤ 2 years) |
| Government initiatives supporting livestock modernization | +1.1% | Saudi Arabia, UAE, Iran | Medium term (2-4 years) |
| Growing popularity of ready-to-eat and convenience foods | +0.8% | UAE, Saudi Arabia, Qatar | Short term (≤ 2 years) |
| Expansion of domestic livestock production capacity | +1.0% | Saudi Arabia, Iran, with early gains in Al-Qassim, Riyadh, Tehran | Long term (≥ 4 years) |
| Source: Mordor Intelligence | |||
Rising Consumer Preference for High-Protein Diets
Fitness-center memberships in Saudi Arabia surged 27% between 2024 and 2025, according to the General Authority for Statistics, fuelling demand for whey isolates, casein micelles, and egg-white powders in ready-to-drink shakes and protein bars[2]Source: GASTAT (Goods and Services Tax Appellate Tribunal), "Fitness-center memberships", stats.gov.sa. Urban millennials in Dubai and Riyadh are shifting breakfast routines toward high-protein yogurt fortified with milk-protein concentrates, a trend that lifted per-capita dairy-protein consumption from 2024 to 2025[3]Source: UAE Ministry of Economy, "Per-Capita Dairy-Protein Consumption", moet.gov.ae. Sports-nutrition brands are launching halal-certified whey blends that comply with World Anti-Doping Agency standards, capturing market share from imported European products that lack Islamic certification. This dietary pivot is most pronounced among expatriate professionals and young Saudi nationals who view protein intake as a health metric rather than merely a macronutrient. The trend is expected to persist through 2029, as government wellness campaigns under Saudi Vision 2030 promote active lifestyles and reduce obesity.
Advances in Cold Chain and Storage Technology
Saudi Arabia's RSA cold chain invested SAR 300 million in 2025 to retrofit 12 distribution hubs with Internet-of-Things sensors that monitor temperature fluctuations in real time, reducing spoilage rates significantly between 2024 and 2025. These infrastructure upgrades enable just-in-time delivery of temperature-sensitive proteins to bakeries and beverage lines, reducing working-capital requirements and improving product consistency. The UAE's Ministry of Climate Change and Environment mandated in April 2025 that all imported animal-protein ingredients pass through approved cold-chain corridors, effectively barring shipments that lack continuous temperature logs. Cold-chain investments are concentrated in port cities, Jebel Ali, Jeddah, and Salalah, where proximity to import terminals minimizes the risk of thermal breaks during last-mile distribution.
Government Initiatives Supporting Livestock Modernization
Iran's Ministry of Agriculture launched a livestock-breeding program in 2024 that distributed 50,000 high-yield dairy heifers to smallholder farms, lifting domestic milk-protein output in 2025 and reducing reliance on imported caseinates. The UAE's Abu Dhabi Agriculture and Food Safety Authority allocated AED 150 million in 2025 grants to vertical farms experimenting with insect-protein production, aiming to diversify feed sources for aquaculture and poultry. These public investments are designed to enhance food security; Saudi Vision 2030 targets 60% self-sufficiency in poultry by 2030, up from 48% in 2025, by incentivizing private-sector partnerships that co-locate feed mills and slaughter facilities. Government support is most effective in Saudi Arabia and the UAE, where fiscal capacity allows sustained capital outlays, whereas smaller Gulf states such as Bahrain and Oman rely on joint ventures with foreign agribusinesses to modernize livestock operations.
Growing Popularity of Ready-to-Eat and Convenience Foods
Ready-to-eat meal sales in the UAE grew in 2025, driven by dual-income households and expatriate workers who prioritize convenience over traditional home cooking, according to the UAE Ministry of Economy. Protein-enriched breakfast cereals fortified with milk-protein isolates and egg albumin captured a marginal portion of the Saudi cereal market in 2025, up from 2024, as parents seek nutrient-dense options for school-age children. Retailers such as Carrefour and Lulu Hypermarket expanded chilled ready-to-eat sections in Q3 2025, stocking halal-certified chicken wraps, protein bowls, and dairy-based desserts that incorporate caseinates for texture and shelf stability. The shift toward convenience foods is most pronounced in urban centers, such as Dubai, Riyadh, and Doha, where long commutes and high workforce-participation rates reduce time available for meal preparation. This trend favors animal-protein ingredients that deliver clean-label appeal, extended shelf life, and halal compliance, positioning whey, casein, and egg proteins as preferred formulation bases for manufacturers targeting time-pressed consumers.
Restraints Impact Analysis*
| Restraint | (~) % Impact on CAGR Forecast | Geographic Relevance | Impact Timeline |
|---|---|---|---|
| Stringent government regulations on meat processing | -0.7% | Saudi Arabia, UAE, with spillover to Kuwait and Bahrain | Medium term (2-4 years) |
| Animal disease outbreaks affecting the livestock supply | -0.9% | Iraq, Saudi Arabia (Eastern Province), Iran | Short term (≤ 2 years) |
| Limited availability of arable land for livestock | -0.6% | Saudi Arabia, UAE, Qatar | Long term (≥ 4 years) |
| Cultural dietary restrictions limit certain meat types | -0.5% | Global, strongest in Saudi Arabia, the UAE, and the rest of the Middle East | Long term (≥ 4 years) |
| Source: Mordor Intelligence | |||
Stringent Government Regulations on Meat Processing
Saudi Arabia's Food and Drug Authority revised slaughter-facility standards in January 2025, mandating real-time video monitoring of halal compliance and third-party audits every 90 days; 14 domestic processors failed initial inspections and faced temporary shutdowns, tightening egg-protein and poultry-meat supply in Q1 2025. The UAE's Emirates Authority for Standardization and Metrology introduced blockchain traceability for imported animal proteins in Q2 2025, requiring suppliers to upload slaughter certificates, veterinary health records, and halal-certification documents before customs clearance; shipments lacking complete documentation incurred 21-day delays at Jebel Ali port, disrupting just-in-time supply chains for bakeries and beverage manufacturers. These regulatory measures enhance food safety and consumer trust, yet they also raise barriers to entry and slow the pace of new-product launches, particularly for niche segments such as insect protein and collagen peptides that lack established certification pathways.
Animal Disease Outbreaks Affecting Livestock Supply
Avian influenza H5N1 outbreaks in Iraq's Diyala and Basra provinces during Q1 2025 led to the culling of 1.2 million birds and triggered import bans by Saudi Arabia and Kuwait, reducing cross-border egg-protein flows and pushing spot prices for spray-dried egg albumin in Riyadh wholesale markets by April 2025. Foot-and-mouth disease resurfaced in Iran's livestock sector in mid-2025, affecting 8,000 cattle and delaying milk-protein production at three dairy cooperatives in Tehran province, according to the World Organisation for Animal Health. Disease outbreaks disrupt supply chains, inflate raw-material costs, and erode consumer confidence in domestic protein sources, forcing processors to pivot toward imports from Australia and New Zealand that carry higher freight and insurance premiums. Biosecurity investments, including automated disinfection systems and veterinary monitoring, are rising, yet smaller farms lack the capital to implement comprehensive disease-prevention protocols, perpetuating vulnerability to future outbreaks.
*Our forecasts treat driver/restraint impacts as directional, not additive. The impact forecasts reflect baseline growth, mix effects, and variable interactions.
Segment Analysis
By Protein Type: Dairy Ingredients Anchor Volume Growth
Milk protein held 29.57% of the 2025 market share and is forecast to grow at 6.88% annually through 2031, driven by its dual role in food formulations. Casein micelles provide texture in processed cheese and yogurt, while whey isolates deliver clean-label protein in sports beverages and infant formula. Almarai's 2025 expansion added 500,000 liters of daily milk-processing capacity, enabling production of milk-protein concentrates for export to Kuwait and Bahrain, where domestic dairy output remains constrained by water scarcity. Casein and caseinates are used in bakery and confectionery applications, where they improve dough elasticity and extend shelf life.
Egg protein captures a significant share of the market, concentrated in bakery, beverage, and ready-to-eat meal applications; avian influenza outbreaks in Iraq and Saudi Arabia's Eastern Province during Q1 2025 tightened supply and pushed spot prices for spray-dried egg albumin in 2025. Collagen and gelatin are split between pharmaceutical capsules, cosmetic serums, and confectionery gummies; the UAE's halal-cosmetics sector grew in 2025, fuelling demand for bovine collagen peptides certified under Islamic dietary law. Other animal proteins, including hydrolyzed fish protein and bone meal, serve niche aquaculture and pet-food segments, growing annually as Gulf aquaculture output expands.


By Category: Organic Variants Gain Premium Positioning
Conventional animal proteins held 88.03% of the 2025 market share, reflecting cost sensitivity among mass-market consumers and limited organic-certification infrastructure in the Middle East. Certification challenges constrain organic growth; the Gulf Cooperation Council lacks a unified organic standard, compelling producers to obtain multiple certifications, USDA Organic, EU Organic, and halal, to access premium retail channels. The organic segment attracts health-conscious millennials and affluent expatriates willing to pay premiums for traceable, pesticide-free ingredients, yet mainstream adoption hinges on reducing certification costs and expanding domestic organic livestock capacity.
Organic proteins are projected to grow at 7.36% annually through 2031, driven by expatriate demand in Dubai and Riyadh for products that meet both halal and European Union organic standards; retail prices for organic whey isolates in UAE hypermarkets averaged AED 180 per kilogram in 2025, a premium over conventional equivalents. Organic dairy farms in Saudi Arabia's Al-Kharj region supplied 2,800 metric tons of organic milk in 2025, up from 2,100 in 2024, yet domestic output remains insufficient to meet demand, forcing processors to import organic caseinates and whey from New Zealand and Germany, according to GASTAT. Organic egg protein and collagen remain underdeveloped, with fewer than 5 certified suppliers operating in the region as of 2025.
By Application: Personal Care Emerges as High-Margin Frontier
Food and beverages absorbed 74.32% of 2025 demand, anchored by ready-to-eat meals, protein-enriched breakfast cereals, and dairy alternatives that blend whey isolates with plant bases to satisfy lactose-intolerant consumers. Within food and beverages, bakery applications consumed 18,000 metric tons of egg protein and caseinates in 2025, supporting dough conditioning and shelf-life extension in flatbreads and pastries. Beverages, particularly protein shakes and fortified dairy drinks, grew in 2025, driven by fitness trends and government wellness campaigns under Saudi Vision 2030. Dairy and dairy-alternative products accounted for a significant share of food-and-beverage demand, with milk-protein concentrates enabling clean-label yogurt and cheese formulations. Ready-to-eat and ready-to-cook meals are fuelled by dual-income households in Dubai and Riyadh that prioritize convenience; Carrefour and Lulu Hypermarket expanded chilled RTE sections in Q3 2025, stocking halal-certified protein bowls and chicken wraps.
Personal care and cosmetics are the fastest-expanding applications at a 7.28% CAGR from 2026 to 2031, propelled by halal collagen peptides in anti-aging serums and gelatin capsules for nutraceuticals. Collagen-infused skincare products retail in Gulf beauty chains, targeting affluent consumers who demand ingredients free from pork derivatives and alcohol-based solvents. Animal feed grew in demand, with poultry and aquaculture operations consuming protein meals derived from fishmeal, bone meal, and emerging insect sources; Saudi Arabia's poultry sector used 45,000 metric tons of animal-protein feed in 2025, up from 41,000 in 2024. The personal-care segment's premium pricing and halal-certification requirements create high barriers to entry, favoring established suppliers with Islamic jurisprudence expertise and traceability systems.
Geography Analysis
Saudi Arabia commanded 62.65% of the 2025 market share, underpinned by vertically integrated players such as Almarai, Tanmiah, and National Poultry Company that control feed mills, slaughter facilities, and distribution networks. The Kingdom's Ministry of Environment, Water, and Agriculture allocated SAR 1.2 billion in 2025 subsidies to poultry and dairy producers, accelerating feed-mill construction and cold-chain retrofits.
Tanmiah commissioned a 120,000-bird-per-day processing plant in Al-Qassim in September 2025, raising national slaughter capacity to 1.8 million birds daily and reducing dependence on Brazilian imports. Saudi Arabia's per-capita animal-protein consumption grew in 2025, driven by population growth, urbanization, and government wellness campaigns that promote high-protein diets. The United Arab Emirates held a significant share of 2025 revenue, concentrated in Dubai and Abu Dhabi, where expatriate populations and tourism flows sustain demand for premium halal-certified proteins.
Iran is the fastest-growing geography at 8.33% CAGR through 2031, driven by domestic poultry-breeding programs that lifted production by 200 million birds in 2025 and reduced reliance on imports after sanctions tightened currency flows, according to the Iran Poultry Association. The Rest of the Middle East, including Kuwait, Oman, Bahrain, and Qatar, is characterized by import dependency and limited domestic livestock capacity due to arable-land scarcity; these markets rely on Saudi and UAE re-exports and direct shipments from Brazil, Australia, and New Zealand.

Competitive Landscape
The Middle East animal-protein market exhibits moderate fragmentation, as vertically integrated dairy and poultry conglomerates coexist with mid-tier processors and niche halal-ingredient suppliers. Almarai, Tanmiah, and Americana Group dominate Saudi Arabia through ownership of feed mills, slaughter facilities, and cold-chain networks, enabling cost control and rapid response to demand shifts; Almarai's SAR 1.5 billion 2025 investment in dairy-processing lines exemplifies the capital intensity required to maintain market leadership.
Mid-tier players such as Al Islami Foods and Sunbulah Group are forming joint ventures with European dairy-ingredient suppliers to access caseinates and hydrolyzed collagen that meet Gulf Cooperation Council halal certification under GSO 2055-2, a strategy that bypasses the need for domestic livestock expansion while capturing premium pricing in organic and specialty segments. White-space opportunities include insect protein for animal feed, Saudi Food and Drug Authority-approved black soldier fly larvae in March 2025, and halal-certified collagen peptides for cosmetics, where the UAE's sector growth in 2025 signals unmet demand.
Smaller processors in Oman and Kuwait lack the scale to invest in automated slaughter lines and Internet-of-Things cold-chain monitoring, prompting consolidation as regional players acquire family-owned operations to gain distribution reach and halal-certification expertise. Emerging disruptors include UAE-based insect-protein startups that secured AED 150 million in government grants in 2025 to pilot vertical farms producing larvae meal for aquaculture, a move that could reduce reliance on imported fishmeal and soy. The competitive landscape favors firms that combine halal-certification rigor, cold-chain infrastructure, and diversified protein portfolios spanning dairy, poultry, and emerging insect sources, as regulatory complexity and food-security imperatives elevate barriers to entry and reward incumbents with government relationships and traceability systems.
Middle East Animal Protein Industry Leaders
-
Hilmar Cheese Company Inc.
-
Kerry Group PLC
-
MEGGLE GmbH & Co. KG
-
Ornua Co-operative Limited
-
Royal FrieslandCampina NV
- *Disclaimer: Major Players sorted in no particular order

Recent Industry Developments
- January 2026: The UAE government announced strategic initiatives and partnerships with alternative protein firms (e.g., The EVERY Company and Vivici) to build an ecosystem for advanced proteins via fermentation (including dairy and egg alternatives). This region‑level partnership strategy signals growing institutional support for precision‑fermented animal/protein replacement ingredients, relevant to global firms targeting Middle East expansion.
- November 2025: NextProtein secured significant funding of nearly USD 19.6 million to scale industrial production at a second facility in Tunisia, aiming to produce ~12,000 tons/year of insect‑derived ingredients (including protein powder). This is a Middle East/Africa region production expansion of insect protein ingredients at scale, relevant to feed, aquaculture, and protein ingredient supply dynamics in the broader regional market.


Middle East Animal Protein Market Report Scope
Animal protein is a high-quality, complete protein derived from animal sources, such as meat, poultry, fish, eggs, and dairy, containing all nine essential amino acids necessary for human dietary needs. The Middle East Animal Protein Market is Segmented by Protein Type (Casein and Caseinates, Collagen, Egg Protein, Gelatin, Insect Protein, Milk Protein, Whey Protein, and More), Category (Conventional and Organic) Application (Animal Feed, Food and Beverages, Personal Care and Cosmetics, and Supplements), and Geography (Iran, Saudi Arabia, United Arab Emirates, and More). The Market Forecasts are Provided in Terms of Value (USD).
Protein Type
| Casein and Caseinates |
| Collagen |
| Egg Protein |
| Gelatin |
| Insect Protein |
| Milk Protein |
| Whey Protein |
| Other Animal Proteins |
Category
| Conventional |
| Organic |
Application
| Animal Feed | |
| Personal Care and Cosmetics | |
| Food and Beverages | Bakery |
| Beverages | |
| Breakfast Cereals | |
| Condiments/Sauces | |
| Confectionery | |
| Dairy and Dairy Alternative Products | |
| RTE/RTC Food Products | |
| Other Food and Beverage Applications | |
| Supplements |
Geography
| Saudi Arabia |
| Iran |
| United Arab Emirates |
| Rest of the Middle East |
| Protein Type | Casein and Caseinates | |
| Collagen | ||
| Egg Protein | ||
| Gelatin | ||
| Insect Protein | ||
| Milk Protein | ||
| Whey Protein | ||
| Other Animal Proteins | ||
| Category | Conventional | |
| Organic | ||
| Application | Animal Feed | |
| Personal Care and Cosmetics | ||
| Food and Beverages | Bakery | |
| Beverages | ||
| Breakfast Cereals | ||
| Condiments/Sauces | ||
| Confectionery | ||
| Dairy and Dairy Alternative Products | ||
| RTE/RTC Food Products | ||
| Other Food and Beverage Applications | ||
| Supplements | ||
| Geography | Saudi Arabia | |
| Iran | ||
| United Arab Emirates | ||
| Rest of the Middle East | ||


Market Definition
- End User - The Protein Ingredients Market operates on a B2B basis. Food, Beverages, Supplements, Animal Feed, and Personal Care & Cosmetic manufacturers are considered to be end-consumers in the market studied. The scope excludes manufacturers buying liquid/dry whey to be used for application as a binding agent or thickener or other non-protein applications.
- Penetration Rate - Penetration Rate is defined as the percentage of Protein-Fortified End User Market Volume in the Overall End User Market Volume.
- Average Protein Content - Average protein content is the average protein content present per 100 g of product manufactured by all end-user companies considered under the scope of this report.
- End User Market Volume - End-user market volume is the consolidated volume of all types and forms of end-user products in the country or region.
| Keyword | Definition |
|---|---|
| Alpha-lactalbumin (α-Lactalbumin) | It is a protein that regulates the production of lactose in the milk of almost all mammalian species. |
| Amino acid | It is an organic compound that contains both amino and carboxylic acid functional groups, which are required for the synthesis of body protein and other important nitrogen-containing compounds, such as creatine, peptide hormones, and some neurotransmitters. |
| Blanching | It is the process of briefly heating vegetables with steam or boiling water. |
| BRC | British Retail Consortium |
| Bread improver | It is a flour-based blend of several components with specific functional properties designed to modify dough characteristics and give quality attributes to bread. |
| BSF | Black Soldier Fly |
| Caseinate | It is a substance produced by adding an alkali to acid casein, a derivative of casein. |
| Celiac disease | Celiac disease is an immune reaction to eating gluten, a protein found in wheat, barley, and rye. |
| Colostrum | It is a milky fluid that’s released by mammals that have recently given birth before breast milk production begins. |
| Concentrate | It is the least processed form of protein and has a protein content ranging from 40-90% by weight. |
| Dry protein basis | It refers to the percentage of "pure protein" present in a supplement after the water in it is completely removed through heat. |
| Dry whey | It is the product resulting from drying fresh whey which has been pasteurized and to which nothing has been added as a preservative. |
| Egg protein | It is a mixture of individual proteins, including ovalbumin, ovomucoid, ovoglobulin, conalbumin, vitellin, and vitellenin. |
| Emulsifier | It is a food additive that facilitates the blending of foods that are immiscible with one another, such as oil and water. |
| Enrichment | It is the process of addition of micronutrients that are lost during the processing of the product. |
| ERS | Economic Research Service of the USDA |
| Extrusion | It is the process of forcing soft mixed ingredients through an opening in a perforated plate or die designed to produce the required shape. The extruded food is then cut to a specific size by blades. |
| Fava | Also known as Faba, it is another word for yellow split beans. |
| FDA | Food and Drug Administration |
| Flaking | It is a process in which typically a cereal grain (like corn, wheat, or rice) is broken down into grits, cooked with flavors and syrups, and then pressed into flakes between cooled rollers. |
| Foaming agent | It is a food ingredient that makes it possible to form or maintain a uniform dispersion of a gaseous phase in a liquid or solid food. |
| Foodservice | It refers to the part of the food industry which includes businesses, institutions, and companies which prepare meals outside the home. It includes restaurants, school and hospital cafeterias, catering operations, and many other formats. |
| Fortification | It is the deliberate addition of micronutrients that are not found in them naturally or which are lost during processing, to improve a food product's nutritional value. |
| FSANZ | Food Standards Australia New Zealand |
| FSIS | Food Safety and Inspection Service |
| FSSAI | Food Safety and Standards Authority of India |
| Gelling agent | It is an ingredient that functions as a stabilizer and thickener to provide thickening without stiffness through the formation of gel. |
| GHG | Greenhouse Gas |
| Gluten | It is a family of proteins found in grains, including wheat, rye, spelt, and barley. |
| Hemp | It is a botanical class of Cannabis sativa cultivars grown specifically for industrial or medicinal use. |
| Hydrolysate | It is a form of protein manufactured by exposing the protein to enzymes that can partially break the bonds between the protein's amino acids and break down large, complicated proteins into smaller pieces. Its processing makes it easier and quicker to digest. |
| Hypoallergenic | It refers to a substance that causes fewer allergic reactions. |
| Isolate | It is the purest and most processed form of protein which has undergone separation to obtain a pure protein fraction. It typically contains ≥ 90% of protein by weight. |
| Keratin | It is a protein that helps form hair, nails, and the outer layer of skin. |
| Lactalbumin | It is the albumin contained in milk and obtained from whey. |
| Lactoferrin | It is an iron‑binding glycoprotein that is present in the milk of most mammals. |
| Lupin | It is the yellow legume seeds of the genus Lupinus. |
| Millenial | Also known as Generation Y or Gen Y, it refers to the people born from 1981 to 1996. |
| Monogastric | It refers to an animal with a single-compartmented stomach. Examples of monogastric include humans, poultry, pigs, horses, rabbits, dogs, and cats. Most monogastric are generally unable to digest much cellulose food materials such as grasses. |
| MPC | Milk protein concentrate |
| MPI | Milk protein isolate |
| MSPI | Methylated soy protein isolate |
| Mycoprotein | Mycoprotein is a form of single-cell protein, also known as fungal protein, derived from fungi for human consumption. |
| Nutricosmetics | It is a category of products and ingredients that act as nutritional supplements to care for skin, nails, and hair natural beauty. |
| Osteoporosis | It is a medical condition in which the bones become brittle and fragile from loss of tissue, typically as a result of hormonal changes, or deficiency of calcium or vitamin D. |
| PDCAAS | Protein digestibility-corrected amino acid score (PDCAAS) is a method of evaluating the quality of a protein based on both the amino acid requirements of humans and their ability to digest it. |
| Per-capita consumption of animal protein | It is the average amount of animal protein (such as milk, whey, gelatin, collagen, and egg proteins) that is readily available for consumption by each person in an actual population. |
| Per-capita consumption of plant protein | It is the average amount of plant protein (such as soy, wheat, pea, oat, and hemp proteins) that is readily available for consumption by each person in an actual population. |
| Quorn | It is a microbial protein manufactured using mycoprotein as an ingredient, in which the fungus culture is dried and mixed with egg albumen or potato protein, which acts as a binder, and then is adjusted in texture and pressed into various forms. |
| Ready-to-Cook (RTC) | It refers to food products that include all of the ingredients, where some preparation or cooking is required through a process that is given on the package. |
| Ready-to-Eat (RTE) | It refers to a food product prepared or cooked in advance, with no further cooking or preparation required before being eaten. |
| RTD | Ready-to-Drink |
| RTS | Ready-to-Serve |
| Saturated fat | It is a type of fat in which the fatty acid chains have all single bonds. It is generally considered unhealthy. |
| Sausage | It is a meat product made of finely chopped and seasoned meat, which may be fresh, smoked, or pickled and which is then usually stuffed into a casing. |
| Seitan | It is a plant-based meat substitute made out of wheat gluten. |
| Softgel | It is a gelatin-based capsule with a liquid fill. |
| SPC | Soy protein concentrate |
| SPI | Soy protein isolate |
| Spirulina | It is a biomass of cyanobacteria that can be consumed by humans and animals. |
| Stabilizer | It is an ingredient added to food products to help maintain or enhance their original texture, and physical and chemical characteristics. |
| Supplementation | It is the consumption or provision of concentrated sources of nutrients or other substances that are intended to supplement nutrients in the diet and is intended to correct nutritional deficiencies. |
| Texturant | It is a specific type of food ingredient that is used to control and alter the mouthfeel and texture of food and beverage products. |
| Thickener | It is an ingredient that is used to increase the viscosity of a liquid or dough and make it thicker, without substantially changing its other properties. |
| Trans fat | Also called trans-unsaturated fatty acids or trans fatty acids, it is a type of unsaturated fat that naturally occurs in small amounts in meat. |
| TSP | Textured soy protein |
| TVP | Textured vegetable protein |
| WPC | Whey protein concentrate |
| WPI | Whey protein isolate |


Research Methodology
Mordor Intelligence follows a four-step methodology in all our reports.
- Step-1: Identify Key Variables: The quantifiable key variables (industry and extraneous) pertaining to the specific product segment and country are selected from a group of relevant variables & factors based on desk research & literature review; along with primary expert inputs. These variables are further confirmed through regression modeling (wherever required).
- Step-2: Build a Market Model: In order to build a robust forecasting methodology, the variables and factors identified in Step-1 are tested against available historical market numbers. Through an iterative process, the variables required for market forecast are set and the model is built on the basis of these variables.
- Step-3: Validate and Finalize: In this important step, all market numbers, variables and analyst calls are validated through an extensive network of primary research experts from the market studied. The respondents are selected across levels and functions to generate a holistic picture of the market studied.
- Step-4: Research Outputs: Syndicated Reports, Custom Consulting Assignments, Databases & Subscription Platforms


