Market Overview
| Study Period | 2021 - 2031 |
|---|---|
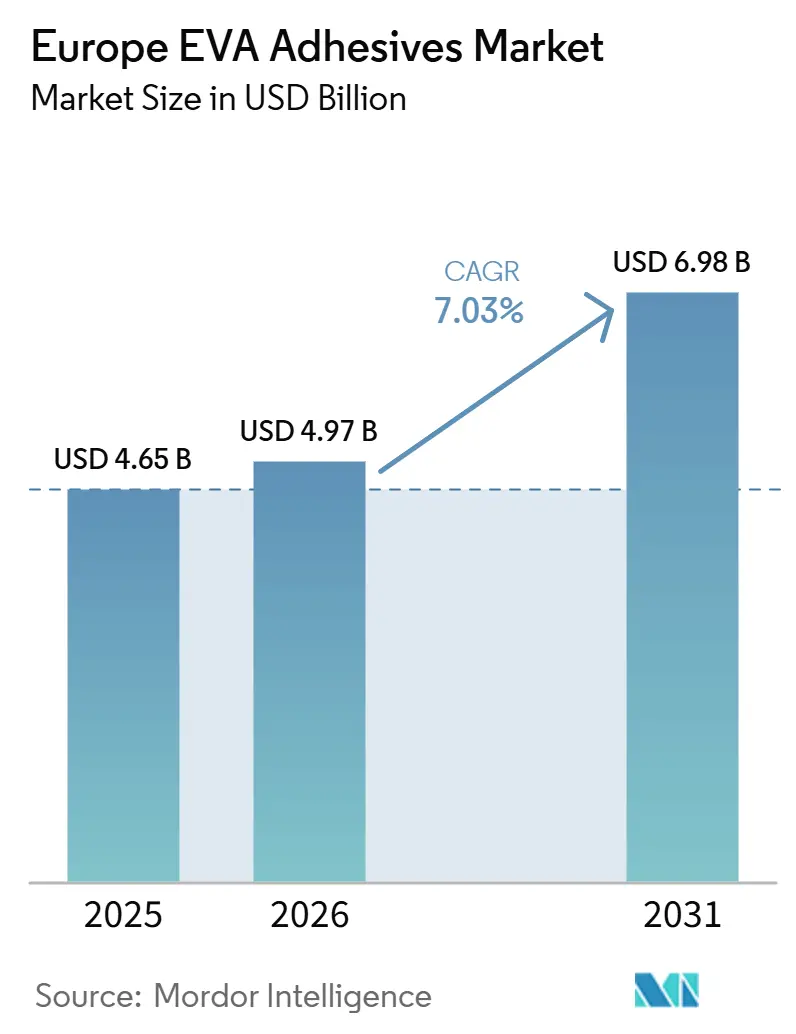
| Base Year Market Size (2025) | USD 4.65 Billion |
| Market Size (2026) | USD 4.97 Billion |
| Market Size (2031) | USD 6.98 Billion |
| Growth Rate (2026 - 2031) | 7.03% CAGR |
| Largest Market | Germany |
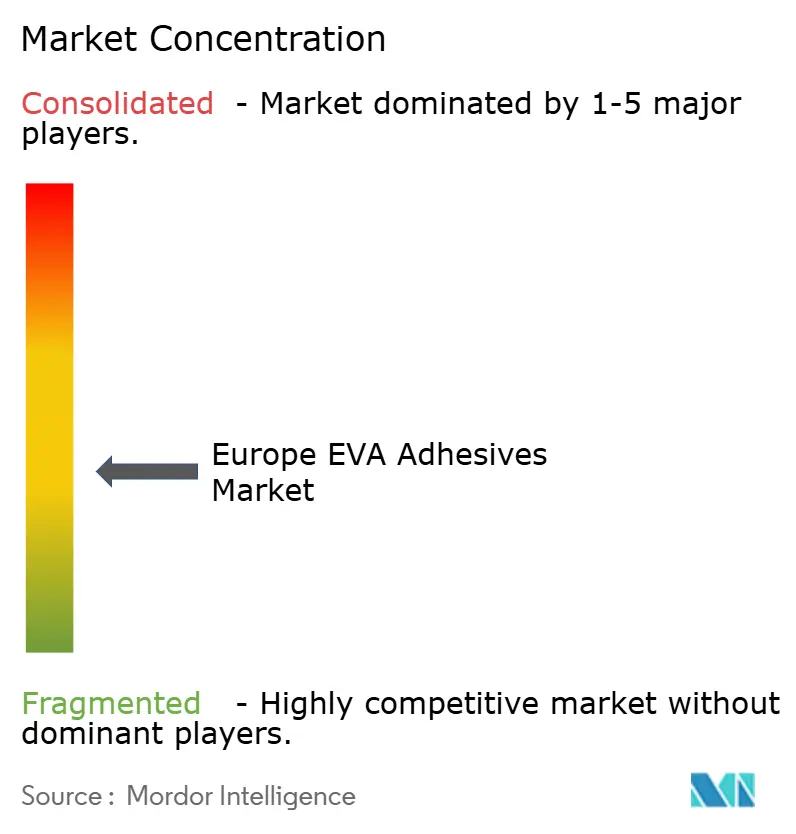
| Market Concentration | Medium |
Major Players *Disclaimer: Major Players sorted in no particular order Image © Mordor Intelligence. Reuse requires attribution under CC BY 4.0. | |
Europe EVA Adhesives Market Analysis by Mordor Intelligence
The EVA-based adhesives market size is projected to be USD 4.65 billion in 2025, USD 4.97 billion in 2026, and reach USD 6.98 billion by 2031, growing at a CAGR of 7.03% from 2026 to 2031. Packaging converters, automotive tier-1 suppliers, and medical-device assemblers are accelerating demand as they look for low-VOC, fast-setting, and lightweight bonding solutions. Stricter Registration, Evaluation, Authorisation and Restriction of Chemicals (REACH) Annex XVII limits, rising e-commerce parcel volumes, and the European Union’s 2027 fleet CO₂ caps are the prime catalysts. Feedstock volatility and the rapid advance of polyolefin elastomers and thermoplastic polyurethanes create cost and performance headwinds, yet integrated formulators are offsetting these risks through bio-attributed copolymers, crosslinkable hot melts, and on-site technical support. Germany remains the volume anchor, while Russia leads growth thanks to state-funded infrastructure programs that prioritize domestic adhesive sourcing.
Key Report Takeaways
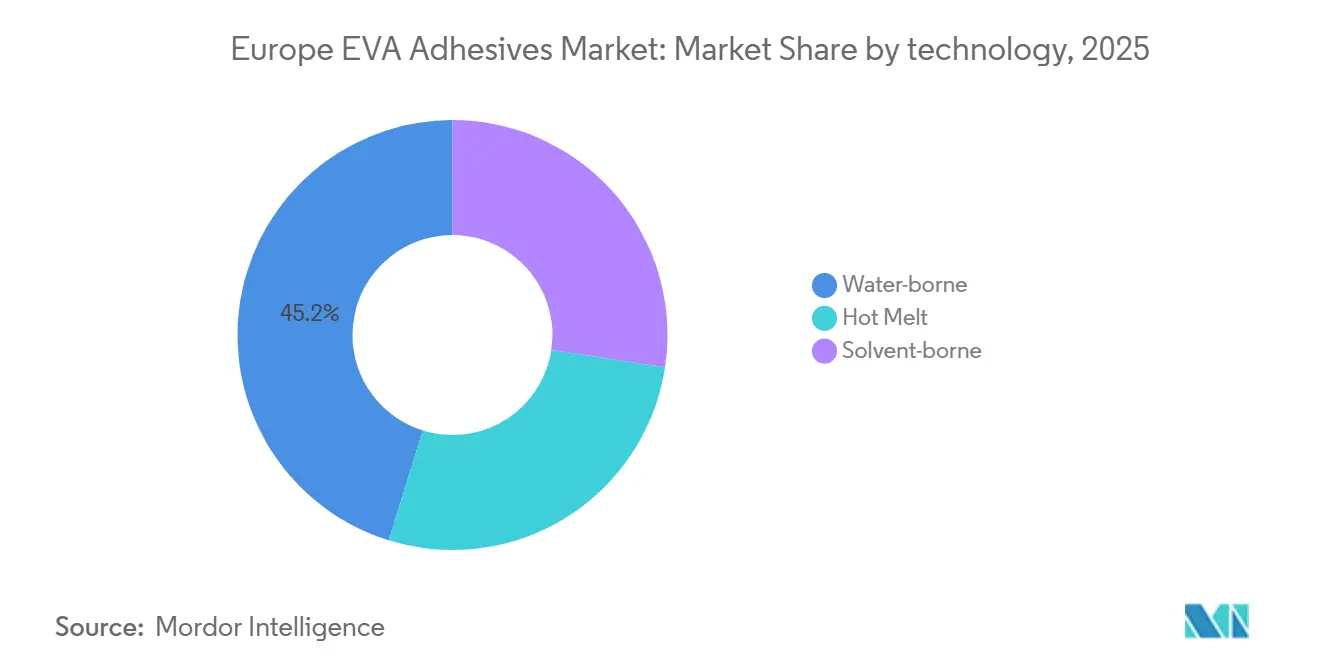
- By technology, water-borne formulations led with 45.20% of the EVA-based adhesives market share in 2025, while hot melts are projected to expand at a 7.89% CAGR through 2031.
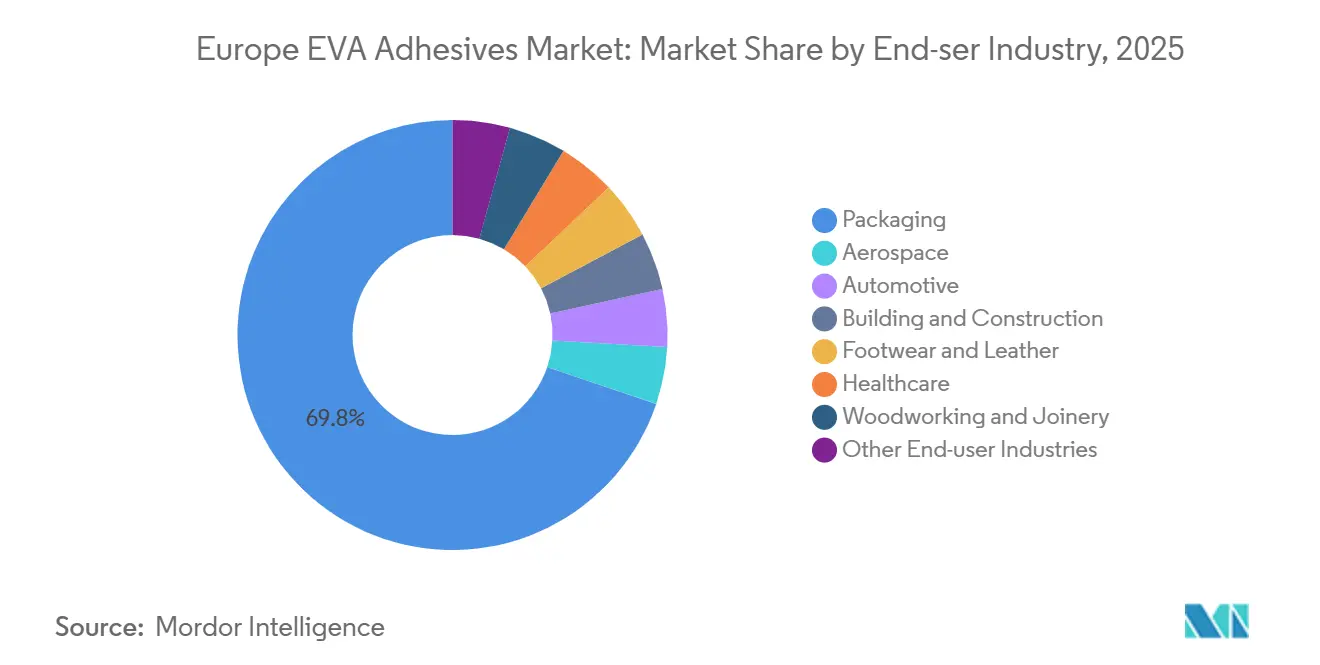
- By end-user industry, packaging captured 69.80% revenue share in 2025; healthcare is forecast to advance at an 8.45% CAGR to 2031.
- By geography, Germany held 47.50% of European demand in 2025, whereas Russia is set to grow fastest at 7.78% through 2031.
Note: Market size and forecast figures in this report are generated using Mordor Intelligence’s proprietary estimation framework, updated with the latest available data and insights as of January 2026.
Europe EVA Adhesives Market Trends and Insights
Drivers Impact Analysis*
| Driver | (~) % Impact on CAGR Forecast | Geographic Relevance | Impact Timeline |
|---|---|---|---|
| Explosive growth of e-commerce-driven packaging demand | +1.8% | Germany, France, UK, Netherlands with spillover to Poland and Czech Republic | Medium term (2-4 years) |
| EU Renovation Wave boosting construction adhesives | +1.2% | Germany, France, Italy, Spain; strongest in urban centers targeting pre-1990 building stock | Long term (≥ 4 years) |
| Shift to low-VOC/water-borne platforms under REACH | +1.5% | EU-27 with stricter enforcement in Germany, Netherlands, Nordics | Short term (≤ 2 years) |
| OEM push for light-weight EV interiors | +1.3% | Germany, France, UK automotive clusters; early adoption in premium segments | Medium term (2-4 years) |
| High-VA, bio-based EVA grades gaining premium adoption | +0.9% | Western Europe brand owners; niche penetration in Scandinavia and Benelux | Long term (≥ 4 years) |
| Source: Mordor Intelligence | |||


Explosive Growth of E-commerce-driven Packaging Demand
E-commerce shippers face challenges with automated sortation drops of 1.2 m and temperature fluctuations ranging from -15 °C to 35 °C, testing the limits of starch glues. EVA hot melts, offering 8–12 second open times, achieve a green strength of 1.5 N/25 mm in just three seconds. This efficiency allows corrugators to operate at 400 m/min without seal failures[1]FEICA, “Hot-Melt Energy Efficiency Guidelines,” feica.eu. While parcel growth has stabilized, the shift towards mono-material boxes, which are more compatible with recycling, continues to drive up adhesive volumes. New specifications now favor copolymers with less than 5 wt% vinyl acetate, as they successfully meet the RecyClass- Association of Plastic Recyclers (APR) CG-01 protocols. Arkema's acquisition of Dow's flexible-packaging adhesive line in December 2024 highlights the industry's focus on solvent-free formulations, especially those aligning with Nestlé's migration limits. Over the next two years, as converters complete trials on low-VA systems, their influence is set to peak, especially with plans to scale these systems across multiple plants.
EU Renovation Wave Boosting Construction Adhesives
By 2030, the Renovation Wave aims to boost Europe's building-renovation rate to 2% annually, directing EUR 72.2 billion towards façade and roof enhancements[2]European Commission, “Renovation Wave Strategy,” ec.europa.eu. EVA-modified dispersions, which bond insulation panels to masonry, sidestep the thermal bridges associated with mechanical anchors and meet the EU Ecolabel VOC standards. Thanks to their national recovery plans, which allocate 35-40% of EU funds for energy retrofits, Italy and Spain are rapidly advancing. Water-borne EVA systems, boasting tack times of 25–30 minutes, twice that of vinyl-acetate homopolymers, are easing labor demands for installers, especially amidst a 15–20% shortage in trade skills.
Shift to Low-VOC/Water-borne Platforms Under REACH
In 2024, the REACH Annex XVII tightened its grip on indoor-adhesive Volatile Organic Compounds (VOC), capping water-borne products at 10 g/L and hitting solvent systems hard. Meanwhile, Germany, the Netherlands, and Nordic countries have gone a step further, imposing even stricter workplace limits at 50 mg/m³. This has led multinationals to reformulate a staggering 80 to 85% of their stock-keeping units. While industry giants like Henkel and BASF benefit from in-house polymer synthesis, many smaller enterprises find themselves at a crossroads: exit solvent lines or face a 15 to 20% premium for low-VOC resins. In the automotive realm, manufacturers are keeping cabin-air formaldehyde levels in check, capping them at 0.05 ppm. Notably, EVA dispersions can achieve this benchmark without the need for isocyanate crosslinkers. Given that public construction tenders mandate swift compliance, the market dynamics can pivot within just one budgeting cycle.
OEM Push for Lightweight EV Interiors
Reducing 100 kg from an EV increases its range by 15 to 20 km, making interior trim a critical driver for improvement. Researchers at TU Dresden have developed crosslinkable EVA hot melts that, when cured at 80 °C in a paint-bake oven, achieve a lap-shear strength of 12 to 15 MPa. This performance rivals that of polyurethane reactives, but at just 60% of the cost. Major automakers like Volkswagen, BMW, and Mercedes are now driving demand for adhesives that can maintain 80% of their strength even after enduring 1,000 hours at 85 °C and 85% relative humidity. This shift means they are moving away from the commodity 18% VA grades. While validation of these adhesives typically spans 24 to 36 months, the opening of Henkel’s EUR 20 million line in Bopfingen in 2025 signals a strong bet on their steady adoption by suppliers.
Restraints Impact Analysis*
| Restraint | (~) % Impact on CAGR Forecast | Geographic Relevance | Impact Timeline |
|---|---|---|---|
| Feed-stock (ethylene and VAM) price volatility | -1.4% | EU-27, with acute exposure in Germany, Netherlands, Belgium petrochemical hubs | Short term (≤ 2 years) |
| Rising competition from POE and TPU in high-performance niches | -0.8% | Germany, France automotive and solar sectors; Italy footwear clusters | Medium term (2-4 years) |
| End-of-life recycling barriers for EVA-bonded laminates | -0.6% | EU-27 packaging value chain; enforcement strongest in Germany, France, Netherlands | Long term (≥ 4 years) |
| Source: Mordor Intelligence | |||
Rising Competition from POE & TPU in High-Performance Niches
Metallocene polyolefin elastomers, which shave off 40% of application weight, endure 2,000 hours at 150 °C, making them prime candidates for EV battery packs. After curing, thermoplastic-polyurethane reactives achieve a lap-shear strength of 15-18 MPa, allowing footwear brands to eliminate stitching altogether. While these alternatives come with a 20-30% price premium, they offer significant value in weight-sensitive or high-temperature settings. In response, EVA suppliers are introducing grades with 33-40% VA content, but this move escalates raw material costs by 25 to 30%.
End-of-Life Recycling Barriers for EVA-Bonded Laminates
By 2030, the EU's Packaging & Packaging Waste Regulation aims for a 65% recycling target. When EVA layers exceed 5 wt% vinyl acetate, they disrupt the melt-flow of polyethylene, leading sorters to reject the films. In Germany, France, and the Netherlands, surcharges ranging from EUR 0.10 to 0.15 per kg are levied on non-recyclable packaging. This financial push is steering converters towards using polyolefin adhesives or adopting coat weights below 2 g/m². However, reformulating laminates is not a quick fix; it typically takes an entire innovation cycle of three to five years, indicating a prolonged challenge.
*Our forecasts treat driver/restraint impacts as directional, not additive. The impact forecasts reflect baseline growth, mix effects, and variable interactions.
Segment Analysis
By Technology: Hot Melts Advance Despite Water-borne Dominance
In 2025, water-borne dispersions commanded a 45.20% share of the market demand. However, hot melts are on a trajectory to surpass them, boasting a 7.89% CAGR projected through 2031. By eliminating drying ovens, manufacturers can save between 0.8 to 1.2 kWh for every kilogram produced. This also frees up 15 to 20 meters of line space, which is a crucial advantage given the current surge in energy prices. In the automotive segment, tier-1 suppliers are capitalizing on 8 to 12 second open times for robotic assembly, achieving a rate of 50 units per hour. This marks a significant 40% improvement over the dwell times required for water-borne alternatives. In terms of material performance, crosslinkable EVA hot melts are now achieving lap-shear strengths of 12 to 15 MPa at 80 °C. This presents a cost-effective challenge to traditional polyurethane reactives. For solvent-borne systems, a continued decline is expected as workplace VOC ceilings tighten next year. While niche applications in luxury footwear and leather remain, even in these segments, polyurethane reactives are gradually encroaching on market share.


By End-User Industry: Healthcare Outpaces Packaging’s Dominance
In 2025, e-commerce and food-contact regulations drove packaging to capture 69.80% of the demand. However, with a forward growth of just 6.8%, it trails behind the broader EVA-based adhesives market. This lag is largely due to brand owners' preference for recyclable mono-material structures, which lean towards low-VA copolymers. In contrast, the healthcare sector is witnessing a robust annual growth of 8.45%. Medical-device manufacturers are on the lookout for ISO 10993-compliant hot melts that maintain tackiness without leaving a residue on the skin. Additionally, wearable sensors demand adhesives that can withstand 10,000 flex cycles while remaining electrically inert.
Geography Analysis
Germany, bolstered by a dense Mittelstand network around Stuttgart, Munich, and Wolfsburg, commanded a 47.50% share of the 2025 volume. Vertical integration enables automakers and furniture giants to co-develop customized grades. However, in 2024, German volume saw a decline as high rates curbed housing starts and a 6% drop in car builds. Looking ahead, growth is projected to moderate until 2031.
In Russia, the market is emerging as the fastest-growing regional segment with a 7.78% CAGR supported by state-backed housing and infrastructure projects favoring domestic chemicals. While Western sanctions have created opportunities for local producers to offer 15 to 20 percent price reductions, challenges persist, particularly in the Siberian climate.
France's market growth is driven by a EUR 6.7 billion retrofit initiative and investments in EV battery packs. Italy benefits from its luxury carton converters and the Veneto footwear clusters. Spain experiences growth due to increasing solar encapsulation demand, while the United Kingdom faces challenges with extended REACH registration delays following Brexit. Poland leads the regional segment with a significant EUR 1.8 billion FDI influx into auto parts during 2024 and 2025.
Competitive Landscape
Henkel, Sika, H.B. Fuller, Arkema/Bostik, and 3M dominate the regional market, controlling the majority of the volume. This leaves room for over 200 SMEs that focus on short-lead-time custom grades. Major players adopt a barbell strategy, engaging in bolt-on acquisitions and targeted capacity expansions. In January 2026, Henkel acquired ATP Adhesive Systems and followed up with the purchase of the Stahl Group in February, bolstering its portfolio in low-VOC tapes and leather finishes. Arkema, in December 2024, wrapped up a deal for Dow’s flexible-packaging adhesive unit, further strengthening its solvent-free assets.
Innovation is buzzing on three fronts: bio-attributed EVA adhering to mass-balance ISCC PLUS standards, crosslinkable hot melts designed for automotive ovens, and low-VA grades that align with polyethylene recycling. Wacker Chemie boasts 48-hour custom dispersions, and Avery Dennison’s RFID-ready in-mold labels slash assembly time by 50%. Patent filings for peroxide-initiated EVA surged by 18% in 2025, spearheaded by TU Dresden, Henkel, and Arkema. The competitive landscape is intense in Germany and France, with as many as 10 vendors vying for each automotive platform. In contrast, the scene is subdued in Russia and Poland, where just two or three local players set the price.
Europe EVA Adhesives Industry Leaders
Arkema Group
Dow
Henkel AG & Co. KGaA
Jowat SE
H.B. Fuller Company
- *Disclaimer: Major Players sorted in no particular order

Recent Industry Developments
- February 2026: Henkel completed the EUR 2.1 billion acquisition of Stahl Group, adding leather coatings and widening its specialty adhesives portfolio.
- January 2026: Henkel bought ATP Adhesive Systems, a Swiss tape maker with EUR 270 million revenue, strengthening water-based platforms.


Europe EVA Adhesives Market Report Scope
EVA (Ethylene Vinyl Acetate) adhesives are a versatile, fast-setting thermoplastic adhesive, commonly used as hot melt sticks or pellets for bonding porous and non-porous materials like wood, plastics, foam, fabric, and packaging. It provides strong, flexible bonds that are water-resistant and solidify rapidly upon cooling.
The Europe EVA Adhesives market report is segmented by technology, end-user industry, and geography. By technology, the market is segmented into hot melt, solvent-borne, and water-borne. By end-user industry, the market is segmented into aerospace, automotive, building and construction, footwear and leather, healthcare, packaging, woodworking, and joinery. The report also covers the market size and forecasts for Europe EVA adhesives in 6 countries across the Europe region. For each segemnt market sizing and forecasts are provided in terms of value (USD).
By Technology
| Hot Melt |
| Solvent-borne |
| Water-borne |
By End-User Industry
| Aerospace |
| Automotive |
| Building and Construction |
| Footwear and Leather |
| Healthcare |
| Packaging |
| Woodworking and Joinery |
| Other End-user Industries |
By Country
| France |
| Germany |
| Italy |
| Russia |
| Spain |
| United Kingdom |
| Rest of Europe |
| By Technology | Hot Melt |
| Solvent-borne | |
| Water-borne | |
| By End-User Industry | Aerospace |
| Automotive | |
| Building and Construction | |
| Footwear and Leather | |
| Healthcare | |
| Packaging | |
| Woodworking and Joinery | |
| Other End-user Industries | |
| By Country | France |
| Germany | |
| Italy | |
| Russia | |
| Spain | |
| United Kingdom | |
| Rest of Europe |


Market Definition
- End-user Industry - Building & Construction, Packaging, Automotive, Aerospace, Woodworking & Joinery, Footwear & Leather, Healthcare, and Others are the end-user industries considered under the EVA adhesives market.
- Product - All EVA adhesive products are considered in the market studied
- Resin - Under the scope of the study, flexible Ethylene Vinyl Acetate Copolymer resin is considered
- Technology - For the purpose of this study, Water-borne, Solvent-borne, and Hot Melt adhesive technologies are taken into consideration.
| Keyword | Definition |
|---|---|
| Hot-melt Adhesive | Hot melt adhesives are generally 100% solid formulations, based on thermoplastic polymers. They are solid at room temperature and are activated upon heating above their softening point, at which stage they are liquid, and hence, can be processed. |
| Reactive Adhesive | A reactive adhesive is made up of monomers that react in the adhesive curing process and do not evaporate from the film during use. Instead, these volatile components become chemically incorporated into the adhesive. |
| Solvent-borne Adhesive | Solvent-borne adhesives are mixtures of solvents and thermoplastic, or slightly cross-linked polymers, such as polychloroprene, polyurethane, acrylic, silicone, and natural and synthetic rubbers (elastomers). |
| Water-borne Adhesive | Water-borne adhesives use water as a carrier or diluting medium to disperse a resin. They are set by allowing the water to evaporate or be absorbed by the substrate. These adhesives are compounded with water as a diluent, rather than a volatile organic solvent. |
| UV Cured Adhesive | UV curing adhesives induce curing and create a permanent bond without heating by using ultraviolet (UV) light or other radiation sources. An aggregation of monomers and oligomers is cured or polymerized by ultraviolet (UV) or visible light in a UV adhesive. Because UV is a radiating energy source, UV adhesives are often referred to as radiation curing or rad-cure adhesives. |
| Heat-resistant Adhesive | Heat-resistant Adhesives refer to those that do not break down under high temperatures. One aspect of a complicated system of circumstances is the adhesive's capacity to withstand disintegration brought on by high temperatures. As the temperature rises, adhesives may liquefy. They can withstand stresses resulting from differing coefficients of expansion and contraction, which might be an additional advantage. |
| Reshoring | Reshoring is the practice of moving commodity production and manufacturing back to the nation where the business was founded. Onshoring, inshoring, and back shoring are further terms used. Offshoring, the practice of producing items abroad to lower labor and manufacturing costs, is the opposite of this. |
| Oleochemicals | Oleochemicals are compounds produced from biological oils or fats. They resemble petrochemicals, which are substances made from petroleum. The oleochemical business is built on the hydrolysis of oils or fats. |
| Nonporous Materials | Nonporous materials are substances that do not permit the passage of liquid or air. Nonporous materials are those that are not porous, such as glass, plastic, metal, and varnished wood. Since no air can get through, less airflow is required to raise these materials, negating the requirement for high airflow. |
| EU-Vietnam Free Trade Agreement | A trade agreement and an investment protection agreement were concluded between the European Union and Vietnam on June 30, 2019. |
| VOC content | Compounds with limited solubility in water and high vapor pressure are known as Volatile Organic Compounds (VOCs). Many VOCs are human-made chemicals that are used and produced in the manufacture of paints, pharmaceuticals, and refrigerants. |
| Emulsion Polymerization | Emulsion polymerization is a method of producing polymers or connected groups of smaller chemical chains known as monomers, in a water solution. The method is often used to make water-based paints, adhesives, and varnishes, in which the water stays with the polymer and is marketed as a liquid product. |
| 2025 National Packaging Targets | In 2018, the Australian Environment Ministry set the following 2025 National Packaging Targets: 100% of the packaging must be reusable, recyclable, or compostable by 2025, 70% of plastic packaging must be recycled or composted by 2025, 50% of average recycled content must be included in packaging by 2025, and problematic and unnecessary single-use plastic packaging must be phased out by 2025. |
| Russian Government’s Import Substitution Policy | The Western sanctions suspended the distribution of several high-tech items to Russia, including those required by the raw material export sectors and the military-industrial complex. In response, the government launched an "import substitution" scheme, appointing a special commission to oversee its implementation in early 2015. |
| Paper Substrate | Paper substrates are paper sheets, reels, or boards with a base weight of up to 400 g/m2 that has not been converted, printed or otherwise altered. |
| Insulation Material | A material that inhibits or blocks heat, sound, or electrical transmission is known as Insulation Material. The variety of insulation materials includes thick fibers like fiberglass, rock and slag wool, cellulose, and natural fibers as well as stiff foam boards and sleek foils. |
| Thermal Shock | A temperature change known as thermal shock generates stress in a material. It commonly results in material breakdown and is especially prevalent in brittle materials like ceramics. When there is a quick temperature change, either from hot to cold or vice versa, this process occurs abruptly. It occurs more frequently in materials with poor heat conductivity and insufficient structural integrity. |


Research Methodology
Mordor Intelligence follows a four-step methodology in all our reports.
- Step-1: Identify Key Variables: The quantifiable key variables (industry and extraneous) pertaining to the specific product segment and country are selected from a group of relevant variables & factors based on desk research & literature review; along with primary expert inputs. These variables are further confirmed through regression modeling (wherever required).
- Step-2: Build a Market Model: In order to build a robust forecasting methodology, the variables and factors identified in Step-1 are tested against available historical market numbers. Through an iterative process, the variables required for market forecast are set and the model is built on the basis of these variables.
- Step-3: Validate and Finalize: In this important step, all market numbers, variables and analyst calls are validated through an extensive network of primary research experts from the market studied. The respondents are selected across levels and functions to generate a holistic picture of the market studied.
- Step-4: Research Outputs: Syndicated Reports, Custom Consulting Assignments, Databases & Subscription Platforms


