Market Overview
| Study Period | 2017 - 2028 |
|---|---|
| Forecast Data Period | 2024 - 2028 |
| Historical Data Period | 2017 - 2022 |
| Market Size (2024) | USD 12.05 Billion |
| Market Size (2028) | USD 15.43 Billion |
| Growth Rate (2024 - 2028) | 6.39% CAGR |
| Market Concentration | Low |
Major Players*Disclaimer: Major Players sorted in no particular order Image © Mordor Intelligence. Reuse requires attribution under CC BY 4.0. | |

EVA Adhesives Market Analysis by Mordor Intelligence
The EVA Adhesives Market size is estimated at 12.05 billion USD in 2024, and is expected to reach 15.43 billion USD by 2028, growing at a CAGR of 6.39% during the forecast period (2024-2028).
The EVA adhesives industry is experiencing significant transformation driven by evolving end-user requirements and sustainability initiatives. The automotive sector's shift towards lightweight vehicles to improve fuel efficiency and reduce emissions has created new opportunities for automotive adhesives, as manufacturers increasingly prefer bonding solutions over traditional joining methods like welding and mechanical fasteners. This transition is particularly evident in the production of electric vehicles, where adhesives play a crucial role in battery assembly and structural bonding. The construction industry has also embraced construction adhesives, with new building construction reaching 7.4 billion square feet in 2022, driven by the growing demand for energy-efficient buildings and sustainable construction practices.
The packaging industry continues to be a major growth driver for EVA adhesives, supported by the rapid expansion of e-commerce and changing consumer preferences. The industry's evolution is reflected in the increasing adoption of innovative packaging adhesives solutions, including dissolvable packaging, space-saving designs, and smart packaging technologies. The sector is witnessing a notable shift towards edible packaging alternatives, which help reduce reliance on fossil fuels and decrease carbon footprint. These developments are particularly significant as packaging production is projected to reach 71.5 million tons by 2028, up from 56.8 million tons in 2021.
The furniture and woodworking sector has emerged as a significant consumer of woodworking adhesives, driven by the growing trend of online furniture retail and changing consumer preferences. The industry has witnessed substantial growth, with China's furniture industry alone generating revenue of USD 76.78 billion in 2022, representing a 5.5% increase from the previous year. The sector's growth is further supported by the increasing adoption of hot melt adhesives in edge banding, profile wrapping, and assembly applications, offering manufacturers improved production efficiency and product quality.
The aerospace industry represents an emerging opportunity for industrial adhesives, with global aircraft delivery volumes expected to reach 8,021 units by 2028. The industry's demand for high-performance adhesives is driven by the need for lightweight materials and efficient assembly processes. EVA adhesives are increasingly being used in aircraft interior applications, including cabin components, small hooks, and other specialized applications where their temperature resistance and bonding properties offer significant advantages. The industry's focus on fuel efficiency and environmental sustainability continues to drive innovation in adhesive technologies, particularly in applications requiring specific temperature and performance characteristics.
Global EVA Adhesives Market Trends and Insights
Fast paced growth of e-commerce industry in developing nations to augment the industry
- In 2020, the packaging industry started with multiple long-term trends driving higher demand, and growth accelerated as economic activity switched to address the challenges posed by the COVID-19 pandemic. The industry's robust performance supported rising revenues and the expansion of important end markets such as food and beverage and healthcare and also demonstrated the industry's general stability during a period of overall economic uncertainty.
- Packaging M&A activities soared in 2021, as buyers and sellers enthusiastically returned to the market after deal-making almost ceased during the pandemic in 2020. During the pandemic, the strong performance of packaging companies reinforced the idea that the industry offers stability during moments of general market turbulence. The pandemic also strengthened previously existing tailwinds, including rapid e-commerce expansion and brand owners employing packaging to differentiate their products on supermarket shelves, positioning the sector for stronger long-term growth.
- As of now, dissolvable packaging, space-saving packaging, and smart packaging are a few innovations that have come up in the packaging industry. The adoption of edible packaging, an interesting and innovative alternative that alleviates the reliance on fossil fuels and has the potential to significantly decrease the carbon footprint, is now becoming popular across the food industry owing to its sustainability. These factors have created a growth opportunity for the packaging industry in the food and beverage sector, which is expected to boost the packaging industry's growth during the forecast period.


Favorable government policies to promote electric vehicles will propel automotive industry
- Since 2021, the global automotive industry has been expected to grow steadily but at a slower pace because of the decline in consumers' preferences for individual ownership of passenger vehicles and their increased preference for shared mobility in transportation. The global automotive industry is expected to experience a growth rate of 2% annually, with an expected value addition of USD 1.5 trillion in total revenue during the forecast period.
- In 2020, due to the impact of the COVID-19 pandemic, vehicle sales declined but recovered rapidly in 2021 because the governments of various countries took measures to support their economies, as automotive markets usually contribute majorly to their GDP. Vehicle sales declined from 90 million units of passenger vehicles in 2019 to 78 million units in 2020.
- The introduction of electric vehicles worldwide has contributed significantly to the overall revenue of the global automotive market because of their cheaper energy costs, environmentally benign nature, and efficient mobility features. Various government policies and standards also work as driving factors to increase EV production. For instance, the EU standards for CO2 emissions increased the demand for electric vehicles in 2021. As per the IEA's Sustainable Scenario, 230 million electric vehicles are required to replace combustion fuel-based vehicles by 2030. In 2021, Tesla, the largest EV manufacturer, recorded a rise of 157% in the number of electric vehicles manufactured. This growing trend of consumers preferring electric vehicles is expected to rise further during the forecast period (2022-2028).

OTHER KEY INDUSTRY TRENDS COVERED IN THE REPORT
- Rapid growth of civil and military aviation will boost the aircraft production
- Easy availability of resources will support the footwear industry specifically in developing countries
- Growing residential and infrastructural development to thrive the construction sector
- Rising demand for home & office furniture to aid the growth of the industry
Segment Analysis: End User Industry
Packaging Segment in EVA Adhesives Market
The packaging segment dominates the global EVA adhesives market, commanding approximately 74% market share in 2024. This substantial market position is primarily driven by the extensive use of EVA adhesives in various packaging applications, including paper/card stock boxes, package labeling, carton sealing, and paper conversion processes. The segment's dominance is further strengthened by the growing e-commerce industry worldwide, which has significantly increased the demand for sustainable and efficient packaging solutions. EVA adhesives are particularly favored in the packaging industry due to their versatility, ability to bond with commonly used packaging substrates like paper and varieties of cardboard, and their capability to maintain functionality in temperature ranges from -40 degrees F to 160 degrees F.

Healthcare Segment in EVA Adhesives Market
The healthcare segment is emerging as the fastest-growing segment in the EVA adhesives market, projected to grow at approximately 6% during 2024-2029. This growth is primarily driven by the increasing adoption of EVA adhesives in medical packaging, medical device manufacturing, pharmaceutical applications, and medical membrane and multi-layer barrier films. The segment's growth is further supported by the adhesives' biocompatible nature, low odor characteristics, and ability to impart chemical and thermal resistance. The rising demand for specialized medical packaging solutions and the growing emphasis on sterile packaging in healthcare applications continue to drive innovation in EVA adhesive formulations for this sector.
Remaining Segments in End User Industry
The remaining segments in the EVA adhesives market include automotive, building and construction, woodworking and joinery, footwear and leather, and aerospace industries. The automotive sector utilizes EVA adhesives for interior applications and component assembly, while the building and construction segment employs them for insulation panels and interior decoration. The woodworking and joinery industry primarily uses EVA adhesives for edge banding and lamination adhesive applications. In the footwear and leather segment, these adhesives are crucial for sole bonding and leather assembly. The aerospace sector, though smaller in market share, uses EVA adhesives for specific interior applications and component assembly where lightweight bonding solutions are required.
Segment Analysis: Technology
Water-borne Segment in EVA Adhesives Market
The water-borne technology segment dominates the global EVA adhesives market, holding approximately 56% market share in 2024. This significant market position is attributed to its eco-friendly nature and superior performance characteristics. Water-borne EVA adhesives are particularly favored in industries requiring high flexibility, moisture resistance, and superior substrate adhesion. These adhesives demonstrate excellent compatibility with commonly used packaging substrates like paper and various types of cardboard, including corrugated, solid, and duplex varieties. The segment's dominance is further strengthened by increasing environmental regulations promoting the use of low-VOC adhesive solutions, particularly in developed regions. Water-borne EVA adhesives maintain functionality across a wide temperature range and offer excellent bonding properties for materials like cloth, foam, wood, plywood, polyester, paper, film, and metals.
Hot Melt Segment in EVA Adhesives Market
The hot melt adhesive technology segment is experiencing the fastest growth in the EVA adhesives market, with a projected growth rate of approximately 6% during 2024-2029. This accelerated growth is driven by several factors, including the segment's versatility and cost-effectiveness across multiple applications. Hot melt adhesives are gaining significant traction due to their rapid curing properties, wide temperature resistance range (-40°F to 160°F), and customizable viscosity options ranging from 900 to 3,000 cPs. The segment's growth is particularly notable in edge banding applications, automotive interior bonding, and packaging industries. The increasing adoption of these adhesives in emerging economies, coupled with their superior performance in high-speed manufacturing processes, continues to drive their market expansion. The segment also benefits from ongoing technological advancements that enhance bonding strength and thermal resistance properties.
Remaining Segments in Technology
The solvent-borne technology segment, while smaller in market share, maintains its significance in specific applications where specialized bonding properties are required. This technology offers unique advantages in applications requiring high bond strength and specific curing properties. Solvent-borne EVA adhesives are particularly valued in the footwear and leather industry for their ability to create strong bonds with rubber sheets and outer soles. The segment continues to evolve with new formulations that address environmental concerns while maintaining performance standards. Despite facing challenges from environmental regulations and increasing preference for eco-friendly alternatives, solvent-borne technology remains relevant in niche applications where its specific properties are essential for product performance.
EVA Adhesives Market Geography Segment Analysis
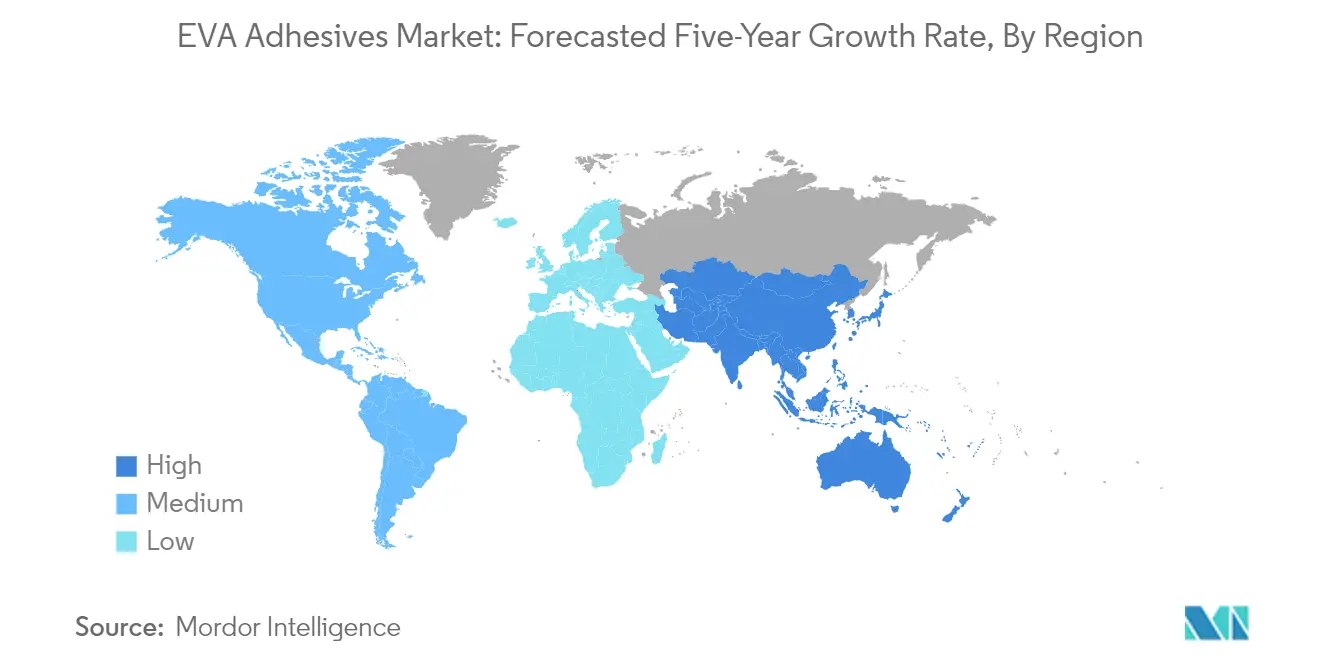
EVA Adhesives Market in Asia-Pacific
The Asia-Pacific region represents the largest market for EVA adhesives globally, driven by its extensive manufacturing capabilities across multiple end-user industries. The region's dominance is supported by countries like China, India, Japan, and South Korea, which have well-established industrial bases in the automotive, packaging, and construction sectors. Countries such as Australia, Indonesia, Malaysia, Singapore, and Thailand also contribute significantly to the regional market through their growing construction and packaging industries. The region's market is characterized by increasing adoption of EVA hot-melt adhesives in various applications, particularly in the packaging and automotive sectors.
EVA Adhesives Market in China
China stands as the powerhouse of the Asia-Pacific EVA adhesives market, leveraging its position as the world's largest manufacturing hub. The country's massive packaging industry, coupled with its dominant automotive and construction sectors, drives substantial demand for EVA adhesives. China's market is characterized by a strong presence of both domestic and international manufacturers, extensive distribution networks, and continuous technological advancements in adhesive applications. In 2024, China is expected to hold approximately 37% share of the Asia-Pacific EVA adhesives market, reinforcing its position as the regional leader.
EVA Adhesives Market in India
India emerges as the fastest-growing market for EVA adhesives in the Asia-Pacific region, driven by rapid industrialization and expanding end-user industries. The country's market growth is supported by increasing investments in the construction, automotive, and packaging sectors. The government's focus on manufacturing through various initiatives has created a favorable environment for adhesive manufacturers. India's EVA adhesives market is projected to grow at approximately 7% annually from 2024 to 2029, driven by rising domestic demand and increasing foreign investments in manufacturing sectors.
EVA Adhesives Market in Europe
The European EVA adhesives market demonstrates strong growth potential, supported by advanced manufacturing capabilities and stringent quality standards. The region's market is characterized by high technological adoption and an increasing focus on sustainable adhesive solutions. Key markets including Germany, France, Italy, Spain, Russia, and the United Kingdom drive regional growth through their well-established automotive, construction, and packaging industries. The region's emphasis on environmental regulations and sustainable manufacturing practices continues to shape market development.
EVA Adhesives Market in Germany
Germany maintains its position as the largest EVA adhesives market in Europe, supported by its robust automotive and manufacturing sectors. The country's market is characterized by high-quality standards, technological innovation, and strong research and development capabilities. German manufacturers focus on developing advanced adhesive solutions for various industrial applications. In 2024, Germany is expected to account for approximately 31% of the European EVA adhesives market, highlighting its dominant position in the region.
EVA Adhesives Market in Germany
As both the largest and fastest-growing market in Europe, Germany continues to demonstrate strong growth potential in the EVA adhesives sector. The country's market is driven by increasing demand from the automotive, packaging, and construction industries. German manufacturers are increasingly focusing on developing innovative and sustainable adhesive solutions. The market is projected to grow at approximately 6% annually from 2024 to 2029, supported by technological advancements and increasing industrial applications.
EVA Adhesives Market in Middle East & Africa
The Middle East & Africa region presents unique opportunities in the EVA adhesives market, driven by increasing construction activities and industrial development. The region's market is characterized by growing investments in infrastructure projects and expanding manufacturing capabilities. Saudi Arabia and South Africa emerge as key markets in the region, with significant investments in construction and packaging industries driving market growth.
EVA Adhesives Market in Saudi Arabia
Saudi Arabia leads the Middle East & Africa EVA adhesives market, driven by extensive construction activities and infrastructure development projects. The country's market benefits from significant government investments in the construction and industrial sectors. The implementation of large-scale construction schemes under Vision 2030 continues to drive demand for EVA adhesives in various applications.
EVA Adhesives Market in Saudi Arabia
As both the largest and fastest-growing market in the Middle East & Africa region, Saudi Arabia demonstrates strong growth potential in the EVA adhesives sector. The country's market growth is supported by increasing investments in construction projects and expanding industrial applications. The focus on developing sustainable building solutions and modern infrastructure continues to drive market expansion.
EVA Adhesives Market in North America
The North American EVA adhesives market demonstrates strong growth potential, driven by technological advancements and diverse industrial applications. The region encompasses key markets including the United States, Canada, and Mexico, with each country contributing significantly to market development. The United States emerges as both the largest and fastest-growing market in the region, supported by its extensive manufacturing capabilities and innovative adhesive solutions. The regional market benefits from strong research and development activities and an increasing focus on sustainable adhesive technologies.
EVA Adhesives Market in South America
The South American EVA adhesives market shows promising growth potential, driven by expanding industrial applications and increasing manufacturing activities. The region's market, primarily led by Brazil and Argentina, demonstrates growing demand from the packaging, construction, and automotive sectors. Brazil emerges as both the largest and fastest-growing market in the region, supported by its robust manufacturing base and increasing industrial applications. The regional market benefits from growing investments in infrastructure development and expanding end-user industries.

Competitive Landscape
Top Companies in EVA Adhesives Market
The EVA adhesives market is led by established players like Henkel AG & Co. KGaA, Arkema Group, Aica Kogyo Co. Ltd, Dow, and Nan Pao Resins Chemical Group, who are driving innovation through sustainable product development and improved functional performance. Companies are increasingly focusing on developing eco-friendly adhesives with low VOC emissions and enhanced energy efficiency, particularly for packaging and construction adhesives applications. Strategic expansion moves are centered around strengthening distribution networks and establishing new manufacturing facilities across key regions, especially in Asia-Pacific and Europe. The industry is witnessing a strong emphasis on research and development, with companies investing in technical centers and innovation hubs to develop customized solutions. Operational agility is being achieved through strategic partnerships, acquisitions of local players, and collaboration with government bodies for sustainable development projects.
Fragmented Market with Regional Growth Opportunities
The EVA adhesives market exhibits a highly fragmented structure, with the top five companies collectively holding a relatively small market share, indicating significant opportunities for both global and regional players. Global conglomerates maintain their competitive edge through extensive product portfolios, well-established distribution channels, and strong research capabilities, while regional specialists thrive by offering customized solutions and maintaining strong relationships with local customers. The market is characterized by a mix of large chemical companies with diverse business segments and specialized adhesive manufacturers focusing on specific applications or regions.
The industry is experiencing active merger and acquisition activity, with companies pursuing strategic acquisitions to expand their geographical presence and strengthen their technological capabilities. Local companies are becoming attractive acquisition targets for global players seeking to penetrate new markets and gain access to established distribution networks. Companies are also forming strategic alliances and partnerships to enhance their product offerings and improve their market position, particularly in emerging economies where the demand for industrial adhesives is growing rapidly.
Innovation and Sustainability Drive Future Success
For incumbent players to maintain and increase their market share, focusing on sustainable product development and technological innovation is crucial. Companies need to invest in developing bio-based and environmentally friendly adhesives while maintaining high performance standards. Building strong relationships with end-users through technical support and customized solutions is becoming increasingly important. Expanding production capabilities in high-growth regions and strengthening distribution networks through strategic partnerships are essential strategies for market leaders.
New entrants and smaller players can gain ground by focusing on niche applications and specific end-user industries where they can offer specialized solutions. Developing innovative products for emerging applications, particularly in the packaging and construction sectors, presents significant opportunities. Companies need to consider potential regulatory changes regarding environmental standards and VOC emissions, which could impact product development and manufacturing processes. The risk of substitution from alternative adhesive technologies, such as pressure-sensitive adhesives, necessitates continuous innovation and product improvement to maintain market position.
EVA Adhesives Industry Leaders
Aica Kogyo Co..Ltd.
Arkema Group
Dow
Henkel AG & Co. KGaA
NANPAO RESINS CHEMICAL GROUP
- *Disclaimer: Major Players sorted in no particular order


Recent Industry Developments
- February 2022: H.B. Fuller announced the acquisition of Fourny NV to strengthen its Construction Adhesives business in Europe.
- January 2022: H.B. Fuller announced the acquisition of UK-based Apollo Chemicals to expand its foothold in the European market.
- August 2021: H.B. Fuller announced its plans to set up a new facility with a gross area of 37,000 sqm in Egypt to expand its business across Middle East & Africa.


Global EVA Adhesives Market Report Scope
Aerospace, Automotive, Building and Construction, Footwear and Leather, Healthcare, Packaging, Woodworking and Joinery are covered as segments by End User Industry. Hot Melt, Solvent-borne, Water-borne are covered as segments by Technology. Asia-Pacific, Europe, Middle East & Africa, North America, South America are covered as segments by Region.End User Industry
| Aerospace |
| Automotive |
| Building and Construction |
| Footwear and Leather |
| Healthcare |
| Packaging |
| Woodworking and Joinery |
| Other End-user Industries |
Technology
| Hot Melt |
| Solvent-borne |
| Water-borne |
Region
| Asia-Pacific | Australia |
| China | |
| India | |
| Indonesia | |
| Japan | |
| Malaysia | |
| Singapore | |
| South Korea | |
| Thailand | |
| Rest of Asia-Pacific | |
| Europe | France |
| Germany | |
| Italy | |
| Russia | |
| Spain | |
| United Kingdom | |
| Rest of Europe | |
| Middle East & Africa | Saudi Arabia |
| South Africa | |
| Rest of Middle East & Africa | |
| North America | Canada |
| Mexico | |
| United States | |
| Rest of North America | |
| South America | Argentina |
| Brazil | |
| Rest of South America |
| End User Industry | Aerospace | |
| Automotive | ||
| Building and Construction | ||
| Footwear and Leather | ||
| Healthcare | ||
| Packaging | ||
| Woodworking and Joinery | ||
| Other End-user Industries | ||
| Technology | Hot Melt | |
| Solvent-borne | ||
| Water-borne | ||
| Region | Asia-Pacific | Australia |
| China | ||
| India | ||
| Indonesia | ||
| Japan | ||
| Malaysia | ||
| Singapore | ||
| South Korea | ||
| Thailand | ||
| Rest of Asia-Pacific | ||
| Europe | France | |
| Germany | ||
| Italy | ||
| Russia | ||
| Spain | ||
| United Kingdom | ||
| Rest of Europe | ||
| Middle East & Africa | Saudi Arabia | |
| South Africa | ||
| Rest of Middle East & Africa | ||
| North America | Canada | |
| Mexico | ||
| United States | ||
| Rest of North America | ||
| South America | Argentina | |
| Brazil | ||
| Rest of South America | ||


Market Definition
- End-user Industry - Building & Construction, Packaging, Automotive, Aerospace, Woodworking & Joinery, Footwear & Leather, Healthcare, and Others are the end-user industries considered under the EVA adhesives market.
- Product - All EVA adhesive products are considered in the market studied
- Resin - Under the scope of the study, flexible Ethylene Vinyl Acetate Copolymer resin is considered
- Technology - For the purpose of this study, Water-borne, Solvent-borne, and Hot Melt adhesive technologies are taken into consideration.
| Keyword | Definition |
|---|---|
| Hot-melt Adhesive | Hot melt adhesives are generally 100% solid formulations, based on thermoplastic polymers. They are solid at room temperature and are activated upon heating above their softening point, at which stage they are liquid, and hence, can be processed. |
| Reactive Adhesive | A reactive adhesive is made up of monomers that react in the adhesive curing process and do not evaporate from the film during use. Instead, these volatile components become chemically incorporated into the adhesive. |
| Solvent-borne Adhesive | Solvent-borne adhesives are mixtures of solvents and thermoplastic, or slightly cross-linked polymers, such as polychloroprene, polyurethane, acrylic, silicone, and natural and synthetic rubbers (elastomers). |
| Water-borne Adhesive | Water-borne adhesives use water as a carrier or diluting medium to disperse a resin. They are set by allowing the water to evaporate or be absorbed by the substrate. These adhesives are compounded with water as a diluent, rather than a volatile organic solvent. |
| UV Cured Adhesive | UV curing adhesives induce curing and create a permanent bond without heating by using ultraviolet (UV) light or other radiation sources. An aggregation of monomers and oligomers is cured or polymerized by ultraviolet (UV) or visible light in a UV adhesive. Because UV is a radiating energy source, UV adhesives are often referred to as radiation curing or rad-cure adhesives. |
| Heat-resistant Adhesive | Heat-resistant Adhesives refer to those that do not break down under high temperatures. One aspect of a complicated system of circumstances is the adhesive's capacity to withstand disintegration brought on by high temperatures. As the temperature rises, adhesives may liquefy. They can withstand stresses resulting from differing coefficients of expansion and contraction, which might be an additional advantage. |
| Reshoring | Reshoring is the practice of moving commodity production and manufacturing back to the nation where the business was founded. Onshoring, inshoring, and back shoring are further terms used. Offshoring, the practice of producing items abroad to lower labor and manufacturing costs, is the opposite of this. |
| Oleochemicals | Oleochemicals are compounds produced from biological oils or fats. They resemble petrochemicals, which are substances made from petroleum. The oleochemical business is built on the hydrolysis of oils or fats. |
| Nonporous Materials | Nonporous materials are substances that do not permit the passage of liquid or air. Nonporous materials are those that are not porous, such as glass, plastic, metal, and varnished wood. Since no air can get through, less airflow is required to raise these materials, negating the requirement for high airflow. |
| EU-Vietnam Free Trade Agreement | A trade agreement and an investment protection agreement were concluded between the European Union and Vietnam on June 30, 2019. |
| VOC content | Compounds with limited solubility in water and high vapor pressure are known as Volatile Organic Compounds (VOCs). Many VOCs are human-made chemicals that are used and produced in the manufacture of paints, pharmaceuticals, and refrigerants. |
| Emulsion Polymerization | Emulsion polymerization is a method of producing polymers or connected groups of smaller chemical chains known as monomers, in a water solution. The method is often used to make water-based paints, adhesives, and varnishes, in which the water stays with the polymer and is marketed as a liquid product. |
| 2025 National Packaging Targets | In 2018, the Australian Environment Ministry set the following 2025 National Packaging Targets: 100% of the packaging must be reusable, recyclable, or compostable by 2025, 70% of plastic packaging must be recycled or composted by 2025, 50% of average recycled content must be included in packaging by 2025, and problematic and unnecessary single-use plastic packaging must be phased out by 2025. |
| Russian Government’s Import Substitution Policy | The Western sanctions suspended the distribution of several high-tech items to Russia, including those required by the raw material export sectors and the military-industrial complex. In response, the government launched an "import substitution" scheme, appointing a special commission to oversee its implementation in early 2015. |
| Paper Substrate | Paper substrates are paper sheets, reels, or boards with a base weight of up to 400 g/m2 that has not been converted, printed or otherwise altered. |
| Insulation Material | A material that inhibits or blocks heat, sound, or electrical transmission is known as Insulation Material. The variety of insulation materials includes thick fibers like fiberglass, rock and slag wool, cellulose, and natural fibers as well as stiff foam boards and sleek foils. |
| Thermal Shock | A temperature change known as thermal shock generates stress in a material. It commonly results in material breakdown and is especially prevalent in brittle materials like ceramics. When there is a quick temperature change, either from hot to cold or vice versa, this process occurs abruptly. It occurs more frequently in materials with poor heat conductivity and insufficient structural integrity. |


Research Methodology
Mordor Intelligence follows a four-step methodology in all our reports.
- Step-1: Identify Key Variables: The quantifiable key variables (industry and extraneous) pertaining to the specific product segment and country are selected from a group of relevant variables & factors based on desk research & literature review; along with primary expert inputs. These variables are further confirmed through regression modeling (wherever required).
- Step-2: Build a Market Model: In order to build a robust forecasting methodology, the variables and factors identified in Step-1 are tested against available historical market numbers. Through an iterative process, the variables required for market forecast are set and the model is built on the basis of these variables.
- Step-3: Validate and Finalize: In this important step, all market numbers, variables and analyst calls are validated through an extensive network of primary research experts from the market studied. The respondents are selected across levels and functions to generate a holistic picture of the market studied.
- Step-4: Research Outputs: Syndicated Reports, Custom Consulting Assignments, Databases & Subscription Platforms


