Market Overview
| Study Period | 2020 - 2031 |
|---|---|
| Forecast Data Period | 2026 - 2031 |
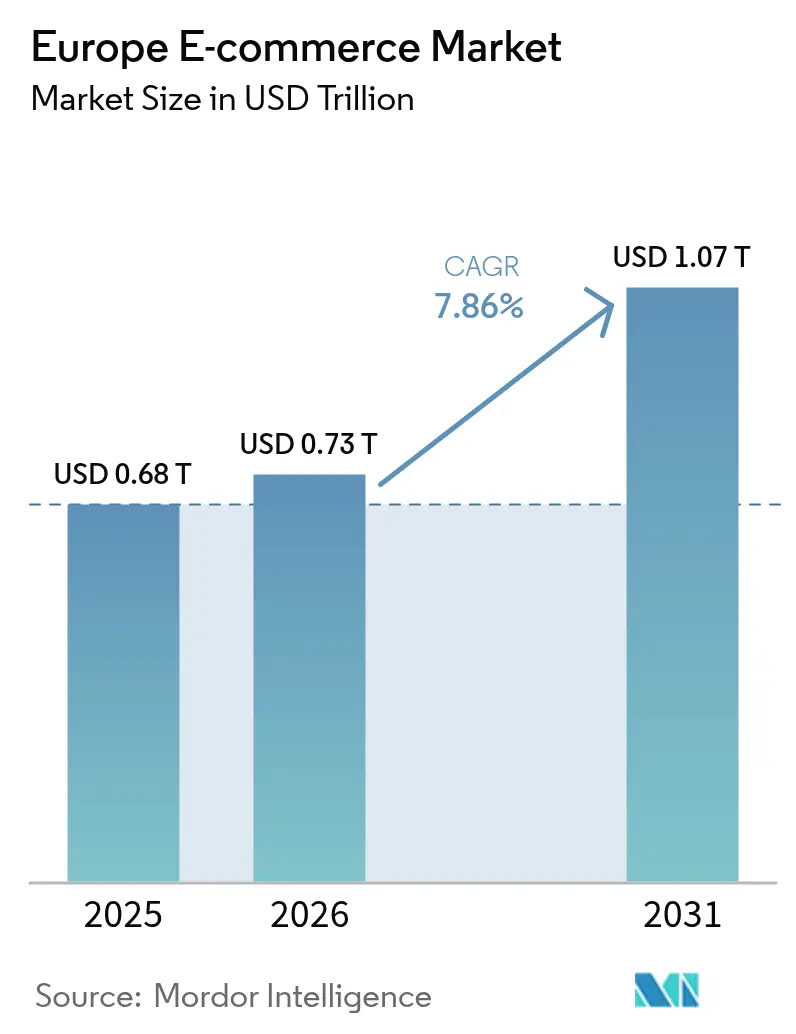
| Base Year Market Size (2025) | USD 0.68 Trillion |
| Market Size (2026) | USD 0.73 Trillion |
| Market Size (2031) | USD 1.07 Trillion |
| Growth Rate (2026 - 2031) | 7.86% CAGR |
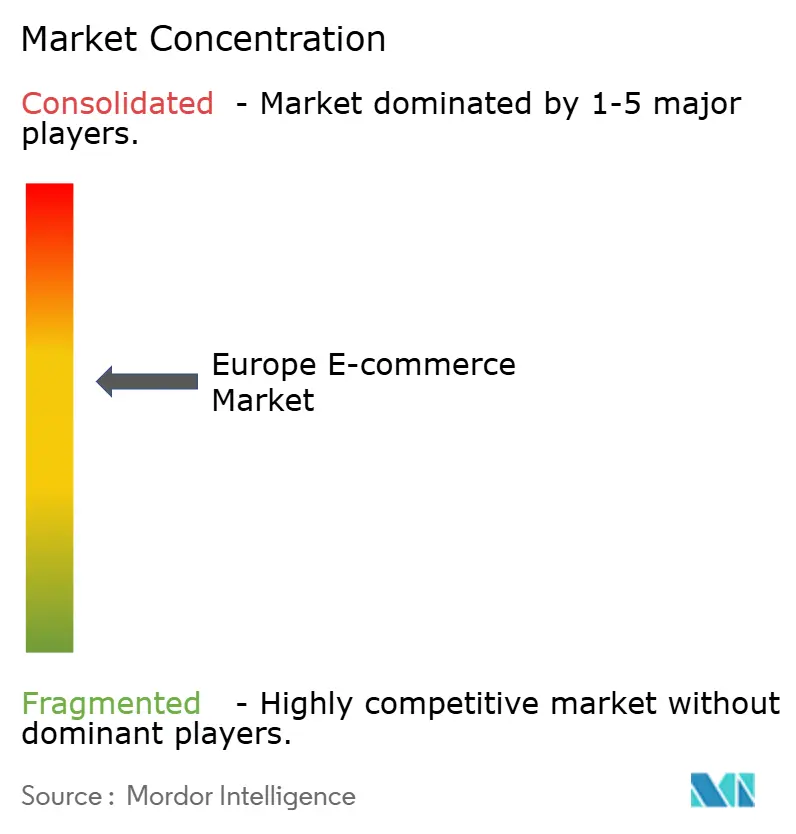
| Market Concentration | Medium |
Major Players *Disclaimer: Major Players sorted in no particular order Image © Mordor Intelligence. Reuse requires attribution under CC BY 4.0. | |
Europe E-commerce Market Analysis by Mordor Intelligence
Europe e-commerce market size in 2026 is estimated at USD 0.73 trillion, growing from 2025 value of USD 0.68 trillion with 2031 projections showing USD 1.07 trillion, growing at 7.86% CAGR over 2026-2031. Expansion reflects the region’s rapid digitalisation and the rise of omnichannel models that combine in-store engagement with online fulfilment. Smartphone penetration underpins 55% of digital purchases, yet the fastest growth now comes from connected devices such as smart TVs and voice assistants at a 12.8% CAGR, signalling a broader shift toward multi-screen shopping. B2C currently drives 80% of revenue, but B2B transactions, encouraged by procurement modernisation and vertical marketplaces, record a faster 10.1% CAGR. Payment habits are also changing: cards still hold 34% market share, but Buy Now Pay Later (BNPL) solutions are expanding sharply and, together with open-banking APIs, smooth the checkout process in high-ticket categories. Finally, European Commission initiatives under the Digital Single Market programme continue to dismantle cross-border frictions, trimming an estimated EUR 400 million (USD 454 million) in yearly administrative costs and creating a more integrated arena for merchants of every size.[1]European Commission, “Bringing Down Barriers to the Single Market to Create Opportunities for All,” commission.europa.eu
Key Report Takeaways
- By business model, the B2C segment held 79.35% of the Europe e-commerce market share in 2025, while B2B is set to expand at a 9.7% CAGR to 2031.
- By device type, smartphones accounted for 54.20% of transactions in 2025; other connected devices are forecast to grow at 12.16% CAGR to 2031.
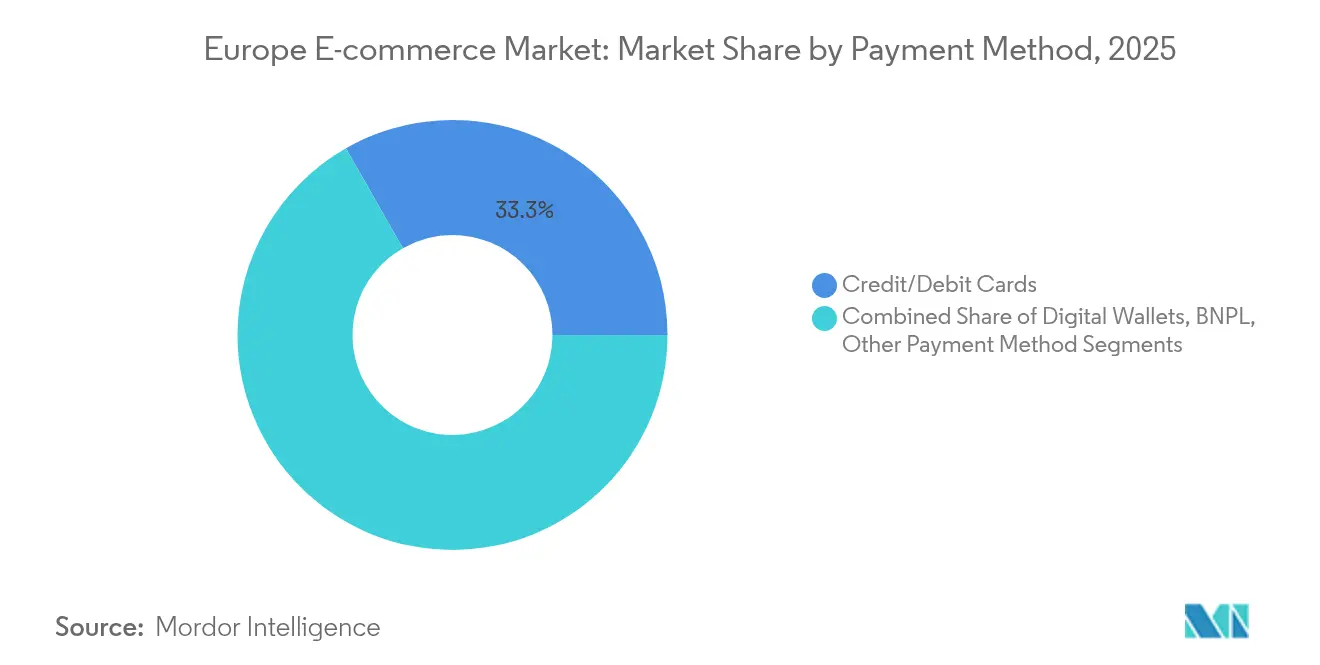
- By payment method, credit and debit cards led with 33.25% revenue share in 2025; BNPL is climbing at a 14.98% CAGR through 2031.
- By B2C product category, fashion and apparel commanded 25.40% share of the Europe e-commerce market size in 2025, while food & beverages is advancing at a 16.6% CAGR through 2031.
- By geography, the United Kingdom led with a 24.60% market share in 2025; the Netherlands shows the fastest trajectory at an 10.7% CAGR to 2031.
Note: Market size and forecast figures in this report are generated using Mordor Intelligence’s proprietary estimation framework, updated with the latest available data and insights as of 2026.
Europe E-commerce Market Trends and Insights
Drivers Impact Analysis*
| Driver | (~) % Impact on CAGR Forecast | Geographic Relevance | Impact Timeline |
|---|---|---|---|
| Acceleration of 3P Marketplaces in Western Europe | +1.5% | Western Europe, with spillover to Central Europe | Medium term (2-4 years) |
| Ultra-Fast Grocery Delivery Boosts Urban Online Food Sales | +1.2% | Urban centers across UK, Germany, France, Netherlands | Short term (≤ 2 years) |
| EU Digital Single Market Facilitates SME Cross-Border Trade | +0.9% | EU member states, with strongest impact in Eastern Europe | Long term (≥ 4 years) |
| BNPL & Open Banking APIs Lift Fashion/Electronics Conversion | +0.7% | UK, Nordics, Germany, France | Medium term (2-4 years) |
| AI-Powered Localization Expands Non-Native Language Markets | +0.6% | Southern and Eastern Europe | Medium term (2-4 years) |
| Re-Commerce Platforms Shorten Electronics Upgrade Cycles | +0.4% | Western Europe, Nordics | Short term (≤ 2 years) |
| Source: Mordor Intelligence | |||
Acceleration of 3P Marketplaces in Western Europe
Third-party marketplaces are reshaping the Europe e-commerce market by increasing brand reach and lowering entry barriers. They are expected to capture 50% of online consumer electronics sales by 2025, up from 40% in 2024. Nearly 79% of European brands now pursue multi-marketplace strategies to lessen dependence on Amazon, with vertical specialists such as fashion platform Zalando holding 9.8% share against Amazon’s 8.3% in cross-border apparel.[2]FashionUnited, “Zalando Leads in Cross-border Commerce,” fashionunited.com Marketplace adoption especially benefits SMEs that lack sizeable marketing budgets, but it increases the need for strong brand positioning and customer-relationship tools. The resulting shift toward niche platforms diversifies consumer choice and intensifies price transparency.
Ultra-Fast Grocery Delivery Boosts Urban Online Food Sales
In dense metropolitan areas, grocery orders fulfilled within 15–30 minutes have elevated the food & beverages segment to the fastest-growing vertical at a 17.3% CAGR. Dedicated urban fulfilment centres reduce delivery distance, and 21% of EU internet users ordered restaurant meals online in 2024, blending grocery and food service habits.[3]European Central Bank, “Study on the Payment Attitudes of Consumers in the Euro Area 2024,” ecb.europa.eu Competition now pits traditional grocers against pure-play delivery specialists, which promotes consolidation while opening premium niches for organic or local products with higher margins. Although fulfilment costs remain high, speed creates customer loyalty that offsets partial delivery expense.
EU Digital Single Market Facilitates SME Cross-Border Trade
Regulatory harmonisation under the Digital Single Market directly lowers compliance expenses and promotes a seamless checkout, logistics, and tax environment across member states. The most recent simplification strategy is set to save EUR 400 million (USD 454 million) in annual paperwork costs, aiming for a 25% overall cut by 2029. Cross-border e-commerce already climbed to EUR 326 billion in 2024, a 39% jump, as smoother customs and VAT rules reduce friction. Eastern European SMEs benefit the most, gaining direct access to higher-value Western markets.
BNPL & Open Banking APIs Lift Fashion/Electronics Conversion
BNPL accounts for 9% of European e-commerce transactions with growth forecast at 15.6% CAGR through 2030. Open-banking APIs further cut checkout time by enabling account-to-account payments that bypass cards, lifting conversion in high-value baskets such as fashion and electronics. French BNPL volume alone is projected to reach USD 18.61 billion by 2030. Forthcoming Consumer Credit Directive 2 rules tighten lending criteria, which may moderate BNPL expansion yet adds long-term sustainability and consumer trust.
Restraints Impact Analysis*
| Restraint | (~) % Impact on CAGR Forecast | Geographic Relevance | Impact Timeline |
|---|---|---|---|
| Last-Mile Cost Inflation in Southern EU Cities Hinders the Market | -0.8% | Southern Europe, particularly Spain and Italy | Medium term (2-4 years) |
| GDPR & DSA Compliance Costs for SMEs Hinders the Market | -0.6% | EU-wide, with disproportionate impact on Eastern Europe | Short term (≤ 2 years) |
| High Apparel Returns Fraud and Reverse-Logistics Burden | -0.5% | UK, Germany, France | Medium term (2-4 years) |
| Fragmented VAT/Eco-Tax Schemes Hit Cross-Border Scale | -0.4% | EU-wide, with particular impact on cross-border sellers | Medium term (2-4 years) |
| Source: Mordor Intelligence | |||
Last-Mile Cost Inflation in Southern EU Cities Hinders the Market
Logistics costs now equal 40–50% of delivery expenditure in Mediterranean cities, eroding retailer margins and challenging free-shipping offers. Dense street grids and congestion raise CO₂ emissions, estimated at 3 million tonnes for courier fleets, prompting regulatory caps on urban traffic. Responses include consolidation centres, peer-to-peer delivery, and pick-up lockers, but capital costs discourage smaller firms and may accelerate market concentration around specialists with scale advantage.
GDPR & DSA Compliance Costs for SMEs Hinders the Market
Since February 2024, the Digital Services Act adds over 30 obligations ranging from content moderation to advertising transparency. Polish merchants alone report billion-euro compliance outlays. Combined with GDPR data-handling standards, the burden absorbs resources otherwise directed toward customer acquisition, slowing SME expansion especially in markets where operational margins are thinner.
*Our forecasts treat driver/restraint impacts as directional, not additive. The impact forecasts reflect baseline growth, mix effects, and variable interactions.
Segment Analysis
By Business Model: B2B Disrupts Traditional Dynamics
The B2C segment retained 79.35% of revenue in 2025, underscoring its historical dominance in the Europe e-commerce market. Yet B2B transactions are forecast to eclipse USD 1.93 trillion by 2026, advancing at a 9.7% CAGR. This trajectory means the Europe e-commerce market size for corporate procurement channels will expand at more than double the overall pace to 2031. Transformation is driven by procurement teams demanding consumer-grade interfaces, prompting 65% of B2B sellers to enable online ordering.
Beyond simple catalogues, B2B platforms now integrate AI-powered product-matching, net-term payment automation, and role-based access that mirrors complex organisational hierarchies. The Europe e-commerce market benefits from vertical marketplaces in industrial supplies and healthcare that streamline fragmented supply chains. As a result, logistics providers build specialised fulfilment networks adapted to pallet-sized orders and compliance labelling, while SaaS vendors roll out purchase-to-pay modules that accelerate invoice reconciliation.


By Device Type: Mobile Dominance Reshapes User Experience
Smartphones processed 54.20% of transactions in 2025 across the Europe e-commerce market, reflecting 87% regional handset penetration. Despite this supremacy, the Europe e-commerce market share for other connected devices is rising, with smart TVs and voice assistants generating sales at a 12.16% CAGR, indicating shoppers welcome in-home, screen-large browsing. The Europe e-commerce market size associated with these emerging devices is expected to double by 2031.
Retailers are therefore adopting responsive architecture and progressive-web-app formats that scale across multiple displays while securing log-in via biometric authentication. Device diversification also affects payments: digital wallets dominate on mobile due to fingerprint or face recognition, whereas account-to-account transfers gain momentum on desktop sessions. Hardware variety obliges merchants to optimise for iOS, Android, and proprietary smart-TV systems, raising QA workloads but expanding reach into new consumption moments such as voice-prompt reorder.
By Payment Method: BNPL Disrupts Traditional Dominance
Credit and debit cards retained 33.25% market share in 2025, yet their share gradually erodes as BNPL adoption grows at 14.98% CAGR. With roughly EUR 90 billion in BNPL volume in 2024, the Europe e-commerce market size attached to instalment schemes will rise sharply, especially in fashion and electronics where ticket prices average higher.
Digital wallets, supported by near-field communication and tokenised credentials, are predicted to grow above 9% annually through 2028. Simultaneously, open-banking transfers compliant with PSD2 standards offer merchants lower interchange fees and instant settlement, enhancing cash flow. Regulation remains dynamic: PSD3 drafts slated for 2027 favour transparent pricing and consumer safeguards, creating both opportunities for new fintech entrants and integration challenges for legacy processors.
By B2C Product Category: Food Revolution Challenges Fashion Dominance
Fashion and apparel held 25.40% share in 2025, but food & beverages now lead growth with a 16.6% CAGR through 2031, a shift amplified by pandemic-induced habituation to online grocery. Consequently, micro-fulfilment centres proliferate, and the Europe e-commerce market size for online grocery is likely to narrow the gap with fashion mid-decade.
Consumer electronics remains significant, climbing from EUR 90 billion in 2023 to an expected EUR 107 billion in 2025. Re-commerce platforms accelerate refurb sales and encourage circular consumption habits. Beauty products leverage subscription replenishment, whereas furniture merchants adopt augmented reality to mitigate size-fit uncertainty. Each segment’s trajectory underscores the diversity of merchandising, logistics, and return-management frameworks necessary to sustain competitive advantage.
Geography Analysis
The United Kingdom commanded 24.60% of the Europe e-commerce market in 2025, supported by 97.25% online shopping penetration and an e-commerce contribution equal to 9.3% of national GDP. Local consumers frequently compare in-store items against online prices, obliging retailers to align assortments and promotional cadence across channels. Mobile-first design is critical since handheld transactions vastly outnumber tablet purchases, and same-day fulfilment options have become a baseline expectation in major cities.
The Netherlands records the highest growth, projected at 10.7% CAGR to 2031, underpinned by 92% digital shopping participation and a logistics network where PostNL handles 60% of parcel flows. Dutch shoppers spent EUR 17.5 billion (USD 18.9 billion) in the first half of 2024 alone, and 55% placed at least one cross-border order, with Chinese platforms capturing 28% of that volume. The dominance of iDEAL account-to-account transfers illustrates how local payment norms influence conversion optimisation.
Germany, France, Spain, and Italy comprise the next tier. Germany’s online channel represents 17% of retail, and consumers exhibit low tolerance for delayed shipments or complex return processes. France surpassed EUR 175 billion (USD 188 billion) in online revenue during 2024, propelled by luxury goods that lift average basket values. Southern Europe accelerates from smaller bases: Spain drives digitalisation via national grants, and Italy sees swift mobile adoption outpacing desktop. Nordic markets remain mature with Denmark at 89% and Norway at 91% shopper participation, channelled toward sustainable and locally-produced merchandise.
Competitive Landscape
European e-commerce competition blends horizontally dominant marketplaces with fragmented vertical specialists. Amazon retains leadership in general merchandise, yet 79% of brands are diversifying beyond the platform in 2025 to protect margins. This pivot opens opportunity for category-specific leaders: Zalando wields 9.8% share of cross-border fashion against Amazon’s 8.3%. In home improvement, ManoMano scales beyond France, while Vinted dominates fashion re-commerce across Central and Eastern Europe.
Circular economy models grow notably: refurbished electronics are expected to reach 11% of online consumer electronics turnover by 2025, with players like Swappie leveraging certified refurbishment and extended warranty propositions to build credibility. Quick-commerce firms such as Flink expand in urban hubs, aiming to capture convenience-oriented grocery missions. Competitive tactics increasingly turn to AI-powered personalisation, granular localisation, and white-label fulfilment services that help merchants differentiate outside dominant portals. Strategic partnerships between retailers and logistics specialists intensify, enabling smaller brands to access next-day or even same-day networks without owning infrastructure.
Europe E-commerce Industry Leaders
Amazon.com, Inc.
eBay Inc.
Zalando SE
Allegro.eu SA
Alibaba Group Holding Ltd. (AliExpress)
- *Disclaimer: Major Players sorted in no particular order

Recent Industry Developments
- May 2025: The European Commission unveiled a Single Market Simplification Strategy expected to cut EUR 400 million (USD 454 million) in annual paperwork costs, directly supporting SME cross-border scaling.
- May 2025: Amazon’s Q1 results highlighted beauty vertical dominance, with 42% of Italian online beauty shoppers buying exclusively on Amazon; the company signals continued investment in high-margin categories to offset logistics costs.
- April 2025: The Commission published a toolbox addressing safety issues tied to low-value imports, proposing withdrawal of duty exemptions to protect EU sellers from price undercutting.
- March 2025: Allegro reported nearly EUR 3 billion (USD 3.25 billion) in sales, showcasing regional platforms’ capacity to challenge global giants by targeting local language and payment preferences.


Europe E-commerce Market Report Scope
E-commerce is the purchasing and selling of products and services over the Internet. It is conducted over computers, mobiles, tablets, and other smart devices. There are primarily two e-commerce types: Business-to-Consumer (B2C) and Business-to-Business (B2B).
The European e-commerce market is segmented by b2c e-commerce (beauty and personal care, consumer electronics, fashion and apparel, food and beverage, furniture and home), b2b e-commerce, and country(United Kingdom, Germany, France, Spain, Italy, Nordics, Rest of Europe [Eastern Europe, Benelux]). The market sizes and forecasts are provided in terms of value (USD) for all the above segments.
By Business Model
| B2C |
| B2B |
By Device Type
| Smartphone / Mobile |
| Desktop and Laptop |
| Other Device Types |
By Payment Method
| Credit / Debit Cards |
| Digital Wallets |
| BNPL |
| Other Payment Method |
By B2C Product Category
| Beauty and Personal Care |
| Consumer Electronics |
| Fashion and Apparel |
| Food and Beverages |
| Furniture and Home |
| Toys, DIY and Media |
| Other Product Categories |
By Country
| United Kingdom |
| Germany |
| France |
| Spain |
| Italy |
| Netherlands |
| Nordics |
| Rest of Europe |
| By Business Model | B2C |
| B2B | |
| By Device Type | Smartphone / Mobile |
| Desktop and Laptop | |
| Other Device Types | |
| By Payment Method | Credit / Debit Cards |
| Digital Wallets | |
| BNPL | |
| Other Payment Method | |
| By B2C Product Category | Beauty and Personal Care |
| Consumer Electronics | |
| Fashion and Apparel | |
| Food and Beverages | |
| Furniture and Home | |
| Toys, DIY and Media | |
| Other Product Categories | |
| By Country | United Kingdom |
| Germany | |
| France | |
| Spain | |
| Italy | |
| Netherlands | |
| Nordics | |
| Rest of Europe |


Key Questions Answered in the Report
What is the current size of the Europe e-commerce market?
The market stands at USD 0.73 trillion in 2026.
How fast is the Europe e-commerce market expected to grow?
Forecasts point to an 7.86% CAGR, driving revenue to USD 1.07 trillion by 2031.
Which product category is expanding the quickest online?
Food & beverages leads with a 16.6% CAGR through 2031, supported by ultra-fast grocery delivery.
Why are brands diversifying away from Amazon in Europe?
About 79% of brands seek multi-marketplace exposure to protect margins and maintain direct customer relationships.
How does BNPL influence European online sales?
BNPL already covers 9% of transactions and is growing at 14.98% CAGR, especially boosting conversion in fashion and electronics.
Which country posts the highest e-commerce growth in Europe?
The Netherlands shows the fastest trajectory at an 10.7% CAGR driven by high logistics efficiency and digital-payment adoption.
Page last updated on:


