Market Overview
| Study Period | 2020 - 2031 |
|---|---|
| Forecast Data Period | 2026 - 2031 |
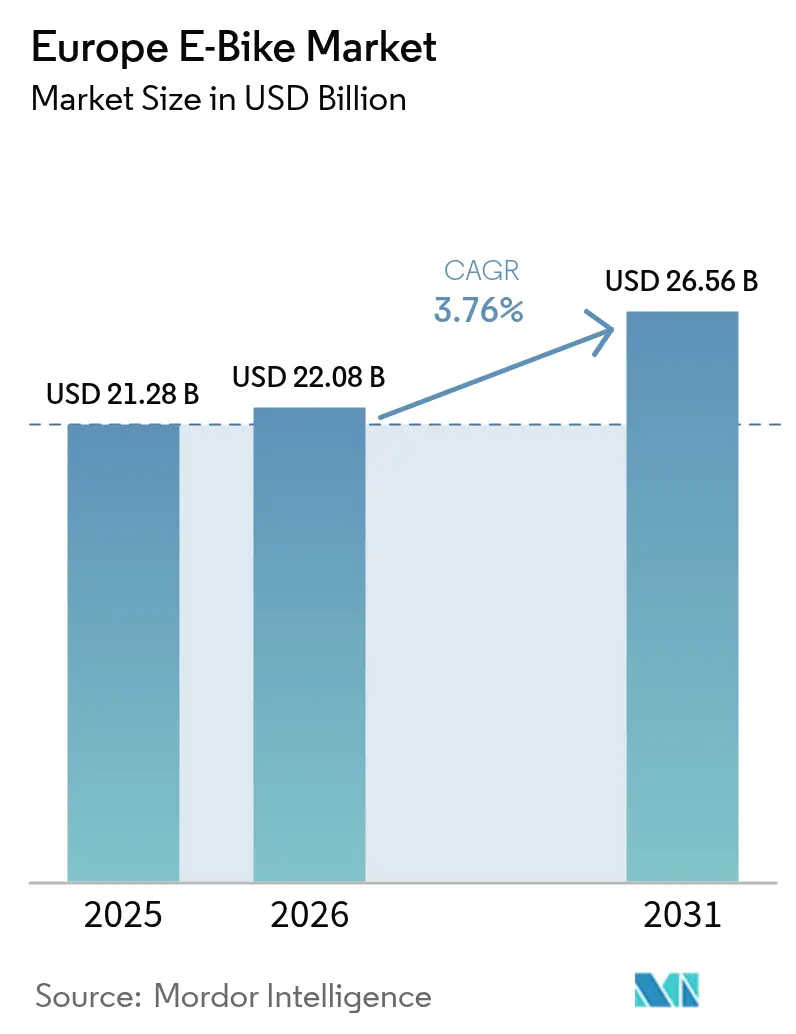
| Base Year Market Size (2025) | USD 21.28 Billion |
| Market Size (2026) | USD 22.08 Billion |
| Market Size (2031) | USD 26.56 Billion |
| Growth Rate (2026 - 2031) | 3.76% CAGR |
| Market Concentration | Medium |
Major Players *Disclaimer: Major Players sorted in no particular order Image © Mordor Intelligence. Reuse requires attribution under CC BY 4.0. | |
Europe E-Bike Market Analysis by Mordor Intelligence
The European e-bike market size is expected to grow from USD 21.28 billion in 2025 to USD 22.08 billion in 2026 and is forecast to reach USD 26.56 billion by 2031 at 3.76% CAGR over 2026-2031. Healthy underlying demand from corporate fleets, last-mile logistics, and commuter substitution offsets the post-pandemic inventory correction. Expansion of protected cycle networks, the five-year extension of anti-dumping duties on Chinese e-bikes, and battery technology upgrades collectively sustain pricing power and shield margins. Leasing models that convert large one-time purchases into predictable operating expenses accelerate penetration among employers, while localized EU manufacturing mitigates tariff risk and shortens lead times. Gradual regulatory alignment on speed-pedelecs, combined with solid-state micro-battery breakthroughs, is expected to widen the total addressable base for higher-performance models.
Key Report Takeaways
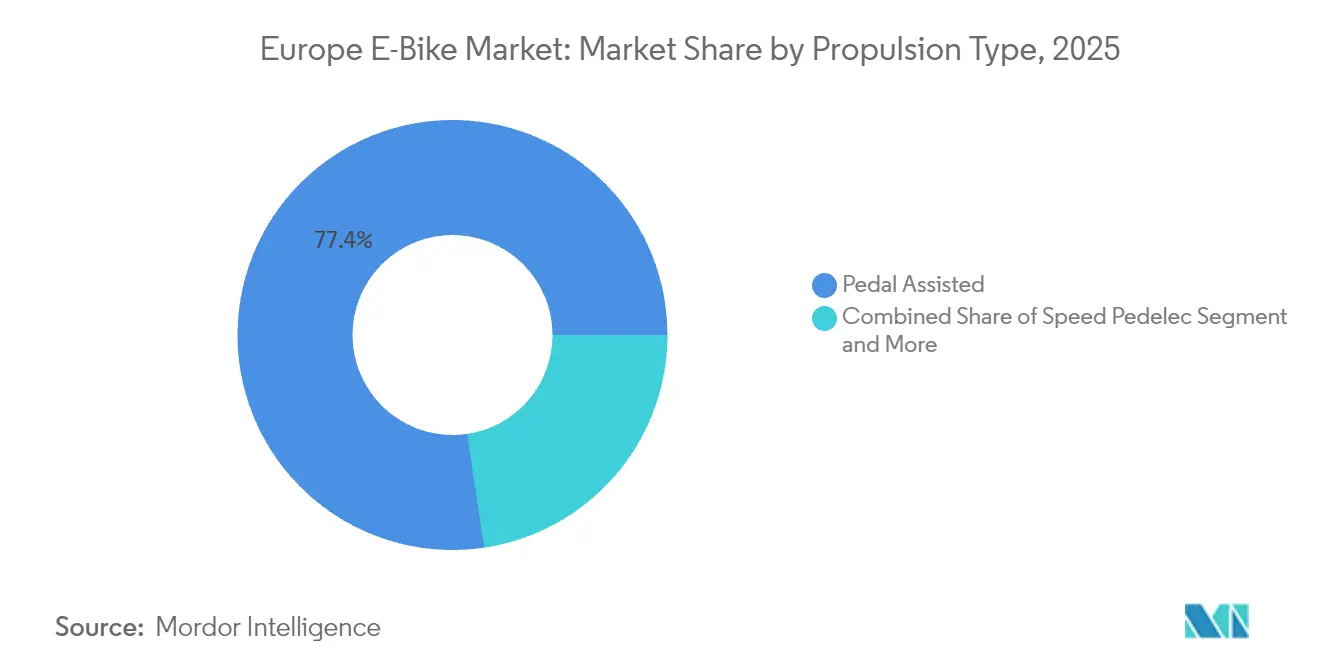
- By propulsion type, pedal-assisted models captured 77.35% of the Europe e-bike maket share in 2025; speed-pedelecs are projected to grow at a 3.88% CAGR to 2031.
- By application type, city/urban riding accounted for a 73.62% of the Europe e-bike maket share in 2025, whereas cargo/utility is advancing at a 3.84% CAGR through 2031.
- By battery type, lithium-ion held 99.86% of the European e-bike market share in 2025 and is expanding in line with the overall market at 3.76% CAGR.
- By motor placement, mid-drive systems secured 63.45% of the Europe e-bike maket share in 2025 and are scaling at a 4.43% CAGR to 2031.
- By drive system, chain drives commanded 71.48% of the Europe e-bike maket share in 2025, with belt drives pacing growth at a 5.54% CAGR.
- By motor power, below 250 W units held 46.62% of the Europe e-bike maket share in 2025, and 351-500 W units are rising at a 4.97% CAGR.
- By price band, USD 1,500-2,499 remained leading at 30.84% of the Europe e-bike maket share in 2025, while the USD 2,500-3,499 segment captured the highest growth at 4.74% CAGR.
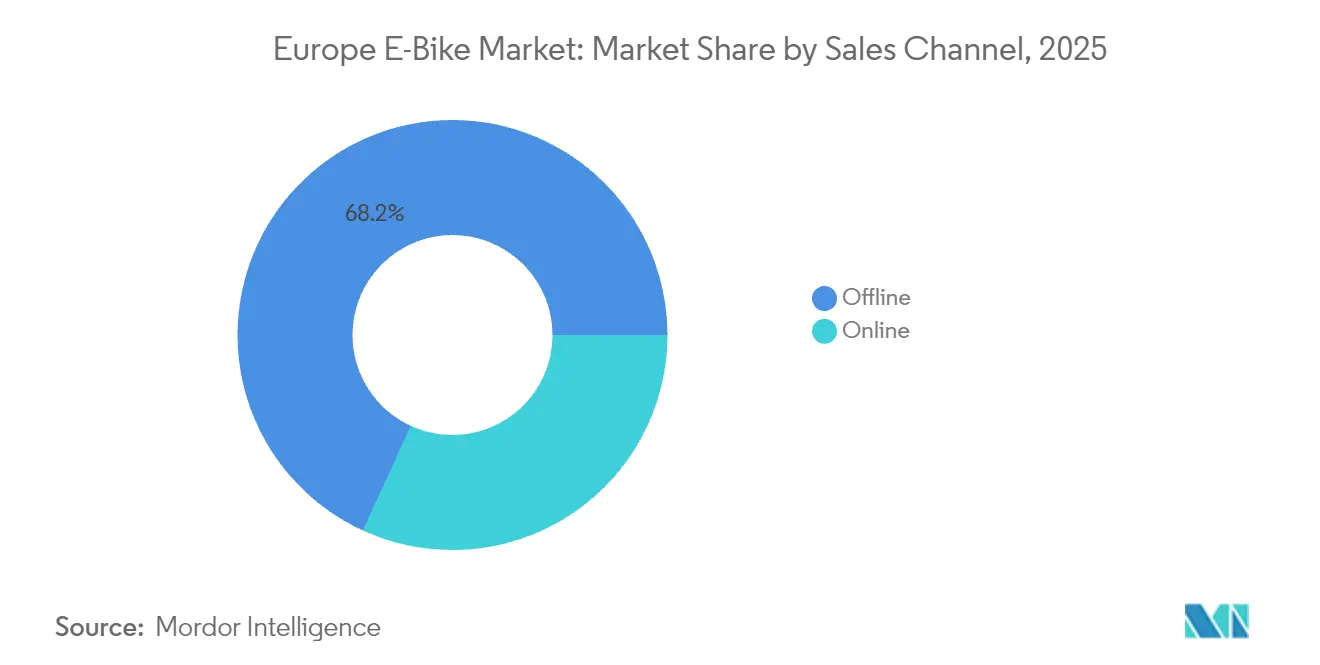
- By sales channel, offline stores retained 68.15% of the Europe e-bike maket share in 2025; online direct-to-consumer is accelerating at 6.66% CAGR.
- By end use, personal and family riding led with 52.47% of the Europe e-bike maket share in 2025; commercial delivery is the fastest-growing at 6.08% CAGR.
- By country, Germany’s led 42.18% of the Europe e-bike maket share in 2025, whereas Poland is anticipated to grow at 7.03% CAGR by 2031.
Note: Market size and forecast figures in this report are generated using Mordor Intelligence’s proprietary estimation framework, updated with the latest available data and insights as of 2026.
Europe E-Bike Market Trends and Insights
Drivers Impact Analysis*
| Driver | (~) % Impact on CAGR Forecast | Geographic Relevance | Impact Timeline |
|---|---|---|---|
| Corporate Bike-Leasing Boom | +0.9% | Germany, Netherlands, Belgium, France | Short term (≤ 2 years) |
| Purchase Subsidies and Tax Incentives | +0.8% | France, Netherlands, Germany, Belgium | Medium term (2-4 years) |
| Growth of Last-Mile E-Cargo Fleets | +0.7% | Urban EU and the United Kingdom | Medium term (2-4 years) |
| Protected Bicycle-Lane Expansion | +0.6% | Major EU cities | Long term (≥ 4 years) |
| Regionalized EU Manufacturing Shift | +0.5% | Bulgaria, Czech Republic, Portugal | Long term (≥ 4 years) |
| Solid-State Micro-Battery Advances | +0.4% | Germany, Switzerland, Netherlands | Long term (≥ 4 years) |
| Source: Mordor Intelligence | |||


Corporate Bike-Leasing Boom
Tax-advantaged leasing turns e-bikes into employee benefits rather than discretionary buys. Payroll deductions cut effective outlay by 30-50% and open premium tiers without sticker shock. Fleets give OEMs volume visibility, enabling just-in-time production and lower inventory risk. Platforms like NAVIT unify cross-border HR rules, accelerating rollouts in France and the Netherlands under tight labor markets.
Purchase Subsidies and Tax Incentives
Generous national and municipal incentives compress effective prices and pull demand forward. France still grants up to EUR 4,000 (~USD 4,646) per unit, the Netherlands lets employers depreciate e-bike costs, and Belgium couples payroll credits with leases, slicing significant savings from sticker prices. Because renewals follow predictable cycles, manufacturers time production runs to subsidy windows, smoothing inventories and protecting mid-range volume tiers. These measures sustain growth.
Growth of Last-Mile E-Cargo Fleets
Logistics providers switch to e-cargo bikes to beat congestion and emission tolls. DHL, Amazon, and UPS run fleets in several cities, and courier Urb-it partners with retailers for zero-emission drops. Economics favor parcels under 30 kg within 10 km, cutting cost per stop by up to 25% and avoiding parking fines. Commercial buyers pay 40-60% premiums, boosting OEM margins and ensuring predictable scaling.
Protected Bicycle-Lane Expansion
Massive investment in separated corridors makes e-bikes safer and faster for daily trips. Since 2020, Paris has added more than 1,000 km of protected lanes, Madrid has built several new corridors in 2024, and Spain has budgeted significant investment for 8,000 km by 2030. Cities with at least 15 km of lanes per 100,000 residents hold adoption rates 40% above peers. Infrastructure converts occasional riders into habitual commuters, multiplying subsidy impact and reducing perceived weather and traffic risk.
Restraints Impact Analysis*
| Restraint | (~) % Impact on CAGR Forecast | Geographic Relevance | Impact Timeline |
|---|---|---|---|
| High upfront cost vs acoustic bikes | -0.6% | Price-sensitive EU markets | Short term (≤ 2 years) |
| Dealer inventory write-downs | -0.5% | Germany, Netherlands | Short term (≤ 2 years) |
| Speed-pedelec regulatory grey-zones | -0.4% | Cross-border EU | Medium term (2-4 years) |
| Tariff volatility on Chinese inputs | -0.3% | Import-dependent EU | Medium term (2-4 years) |
| Source: Mordor Intelligence | |||
High Upfront Cost vs Acoustic Bikes
Average prices are significantly higher, commanding a substantial premium over conventional bicycles. Even after a German price retreat, entry models rarely dip, while high battery replacements add lifetime expense. Eastern European households, with lower median wages, feel the gap most, slowing mainstream adoption despite better infrastructure. Financing helps, yet cultural resistance to consumer credit leaves many buyers waiting for price cuts or income growth.
Dealer Inventory Write-Downs
Pandemic overordering left showrooms packed with unsold stock, triggering steep markdowns and bankruptcies at VanMoof and Prophete. Roland Berger labeled the sector in “crisis mode,” and German chains slashed significant orders, depriving OEMs of display space. Dealers facing negative cash flow delay new-model commitments and defer showroom upgrades essential for premium bikes. Brands pivot to direct-to-consumer and corporate leasing, but this transition raises logistics costs and dilutes local service during the crucial after-sales phase.
*Our forecasts treat driver/restraint impacts as directional, not additive. The impact forecasts reflect baseline growth, mix effects, and variable interactions.
Segment Analysis
By Propulsion Type: Speed Pedelecs Gain Momentum
The European e-bike market size for pedal-assist propulsion accounted for 77.35% share in 2025. Pedal-assist thrives on regulatory simplicity and a familiar ride feel, anchoring commuter and leisure volumes. Speed-pedelecs outpaced all categories at 3.88% CAGR, leveraging commuter appetite for 45 km/h capability and fleet demand for quicker deliveries.
Regulatory convergence remains the swing factor: draft EU proposals aiming to synchronize helmet and path-access rules could unlock scale manufacturing and lower unit costs. Riese & Müller’s forthcoming Pinion-equipped models reflect OEM bets on premium speed-pedelec expansion . As insurance products mature and infrastructure adapts, the propulsion mix is likely to tilt gradually toward higher-power classes.


By Application Type: Cargo Utility Redefines Urban Trips
City/urban commuting generated 73.62% of the European e-bike market share in 2025, because e-bikes excel on sub-10 km trips where parking scarcity and congestion charges penalize cars. Cargo/utility formats, purpose-built with long racks or boxes, expand at a 3.84% CAGR as retailers, couriers, and young families replace second cars. Family cargo variants with dual-child seating broaden the appeal beyond couriers, substituting short car trips and capturing sustainability-minded parents. OEMs redesign frames for 200 kg payloads without exceeding 250 W legal limits, further blurring lines between personal and commercial use.
Trekking and mountain bikes command premium ASPs through rugged frames, dual batteries, and high-torque motors, but remain limited by discretionary budgets and seasonal weather. Municipal climate plans and last-mile contracts tilt R&D toward payload optimization, regenerative braking, and modular accessories that transform bikes from leisure gear into professional equipment.
By Battery Type: Lithium-Ion Near Saturation
Lithium-ion holds 99.86% of the European e-bike market share in 2025, anchoring market size through cost erosion and energy-density gains. Continuous chemistry tweaks, shift toward nickel-manganese-cobalt blends or LFP for cost stability, drive incremental 3.76% CAGR, mirroring total market.
Lead-acid survives only in replacement sales and ultra-budget imports. Pilot fleets with lithium-carbon or semi-solid packs promise 15-20% faster charging and better low-temperature resilience. Until solid-state gigafactories scale, incremental gains in housing design, BMS algorithms, and recycled-content cathodes will lengthen warranties and lift resale values, keeping lithium-ion unchallenged during the forecast window.
By Motor Placement: Mid-Drive Enhances Handling
Mid-drive assemblies comprised 63.45% of the European e-bike market share in 2025 and topped growth at 4.43% CAGR. Superior torque transfer through the chain or belt improves hill climbing while keeping weight centralized, a priority for both commuters and cargo operators. Mid-drive systems are growing due to centered weight distribution, gearbox linkage, and superior hill-climb torque that mimics acoustic cycling.
Hub motors persist in entry tiers and retrofit kits, offering lower MSRP and simpler maintenance but sacrificing efficiency on gradients. Bosch’s Performance Line CX and Yamaha’s PW-X3 exemplify the race for torque density and software-based pedal sensing. As cargo and trekking bikes proliferate, OEMs gravitate toward mid-drive to manage heavy loads and rugged terrain, reinforcing accessory compatibility and specialized service networks.

By Drive System: Belt Drives Challenge Chains
Chains still dominate at 71.48% of the European e-bike market share in 2025 due to ubiquitous servicing. Yet belt drives clocked a 5.54% CAGR, favored for grease-free, low-noise commuting and 10,000 km intervals that attract commuters and fleet managers. Lease platforms embrace belt drives to minimize fleet maintenance, pushing OEMs to bundle internally geared hubs and carbon belts in city models.
Higher upfront prices are increasingly offset through leases that monetize lower maintenance. Integration with internally geared hubs and automatic CVTs removes derailleur wear, making belts viable for torque-heavy cargo bikes and enhancing total cost of ownership economics. Gates’ new wider-tooth profile claims significant stiffness gains, addressing past torque-slip complaints and supporting cargo bike loads.
By Motor Power: Higher-Output Segments Accelerate
Sub-250 W units still occupy 46.62% of the European e-bike market share in 2025, reflecting EU legal caps. Nevertheless, the 351-500 W tier expands at 4.97% CAGR as cargo and speed-pedelec users demand brisk acceleration without moped registration. Ongoing policy debates on raising the 25 km/h limit for professional delivery riders could expand this mid-power tier without encroaching on moped regulation.
Above-600 W systems remain niche due to battery drain and homologation complexity. Firmware advances let 250 W motors feel punchier, but regulatory debates on raising power ceilings could reconfigure shares after 2027, especially if professional delivery riders secure exemptions.
By Price Band: Mid-Range Sweet Spot
USD 1,500-2,499 models secured a 30.84% of the European e-bike market share in 2025, by balancing quality and affordability. Promotions and subsidies continue to funnel first-time buyers into this bracket, while USD 2,500-3,499 units see a superior 4.74% CAGR on stronger component specs. German channel discounting compressed entry-level pricing, yet leasing keeps premium tiers buoyant, with average corporate lease values.
The USD 2,500-3,499 tier shows a positive growth trajectory as buyers trade up for belt drives, larger displays, and GPS locks. Ultra-premium bikes above USD 6,000 hold a small yet profitable niche among car replacers and alpine adventurers, while sub-USD 1,000 imports struggle against duty walls and limited warranties.
By Sales Channel: Digital Share Climbs
Brick-and-mortar stores (offline) accounted for 68.15% of the European e-bike market share in 2025, leveraging test rides, ergonomic fitting, and bundled service. Pure e-commerce and click-and-collect, however, rise at 6.66% CAGR as sizing tools, free returns, and next-day delivery normalize high-ticket online buys.
Canyon’s model shows that assembly videos and regional service partners can offset remote-buy anxieties. Brands hurt by dealer overstock push direct sites to capture margin, while omnichannel pilots pay shops commissions for demos even when carts close online, aligning interests across the ecosystem.
By End Use: Commercial Delivery Leads Growth
Personal and family riding leads with 52.47% of the European e-bike market share in 2025, fueled by commuters cutting car costs and leisure cyclists extending weekend routes. Commercial delivery’s 6.08% CAGR is the market’s most disruptive force, as parcel firms exploit bike-lane access and zero-emission zones to trim last-mile expenses.
Institutional fleets police, campuses, tourist rentals supply steady volumes that buffer seasonality. Consumer models emphasize anti-theft batteries and smartphone integration, whereas courier bikes prioritize 200 kg payload frames, puncture-resistant tires, and telematics. City logistics regulations now co-fund cargo trials, accelerating professional uptake beyond the pilot stage.
Geography Analysis
Western Europe contributed a significant share in 2025, led by Germany’s 42.18% share, supported by several employer leasing schemes. The Netherlands leverages 37,000 km of cycle paths to sustain a notable e-bike sales mix, demonstrating usage maturity that now revolves around replacement cycles and premium upgrades. France’s subsidy of up to EUR 4,000 (~USD 4,646) has driven significant adoption in lower-income regions, while Italy focuses on urban mobility credits to spur penetration.
Poland is the clear outperformer, racing ahead at 7.03% CAGR after launching PLN 5,000 (~USD 1,365) rebates and accelerating path construction in Warsaw and Kraków. Czech and Portuguese manufacturing clusters feed local demand and create export hubs that shorten replenishment lead times, boosting retailer confidence. Nordic markets—Denmark, Sweden, and Norway—combine environmental policies with resilient disposable incomes, supporting ASPs above the European mean. The United Kingdom, operating outside EU trade policy, is reviewing lifting anti-dumping tariffs, which could reopen Asian supply pipelines and alter competitive pricing. Switzerland and Austria maintain a niche status as high-end speed-pedelec territories that benefit from mountainous terrain that values torque and range.
Competitive Landscape
The field remains moderately fragmented. Accell Group’s 2024 debt write-down from EUR 1.4 billion (~USD 1.6 billion) to EUR 800 million (~USD 929 million) stabilized operations and signaled broader balance-sheet repairs across legacy brands [3]“FY2024 Restructuring Statement,” Accell Group, accell-group.com. Pon Bike expands via Kalkhoff and Gazelle, integrating proprietary motors to de-risk Bosch dependency, while Giant pursues European assembly to bypass tariffs.
Premium specialists such as Riese & Müller and Stromer focus on connected features—GPS tracking, over-the-air firmware—raising switching costs. Asian entrants face 10-70% duties yet compete in online channels with aggressive pricing. Emerging B2B fleet platforms, exemplified by Cooltra and Green Mobility Holding, forge OEM alliances for purpose-built cargo bikes, potentially shifting purchasing power from retailers to fleet operators.
Strategic initiatives include vertical integration, European component sourcing, and subscription models that bundle insurance and service. As inventory pressures persist, consolidation waves are likely in distributor networks, but technology differentiation and localized manufacturing keep barriers viable for innovators.
Europe E-Bike Industry Leaders
Pon Holdings B.V.
Accell Group
Giant Manufacturing Co. Ltd.
Trek Bicycle Corporation
Riese & Müller GmbH
- *Disclaimer: Major Players sorted in no particular order

Recent Industry Developments
- June 2025: Cooltra unveiled the Cooltra One, its first in-house e-bike tailored for delivery fleets, launching 330 units in Germany and the Netherlands.
- April 2025: Ampler introduced the Nova line of e-bikes with USB-C charging, signaling broader adoption of universal connectors.
- January 2025: The European Commission prolonged anti-dumping and countervailing duties on Chinese e-bike imports for five more years, reinforcing regional manufacturing.
- July 2024: Green Mobility Holding acquired Belgian e-bike leasing firm Ubike, expanding its footprint in French-speaking regions.


Europe E-Bike Market Report Scope
By Propulsion Type
| Pedal Assisted |
| Speed Pedelec |
| Throttle Assisted |
By Application Type
| Cargo / Utility |
| City / Urban |
| Trekking / Mountain |
By Battery Type
| Lead-Acid Battery |
| Lithium-ion Battery |
| Others |
By Motor Placement
| Hub (Front / Rear) |
| Mid-Drive |
By Drive Systems
| Chain Drive |
| Belt Drive |
By Motor Power
| Below 250 W |
| 251-350 W |
| 351-500 W |
| 501-600 W |
| Above 600 W |
By Price Band
| Less than/Equals USD 1,000 |
| USD 1,000-1,499 |
| USD 1,500-2,499 |
| USD 2,500-3,499 |
| USD 3,500-5,999 |
| Greater than/Equals USD 6,000 |
By Sales Channel
| Online |
| Offline |
By End Use
| Commercial Delivery | Retail and Goods Delivery |
| Food and Beverage Delivery | |
| Service Providers | |
| Personal and Family Use | |
| Institutional | |
| Others |
By Country
| Germany |
| Netherlands |
| France |
| Italy |
| Spain |
| United Kingdom |
| Switzerland |
| Austria |
| Belgium |
| Denmark |
| Sweden |
| Norway |
| Poland |
| Czech Republic |
| Portugal |
| Rest of Europe |
| By Propulsion Type | Pedal Assisted | |
| Speed Pedelec | ||
| Throttle Assisted | ||
| By Application Type | Cargo / Utility | |
| City / Urban | ||
| Trekking / Mountain | ||
| By Battery Type | Lead-Acid Battery | |
| Lithium-ion Battery | ||
| Others | ||
| By Motor Placement | Hub (Front / Rear) | |
| Mid-Drive | ||
| By Drive Systems | Chain Drive | |
| Belt Drive | ||
| By Motor Power | Below 250 W | |
| 251-350 W | ||
| 351-500 W | ||
| 501-600 W | ||
| Above 600 W | ||
| By Price Band | Less than/Equals USD 1,000 | |
| USD 1,000-1,499 | ||
| USD 1,500-2,499 | ||
| USD 2,500-3,499 | ||
| USD 3,500-5,999 | ||
| Greater than/Equals USD 6,000 | ||
| By Sales Channel | Online | |
| Offline | ||
| By End Use | Commercial Delivery | Retail and Goods Delivery |
| Food and Beverage Delivery | ||
| Service Providers | ||
| Personal and Family Use | ||
| Institutional | ||
| Others | ||
| By Country | Germany | |
| Netherlands | ||
| France | ||
| Italy | ||
| Spain | ||
| United Kingdom | ||
| Switzerland | ||
| Austria | ||
| Belgium | ||
| Denmark | ||
| Sweden | ||
| Norway | ||
| Poland | ||
| Czech Republic | ||
| Portugal | ||
| Rest of Europe | ||


Market Definition
- By Application Type - E-bikes considered under this segment include city/urban, trekking, and cargo/utility e-bikes. The common types of e-bikes under these three categories include off-road/hybrid, kids, ladies/gents, cross, MTB, folding, fat tire, and sports e-bike.
- By Battery Type - This segment includes lithium-ion batteries, lead-acid batteries, and other battery types. The other battery type category includes nickel-metal hydroxide (NiMH), silicon, and lithium-polymer batteries.
- By Propulsion Type - E-bikes considered under this segment include pedal-assisted e-bikes, throttle-assisted e-bikes, and speed pedelec. While the speed limit of pedal and throttle-assisted e-bikes is usually 25 km/h, the speed limit of speed pedelec is generally 45 km/h (28 mph).
| Keyword | Definition |
|---|---|
| Pedal Assisted | Pedal-assist or pedelec category refers to the electric bikes that provide limited power assistance through torque-assist system and do not have throttle for varying the speed. The power from the motor gets activated upon pedaling in these bikes and reduces human efforts. |
| Throttle Assisted | Throttle-based e-bikes are equipped with the throttle assistance grip, installed on the handlebar, similarly to motorbikes. The speed can be controlled by twisting the throttle directly without the need to pedal. The throttle response directly provides power to the motor installed in the bicycles and speeds up the vehicle without paddling. |
| Speed Pedelec | Speed pedelec is e-bikes similar to pedal-assist e-bikes as they do not have throttle functionality. However, these e-bikes are integrated with an electric motor which delivers power of approximately 500 W and more. The speed limit of such e-bikes is generally 45 km/h (28 mph) in most of the countries. |
| City/Urban | The city or urban e-bikes are designed with daily commuting standards and functions to be operated within the city and urban areas. The bicycles include various features and specifications such as comfortable seats, sit upright riding posture, tires for easy grip and comfortable ride, etc. |
| Trekking | Trekking and mountain bikes are special types of e-bikes that are designed for special purposes considering the robust and rough usage of the vehicles. These bicycles include a strong frame, and wide tires for better and advanced grip and are also equipped with various gear mechanisms which can be used while riding in different terrains, rough grounded, and tough mountainous roads. |
| Cargo/Utility | The e-cargo or utility e-bikes are designed to carry various types of cargo and packages for shorter distances such as within urban areas. These bikes are usually owned by local businesses and delivery partners to deliver packages and parcels at very low operational costs. |
| Lithium-ion Battery | A Li-ion battery is a rechargeable battery, which uses lithium and carbon as its constituent materials. The Li-Ion batteries have a higher density and lesser weight than sealed lead acid batteries and provide the rider with more range per charge than other types of batteries. |
| Lead Acid Battery | A lead acid battery refers to sealed lead acid battery having a very low energy-to-weight and energy-to-volume ratio. The battery can produce high surge currents, owing to its relatively high power-to-weight ratio as compared to other rechargeable batteries. |
| Other Batteries | This includes electric bikes using nickel–metal hydroxide (NiMH), silicon, and lithium-polymer batteries. |
| Business-to-Business (B2B) | The sales of e-bikes to business customers such as urban fleet and logistics company, rental/sharing operators, last-mile fleet operators, and corporate fleet operators are considered under this category. |
| Business-to-Customers (B2C) | The sales of electric scooters and motorcycles to direct consumers is considered under this category. The consumers acquire these vehicles either directly from manufacturers or from other distributers and dealers through online and offline channel. |
| Unorganized Local OEMs | These players are small local manufacturers and assemblers of e-bikes. Most of these manufacturers import the components from China and Taiwan and assemble them locally. They offer the product at low cost in this price sensitive market which give them advantage over organized manufacturers. |
| Battery-as-a-Service | A business model in which the battery of an EV can be rented from a service provider or swapped with another battery when it runs out of charge |
| Dockless e-Bikes | Electric bikes that have self-locking mechanisms and a GPS tracking facility with an average top speed of around 15mph. These are mainly used by bike-sharing companies such as Bird, Lime, and Spin. |
| Electric Vehicle | A vehicle which uses one or more electric motors for propulsion. Includes cars, scooters, buses, trucks, motorcycles, and boats. This term includes all-electric vehicles and hybrid electric vehicles |
| Plug-in EV | An electric vehicle that can be externally charged and generally includes all-electric vehicles as well as plug-in hybrids. In this report we use the term for all-electric vehicles to differentiate them from plug-in hybrid electric vehicles. |
| Lithium-Sulphur Battery | A rechargeable battery that replaces the liquid or polymer electrolyte found in current lithium-ion batteries with sulfur. They have more capacity than Li-ion batteries. |
| Micromobility | Micromobility is one of the many modes of transport involving very-light-duty vehicles to travel short distances. These means of transportation include bikes, e-scooters, e-bikes, mopeds, and scooters. Such vehicles are used on a sharing basis for covering short distances, usually five miles or less. |
| Low Speed Electric Vehicls (LSEVs) | They are low speed (usually less than 25 kmph) light vehicles that do not have an internal combustion engine, and solely use electric energy for propulsion. |


Research Methodology
Mordor Intelligence follows a four-step methodology in all its reports.
- Step-1: Identify Key Variables: To build a robust forecasting methodology, the variables and factors identified in Step-1 are tested against available historical market numbers. Through an iterative process, the variables required for market forecast are set and the model is built based on these variables.
- Step-2: Build a Market Model: Market-size estimations for the historical and forecast years have been provided in revenue and volume terms. Market revenue is calculated by multiplying the volume demand with volume-weighted average battery pack price (per kWh). Battery pack price estimation and forecast takes into account various factors affecting ASP, such as inflation rates, market demand shifts, production costs, technological developments, and consumer preferences, providing estimations for both historical data and future trends.
- Step-3: Validate and Finalize: In this important step, all market numbers, variables, and analyst calls are validated through an extensive network of primary research experts from the market studied. The respondents are selected across levels and functions to generate a holistic picture of the market studied.
- Step-4: Research Outputs: Syndicated Reports, Custom Consulting Assignments, Databases & Subscription Platforms


