Europe Data Center Water Consumption Market Size and Share
Market Overview
| Study Period | 2020 - 2031 |
|---|---|
| Forecast Data Period | 2026 - 2031 |
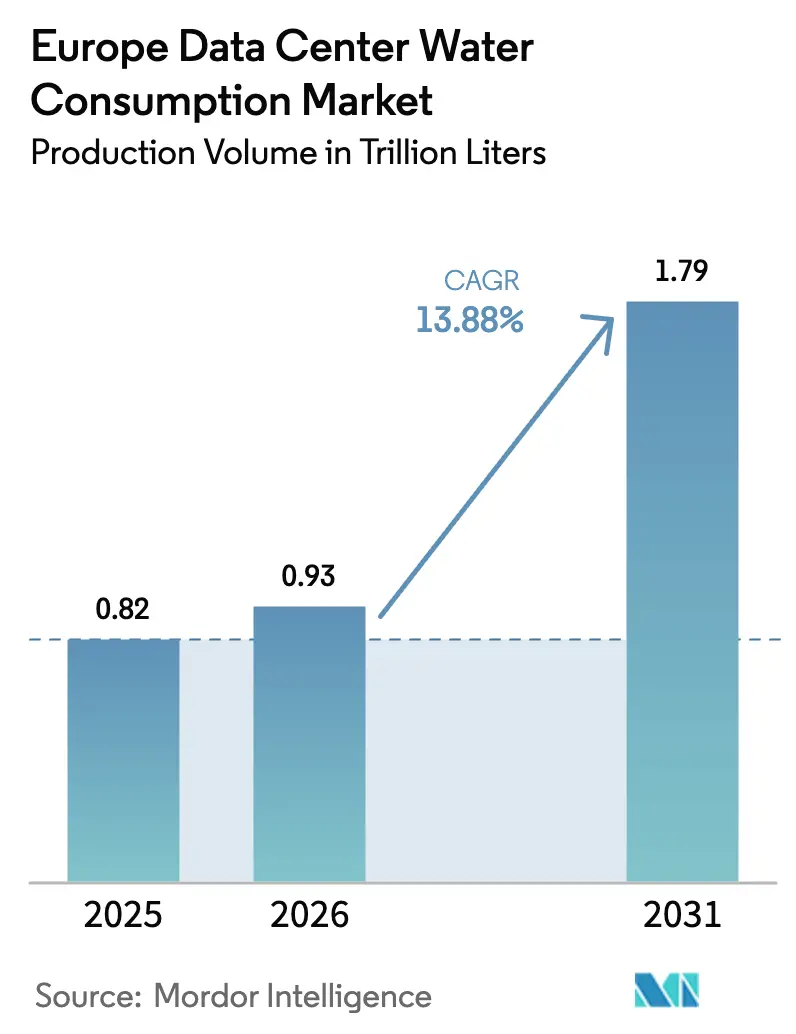
| Base Year Market Size (2025) | 0.82 Trillion liters |
| Market Volume (2026) | 0.93 Trillion liters |
| Market Volume (2031) | 1.79 Trillion liters |
| Growth Rate (2026 - 2031) | 13.88% CAGR |
| Market Concentration | Medium |
Major Players *Disclaimer: Major Players sorted in no particular order Image © Mordor Intelligence. Reuse requires attribution under CC BY 4.0. | |
Europe Data Center Water Consumption Market Analysis by Mordor Intelligence
The Europe data center water consumption market size was valued at 0.82 trillion liters in 2025 and estimated to grow from 0.93 trillion liters in 2026 to reach 1.79 trillion liters by 2031, at a CAGR of 13.88% during the forecast period (2026-2031). Growing hyperscale build-outs for AI workloads, mandatory EU disclosure of water usage effectiveness, and the rapid shift toward liquid and immersion cooling are the core forces lifting demand. Operators are restructuring their procurement strategies to secure non-potable supplies, while regulatory compliance costs reshape cost structures and encourage consolidation among large, well-capitalized players. Investment is flowing to facilities designed for zero-evaporation or closed-loop operation, and capital markets continue to reward projects that can verify “water-positive” outcomes.
Key Report Takeaways
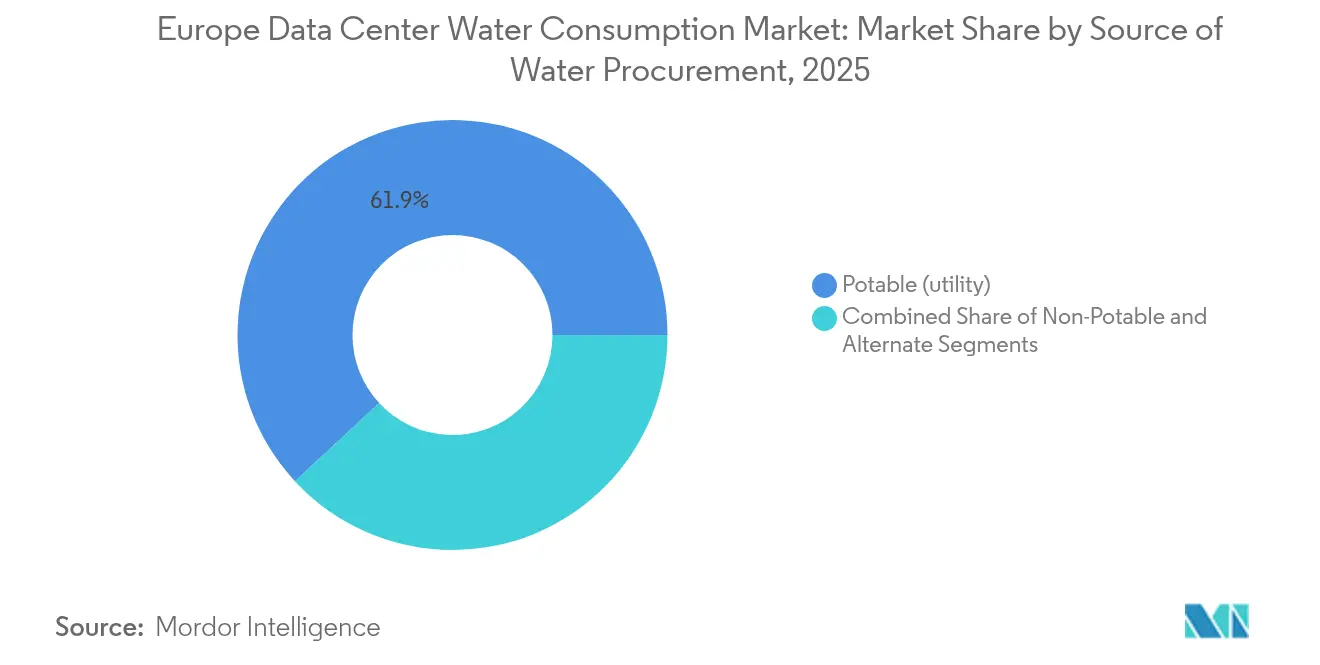
- By source of water procurement, potable sources held 61.90% of the European data center water consumption market share in 2025, whereas alternate sources are projected to expand at a 19.12% CAGR to 2031.
- By cooling technology, water-cooled towers accounted for 45.70% of deployments in the European data center water consumption market in 2025, while immersion cooling is forecast to grow at an 17.85% CAGR through 2031.
- By data center type, retail colocation accounted for 41.20% of the revenue in the European data center water consumption market in 2025; hyperscale cloud service providers are expected to accelerate at a 17.22% CAGR through 2031.
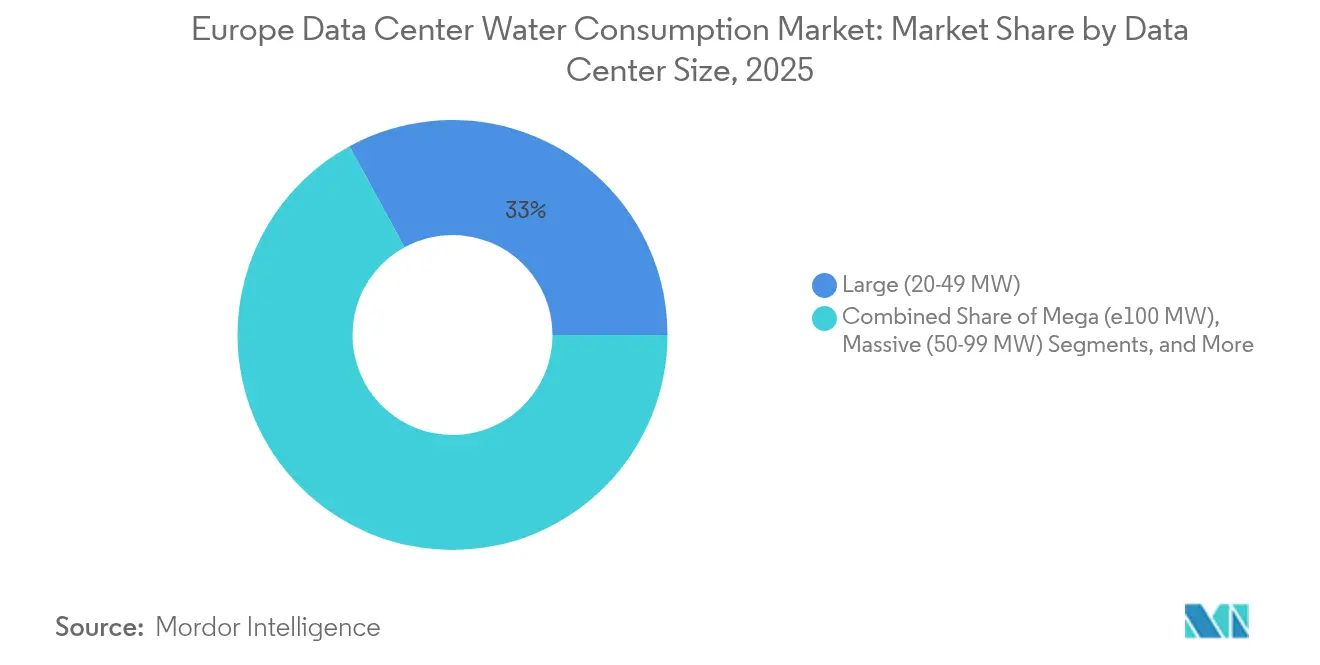
- By data center size, mega campuses exceeding 100 MW represented the fastest-growing tier, with a 20.92% CAGR outlook for the European data center water consumption market. However, large halls (20-49 MW) held a 32.95% share in 2025.
- By geography, Western Europe led the European data center water consumption market in 2025, accounting for 38.10% of the market, but Northern Europe is expected to grow the fastest, at a 19.85% CAGR, to 2031.
Note: Market size and forecast figures in this report are generated using Mordor Intelligence’s proprietary estimation framework, updated with the latest available data and insights as of 2026.
Global valuation is built by aggregating outputs from multiple regions, with Europe forming one of the important contributors. Mordor Intelligence's global data center water consumption market size report represents that cumulative total.
Europe Data Center Water Consumption Market Trends and Insights
Drivers Impact Analysis*
| Driver | (~) % Impact on CAGR Forecast | Geographic Relevance | Impact Timeline |
|---|---|---|---|
| Hyperscale and AI-led capacity build-outs accelerating cooling-water demand | +4.2% | Global, concentrated in FLAP-D markets | Medium term (2-4 years) |
| EU Energy-Efficiency and CSRD rules mandating WUE disclosure | +3.1% | EU-wide, strictest in Germany, Netherlands | Short term (≤ 2 years) |
| Colocation boom in FLAP-D and tier-2 metros widens potable-water intake | +2.8% | Western Europe, expanding to Southern Europe | Medium term (2-4 years) |
| Shift from air to liquid/evaporative cooling architectures | +2.4% | Northern and Western Europe | Long term (≥ 4 years) |
| Migration to inland secondary sites fuels on-site grey-/ground-water systems | +1.7% | Spain, Italy, Eastern Europe | Long term (≥ 4 years) |
| “Water-positive” pledges drive closed-loop reclamation investments | +1.3% | Global, early adoption in Nordic countries | Long term (≥ 4 years) |
| Source: Mordor Intelligence | |||
Hyperscale and AI-led capacity build-outs accelerating cooling-water demand
High-density AI racks need 40-60 kW per rack, far beyond legacy norms, and generate heat loads that overwhelm air systems. Operators now adopt liquid cooling that can consume three-to-five-times more water per megawatt yet achieves superior PUE and meets tight thermal envelopes. Microsoft’s USD 80 billion AI campus program integrates zero-evaporation designs to offset higher absolute demand, showing how scale allows both sustainability and performance gains.[1]Microsoft, “Water Positive by 2030,” microsoft.com Brookfield’s USD 10 billion Swedish campus similarly targets regions with surplus water and renewables, shifting where consumption occurs. Resulting growth locks in a higher baseline for the Europe data center water consumption market over the medium term.
EU Energy-Efficiency and CSRD rules mandating WUE disclosure
The 2024 Corporate Sustainability Reporting Directive compels facilities above 100 kW to publish water usage effectiveness alongside energy indicators, ending opacity around consumption metrics. Operators rushed to install advanced meters, analytics, and treatment assets because performance now influences client procurement and financing. Digital Realty reports 43% non-potable intake across its regional portfolio, positioning itself ahead of compliance curves.[2]Digital Realty, “2025 ESG Report,” digitalrealty.com The regulation adds 2-4% to operating costs for legacy sites lacking integrated systems, rewarding early movers and intensifying competition on transparency.
Colocation boom in FLAP-D and tier-2 metros widens potable-water intake
Frankfurt, London, Amsterdam, Paris, and Dublin captured 85% of new capacity in 2024, saturating municipal networks and driving bidding wars for industrial water. London exceeds 1 GW of live capacity and faces tariff hikes linked to new infrastructure investments. Retail colocation firms, which hold 41.87% share, are more exposed because their multi-tenant models hinder investment in alternate supplies. Hence operators expand into Spain, Italy, and Greece where water tariffs remain lower, yet they must still hedge drought risk through on-site reuse systems.
Shift from air to liquid/evaporative cooling architectures
Server densities now routinely exceed 15 kW per rack, pushing air systems to thermal limits. Direct-to-chip loops cut facility water needs by up to 52% versus open towers but demand specialized treatment infrastructure and higher capital spend. Immersion cooling, growing at 18.12% CAGR, eliminates air handlers entirely but introduces dielectric fluid logistics and EU chemical-safety compliance constraints. CyrusOne implements air-cooled heat exchangers and sealed loops in Spain, proving water independence is achievable when design begins at site selection.
Restraints Impact Analysis*
| Restraint | (~) % Impact on CAGR Forecast | Geographic Relevance | Impact Timeline |
|---|---|---|---|
| Drought restrictions and moratoria in Spain, Netherlands, Ireland | –2.8% | Southern and Western Europe | Short term (≤ 2 years) |
| Community opposition and lengthy water-use permitting cycles | –1.9% | Urban FLAP-D markets | Medium term (2-4 years) |
| Escalating EU wastewater tariffs inflate OPEX | –1.4% | EU-wide, concentrated in Germany, Netherlands | Short term (≤ 2 years) |
| Legionella and bio-fouling risks raise treatment CAPEX | –0.8% | Global, higher risk in Southern Europe | Medium term (2-4 years) |
| Source: Mordor Intelligence | |||
Drought restrictions and moratoria in Spain, Netherlands, Ireland
Catalonia’s emergency bans halted permits for sites above 1 MW, forcing redesigns that add 15-25% to capital budgets. Amsterdam imposed 20% consumption cuts during 2024 water-stress alerts, affecting facilities without recycle lines.[3]Rabobank, “Industrial Water Pricing Outlook Netherlands,” rabobank.com Ireland’s capital faced 18-month project delays as authorities prioritized residential supply, cutting into the Europe data center water consumption market’s near-term expansion pace. These curbs redirect investment to Nordic states yet raise overall project-planning complexity.
Community opposition and lengthy water-use permitting cycles
Local activism increasingly cites water usage when challenging data center approvals. Dutch municipalities now require operators to deliver net-positive benefits such as wetland restoration or heat reuse before permits are issued. The average water-intensive project waits 24-36 months for clearance versus 12-18 months a decade ago, adding financing costs that smaller developers cannot absorb. atNorth’s greenhouse-heating plan in Denmark shows how tangible community gains can unlock support and shorten timelines.
*Our forecasts treat driver/restraint impacts as directional, not additive. The impact forecasts reflect baseline growth, mix effects, and variable interactions.
Segment Analysis
By Source of Water Procurement: Alternate Sources Drive Innovation
Potable supplies produced 0.51 trillion liters and accounted for 61.90% of the Europe data center water consumption market in 2025. Escalating municipal tariffs and drought policies are, however, steering operators toward reclaimed, ground, and surface-water systems that grow at 19.12% CAGR. Large campuses amortize the higher upfront cost of membranes and ultraviolet polishing across many megawatts, shrinking life-cycle expense curves. Digital Realty now sources 43% of its need from non-potable lines, using AI-driven anomaly detection to manage quality and lower chemical spend. In high-risk regions, rainwater capture, seawater desalination, and tertiary sewage reuse underpin resilience strategies, ensuring continuous operation during restrictions and protecting the Europe data center water consumption market size for alternate supplies, which is projected to exceed 0.73 trillion liters by 2031.
Alternative schemes also help operators meet looming Scope 3 reporting obligations by cutting embedded emissions tied to municipal treatment. They support water-positive pledges and bolster community relations, creating intangible value that eases future expansion. Yet potable pipelines remain the default for smaller colocation venues because they require no specialist staff or capital and deliver stable pressure and quality. Over the forecast window, the competitive gap will widen as investors favor projects that internalize water security, further embedding alternative sourcing as a strategic differentiator across the Europe data center water consumption market.


By Cooling Technology: Immersion Systems Reshape Infrastructure
Water-cooled towers and chillers consumed nearly 0.38 trillion liters in 2025, equating to 45.70% of total demand. Their mature performance keeps them prevalent, especially in retrofits, yet AI-grade clusters are accelerating the roll-out of liquid-centric alternatives. Immersion baths and direct-to-chip loops register an 17.85% CAGR, positioning them to exceed 26.10% share by 2031. Microsoft’s closed-loop zero-evaporation architecture demonstrates that sophisticated controls can marry immersion efficiency with minimal withdrawal, aligning technology shifts with sustainability targets.
Operators weigh fluid life-cycle, maintenance skills, and regulatory constraints on fluorinated compounds, which the EU monitors closely. Air-cooled adiabatic chillers offer a middle path, reducing water by up to 70% but sacrificing efficiency during Southern European heatwaves. Rear-door heat exchangers give legacy halls a modular route to higher densities without plant-room overhauls. Consequently, the mix will fragment, yet immersion’s thermal headroom and form-factor advantages make it the likely default for racks above 40 kW, sustaining long-run growth for this segment of the Europe data center water consumption market.
By Data Center Type: Hyperscale Operators Lead Transformation
Retail colocation sites delivered 41.20% of water withdrawals in 2025, reflecting their ubiquitous footprint and customer mix. Hyperscale cloud platforms, however, expand at 17.22% CAGR and drive virtually all incremental liters through 2031. Their economies of scale support reverse-osmosis polishers, zero-liquid-discharge loops, and on-site reservoirs that smaller venues cannot fund, reinforcing competitive divergence across the Europe data center water consumption industry. AWS posted a water usage effectiveness of 0.19 L/kWh, setting a new efficiency benchmark.
Enterprise and wholesale categories shrink in relative weight as firms migrate workloads into multi-tenant or dedicated hyperscale halls, concentrating consumption and driving the Europe data center water consumption market size for hyperscale nodes to more than 1.07 trillion liters by 2031. Colocation firms respond via mergers and through cooperative treatment plants that serve multiple data halls, but their capital intensity remains a constraint.
By Data Center Size: Mega Facilities Dominate Growth
Campuses exceeding 100 MW demonstrate the strongest momentum, growing at a 20.92% CAGR as they capitalize on AI, high-performance computing, and sovereign-cloud build-outs. These venues justify comprehensive water infrastructure, including aquifer recharge wells and thermal-energy storage that buffers daily peaks. Such designs enable operators to negotiate fixed-rate industrial contracts, thereby mitigating tariff volatility. Large (20-49 MW) halls held a 32.95% share in 2025 and are expected to expand steadily, benefiting from network-edge requirements in tier-2 metros. However, they face competitive pressure from mega sites on a cost per MW basis.
Medium and small halls risk obsolescence unless they retrofit to meet tightening disclosure and treatment standards. XTX Markets’ EUR 1 billion Finnish complex, engineered to operate entirely without water by leveraging Arctic air and heat reuse, showcases innovation at the top end and sets expectations that future mega sites must meet or exceed. This shift tightens the link between facility size and environmental credibility within the European data center water consumption market.
Geography Analysis
Western Europe absorbed 0.31 trillion liters in 2025, underpinned by the established FLAP-D cluster. Germany drives disclosure and tariff hikes; the Netherlands applies intake caps, pushing operators to invest in closed-loop designs. France leverages nuclear-backed energy to host AI mega sites, while the United Kingdom streamlines national-significance approvals that still require stringent water-impact studies. Sustained demand from cloud and enterprise tenants keeps expansions moving, yet escalating costs prompt a pivot toward alternate supplies and reuse schemes, stabilizing withdrawal growth and safeguarding the Europe data center water consumption market in mature metros.
Northern Europe records the highest CAGR at 19.85%, buoyed by abundant hydro, wind, and cool climates that slash both energy and water footprints. Sweden and Finland attract multibillion-dollar hyperscale projects, with Brookfield and XTX Markets choosing locations where natural cooling eliminates evaporative loss. Iceland and Norway provide geothermal heat rejection and near-carbon-free power, though submarine cable routes can limit latency-sensitive workloads. The region’s governments actively court data centers, offering green-energy guarantees that further amplify growth prospects.
Southern Europe emerges as the diversification frontier. Spain, Italy, and Greece supply solar-powered, latency-advantaged alternatives to overcrowded northern hubs, yet sustained drought risk necessitates onsite recycling from day one. Madrid and Barcelona boast robust fiber, but Catalonia’s moratorium underscores supply volatility. Italian projects such as Microsoft’s Lombardy campus integrate aquifer storage and desalinated feedwater to comply with regional policy. Greek builds lean on seawater reverse-osmosis and underscore the role of maritime pipelines. Collectively, these strategies support continuous expansion, though heightened engineering complexity tempers pace.
Coverage of the data center water consumption market by Mordor Intelligence spans a wide geographic footprint, with regional analysis available for Asia, North America, and South America, alongside detailed country-level intelligence for United Kingdom, Germany, France, Netherlands, Spain, and Brazil, each shaped by local operating conditions.
Competitive Landscape
The Europe data center water consumption market shows moderate concentration. Digital Realty, Equinix, and three hyperscale cloud providers hold an estimated 55-60% of installed capacity. Digital Realty’s USD 8.4 billion Interxion purchase lifted its regional presence and enabled portfolio-wide water-reduction initiatives, including AI-directed leak detection that cut annual intake by 7%. Equinix targets 100% recycled water in new builds, piloting membrane reactors in Paris. Hyperscale operators—AWS, Microsoft, Google—deploy proprietary analytics and multi-stage recycling to sustain sub-0.25 L/kWh performance, cementing cost advantages and creating barriers for smaller peers
Mid-tier challengers differentiate through site selection and heat-reuse economics. At North links waste-heat flows to district heating grids in Denmark, securing revenue streams and community goodwill. CyrusOne’s Iberian campuses use closed-loop air coolers to eliminate municipal reliance, appealing to drought-prone regions. Investors channel capital toward operators with verifiable ESG credentials, making water governance a decisive factor in financing costs and M&A valuations.
Technology partnerships intensify. Vendors of reverse-osmosis skids, membrane bioreactors, and real-time quality sensors sign framework deals with multi-site operators, embedding proprietary standards that raise switching costs. Meanwhile, policy uncertainty around chemical restrictions and wastewater surcharges favors players with in-house regulatory teams. The market therefore trends toward vertically integrated models capable of rapid design iteration and coordinated deployment across continental footprints.
Europe Data Center Water Consumption Industry Leaders
Digital Realty Trust Inc.
NTT Corporation
Equinix Inc.
Vantage Data Centers Management Co. LLC
Global Switch Holdings Ltd.
- *Disclaimer: Major Players sorted in no particular order

Recent Industry Developments
- February 2025: France and the UAE agreed to invest USD 30-50 billion in a 1 GW AI-centric data center campus in France.
- March 2025: Blackstone obtained approval for a GBP 10 billion (USD 12.4 billion) QTS hyperscale project in Northumberland, UK.
- January 2024: Membion raised EUR 5 million for compact membrane bioreactor technology.
- September 2024: atNorth unveiled plans for a Danish mega site featuring district-heating heat reuse.


Europe Data Center Water Consumption Market Report Scope
The European Data Center Water Consumption Market segments its offerings based on various criteria. Water procurement sources include Potable (from Utility or Private sources), Non-Potable (such as Treated Sewage or Recycled water), and other Alternate sources. Cooling technologies are diverse, featuring Air-cooled Chillers with Adiabatic Pads, Water-cooled Chillers and Towers, Direct-to-Chip or Cold-Plate Liquid Cooling, Immersion Cooling, and Rear-Door Heat Exchangers. Data centers are classified into four types: Enterprise, Retail Colocation, Wholesale, and Hyperscale Cloud Service Providers (CSP). When considering Data Center Size, measured in IT Load (in MW), categories range from Mega (over 100 MW) and Massive (50–99 MW) to Large (20–49 MW), Medium (5–19 MW), and Small (under 5 MW). The market forecasts are expressed in volume, specifically in liters.
| Potable (Utility / Private) |
| Non-Potable (Treated Sewage / Recycled) |
| Alternate |
| Air-cooled Chillers with Adiabatic-Pads |
| Water-cooled Chillers and Towers |
| Direct-to-Chip / Cold-Plate Liquid |
| Immersion Cooling |
| Rear-Door Heat Exchangers |
| Enterprise |
| Retail Colocation |
| Wholesale / Hyperscale CSP |
| Mega (>100 MW) |
| Massive (50-99 MW) |
| Large (20-49 MW) |
| Medium (5-19 MW) |
| Small (<5 MW) |
| By Source of Water Procurement | Potable (Utility / Private) |
| Non-Potable (Treated Sewage / Recycled) | |
| Alternate | |
| By Cooling Technology | Air-cooled Chillers with Adiabatic-Pads |
| Water-cooled Chillers and Towers | |
| Direct-to-Chip / Cold-Plate Liquid | |
| Immersion Cooling | |
| Rear-Door Heat Exchangers | |
| By Data Center Type | Enterprise |
| Retail Colocation | |
| Wholesale / Hyperscale CSP | |
| By Data Center Size (IT-Load MW) | Mega (>100 MW) |
| Massive (50-99 MW) | |
| Large (20-49 MW) | |
| Medium (5-19 MW) | |
| Small (<5 MW) |


Key Questions Answered in the Report
What is the current size of the Europe data center water consumption market?
The market recorded 0.93 trillion liters in 2026 and is forecast to rise to 1.79 trillion liters by 2031, reflecting a 13.88% CAGR.
Why are hyperscale operators driving higher water demand?
AI and high-performance computing racks generate far more heat than legacy servers, prompting adoption of liquid and immersion cooling that consumes up to five-times more water per megawatt yet delivers superior efficiency.
How are EU regulations shaping water management practices?
The Corporate Sustainability Reporting Directive, effective 2024, forces facilities above 100 kW to disclose water usage effectiveness, spurring rapid investment in metering, recycling and closed-loop systems.
Which cooling technology segment is expanding the fastest?
Immersion cooling is advancing at an 17.85% CAGR through 2031 as it supports rack densities above 40 kW and aligns with zero-evaporation design goals.
Page last updated on:


