Netherlands Data Center Water Consumption Market Size and Share
Market Overview
| Study Period | 2020 - 2031 |
|---|---|
| Forecast Data Period | 2026 - 2031 |
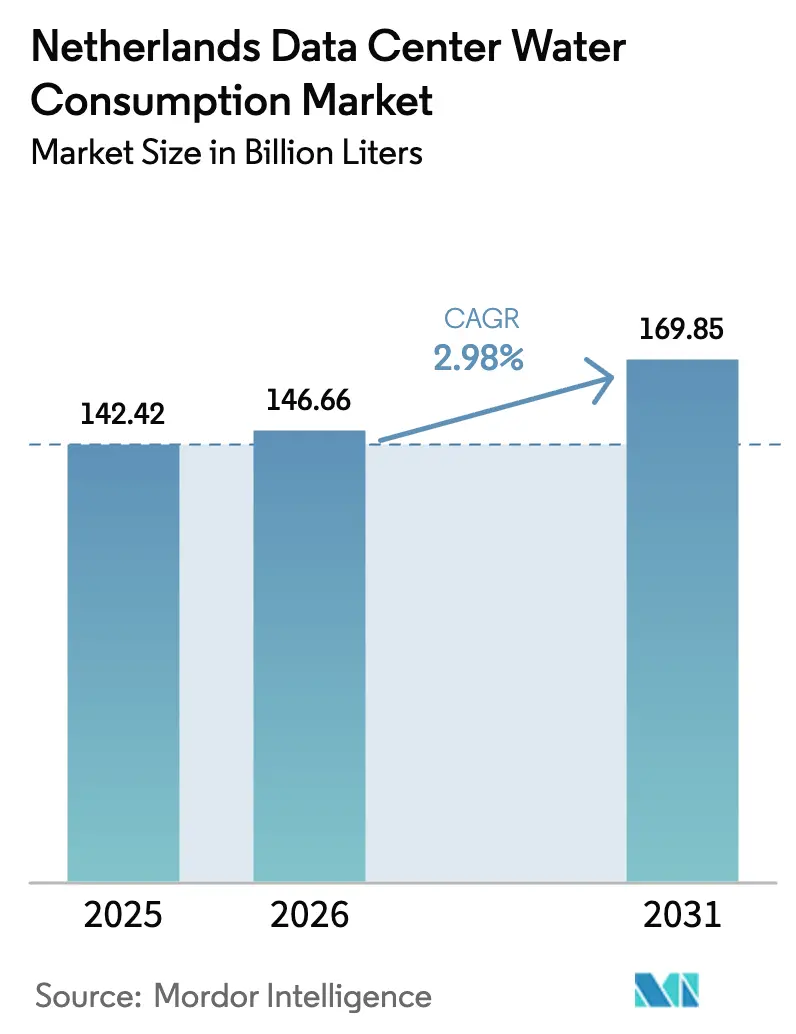
| Base Year Market Size (2025) | 142.42 Billion liters |
| Market Volume (2026) | 146.66 Billion liters |
| Market Volume (2031) | 169.85 Billion liters |
| Growth Rate (2026 - 2031) | 2.98% CAGR |
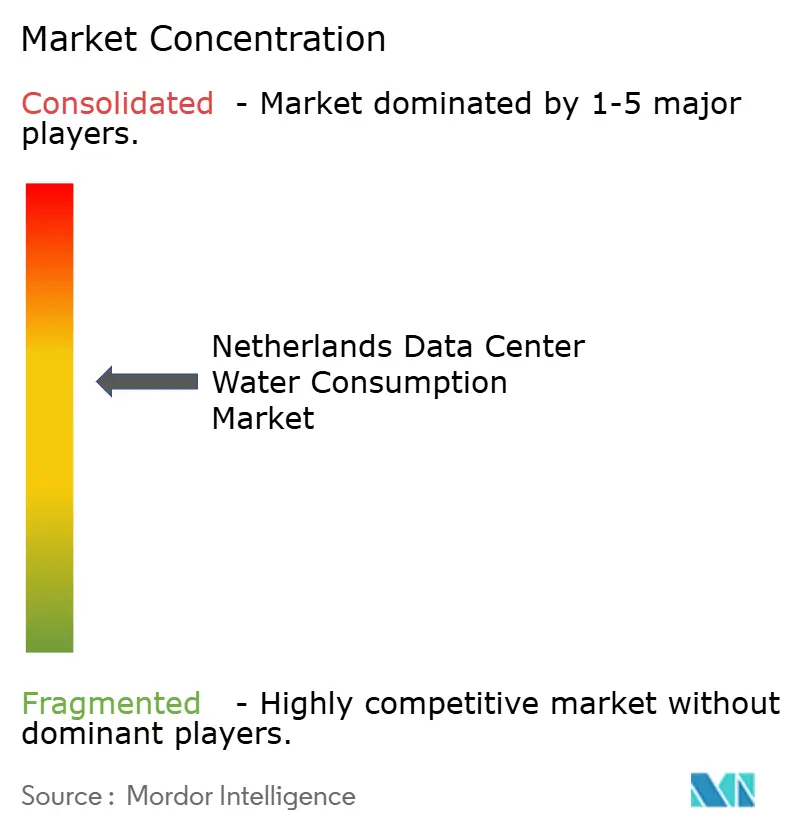
| Market Concentration | Medium |
Major Players *Disclaimer: Major Players sorted in no particular order Image © Mordor Intelligence. Reuse requires attribution under CC BY 4.0. | |
Netherlands Data Center Water Consumption Market Analysis by Mordor Intelligence
The Netherlands data center water consumption market size was valued at 142.42 billion liters in 2025 and estimated to grow from 146.66 billion liters in 2026 to reach 169.85 billion liters by 2031, at a CAGR of 2.98% during the forecast period (2026-2031). Water intensity per megawatt is falling quickly because operators are replacing evaporative towers with closed-loop liquid systems, expanding non-potable sourcing, and integrating heat-recovery designs that satisfy evolving EU efficiency mandates. Hyperscale builds clustered in Groningen and Hollands Kroon are accelerating, incentivized by grid headroom, looser permit rules, and proximity to offshore wind generation, while Amsterdam’s Randstad corridor tightens abstraction caps and grid allotments. Vitens’ 2024 warning that 45 industrial applicants remain on waiting lists for drinking-water connections underscores why rainwater harvesting, treated sewage effluent, and surface water are scaling at double-digit CAGRs. Growing AI and 5G workloads demand rack densities that legacy air systems cannot serve economically, forcing direct-to-chip and immersion cooling adoption and pushing the Netherlands data center water consumption market toward a structural water-neutral trajectory despite rising absolute workload volumes.
Key Report Takeaways
- By data-center type, colocation retained 46.05% Netherlands data center water consumption market share in 2025 while hyperscale facilities are projected to expand at 13.78% CAGR through 2031.
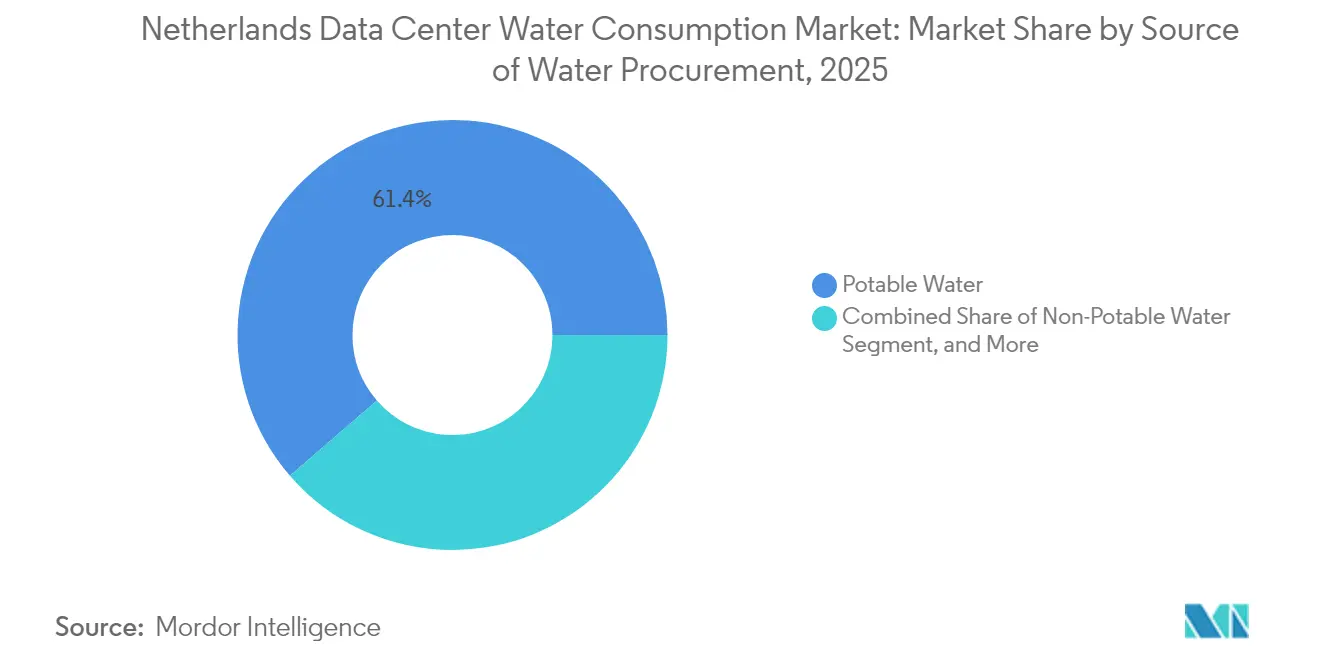
- By source of water procurement, potable connections held 61.35% share of the Netherlands data center water consumption market size in 2025; grey-water and other non-potable systems are advancing at 15.82% CAGR to 2031.
- By cooling technology, indirect adiabatic systems led with 47.35% share in 2025, whereas direct-to-chip architectures are projected to grow at 19.02% CAGR through 2031.
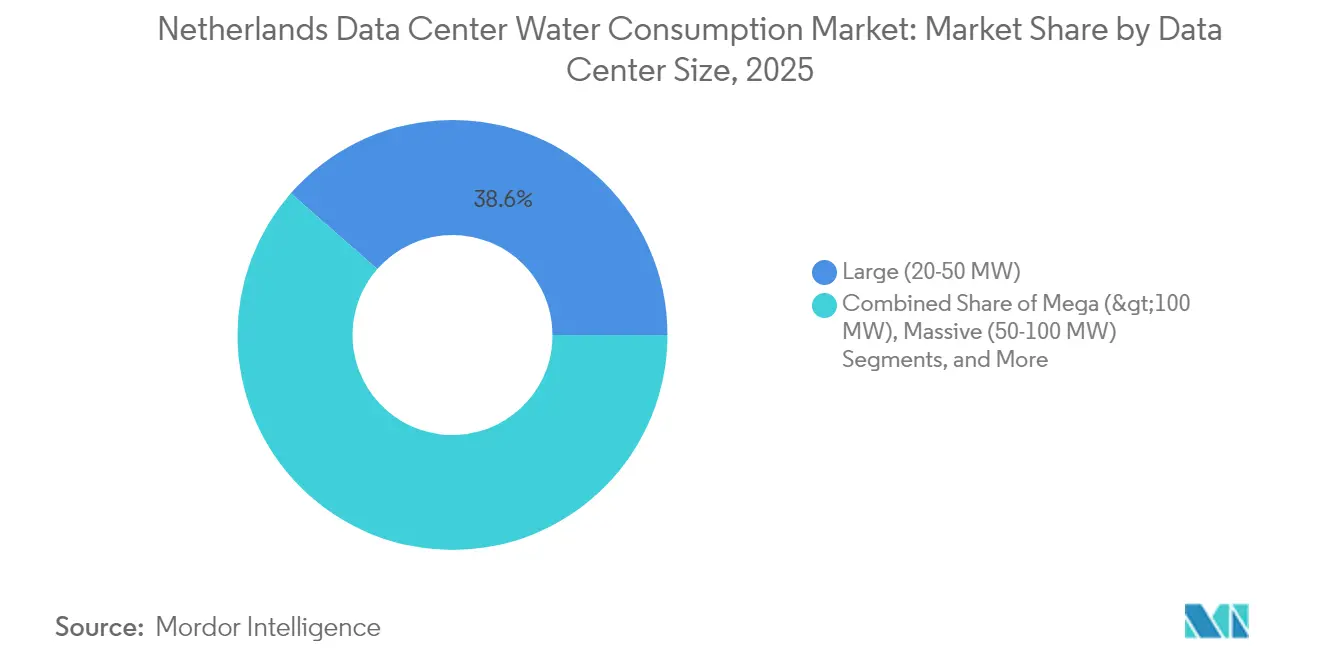
- By facility-size band, large sites between 20 and 50 MW accounted for 38.55% of the Netherlands data center water consumption market size in 2025 and mega complexes above 100 MW are set to rise 12.02% annually to 2031.
- By end-user, IT and telecom captured 43.45% Netherlands data center water consumption market share in 2025; cloud services show the fastest trajectory at 13.24% CAGR on enterprise workload migration.
Note: Market size and forecast figures in this report are generated using Mordor Intelligence’s proprietary estimation framework, updated with the latest available data and insights as of 2026.
Netherlands operates as part of an interconnected international environment rather than as a self-contained country level unit. The data center water consumption market research by Mordor Intelligence places together all major developments across the globe within that wider frame.
Netherlands Data Center Water Consumption Market Trends and Insights
AI, 5G and Cloud Adoption Accelerating Hyperscale Builds
Hyperscale investments are clustering in the two municipalities exempted from the 2024 ban, channeling workloads to Groningen, where Google’s EUR 600 million (USD 698.64 million) campus deploys closed-loop systems that remove evaporative loss. Microsoft’s zero-water initiative demonstrated 0.30 liters per kWh water usage by harvesting rainwater and restricting direct evaporative cooling to fewer than 5% of operating hours. The Delta Programme forecasts drier summers and lower Rhine flows through 2050, intensifying pressure to decouple capacity growth from potable demand. EU Water Resilience Strategy funding of EUR 15 billion (USD 17.47 billion) signals future abstraction limits in stressed basins, accelerating the adoption of liquid cooling more rapidly than the headline CAGR implies. Collectively, these factors encourage operators to adopt heat-ready designs that transform cooling systems into revenue-generating thermal assets, linking them with municipal grids.
Growth of Edge Data Centers in Secondary Dutch Cities
Amsterdam’s proposed 670 MVA grid ceiling and stricter water permits divert new builds toward Rotterdam, Utrecht, Eindhoven, and Almere where approvals are faster and power is available. Greenhouse Datacenters’ DC3 opened in April 2025 with 0.380 liters per kWh water usage, proving edge facilities can rival hyperscale efficiency at modest scale. NorthC added 11 MW across four secondary-city sites, each integrating district-heating loops mandated by local councils. Rotterdam’s port hydrogen cluster offers seawater-cooling potential without drinking-water conflict, attracting EdgeConneX and Digital Realty feasibility studies. Community resistance that cancelled Meta’s Zeewolde project in 2023 is steering operators toward dispersed, smaller footprints that lower social-license risk.
Stringent ESG Targets Driving Water-Efficient Technologies
The Energy Efficiency Directive obliges data centers above 1 MW to recover heat or justify infeasibility, stimulating direct-to-chip and immersion cooling that capture up to 99% server energy as 50-80 °C water. Asperitas’ immersion platforms, launched 2025, shrink floorplates by 80% and cut capital plus operating costs 45% relative to air designs while eliminating evaporative loss. QTS supplies recovered heat from Groningen to 5,000 homes, demonstrating bankable secondary revenue streams that offset water-treatment expenditure. The Water Framework Directive enforces “good ecological status” by 2027, prompting tighter abstraction thresholds in the Randstad where summer low flows already trigger priority rationing. Operators therefore pivot to greywater, rainwater, and seawater sources that bypass municipal supplies even when 30-year payback horizons challenge pure financial justification.
Government Incentives for Circular Water Use
The MISD consortium won EUR 34 million (USD 39.59 million) under EU IPCEI-CIS to prototype modular edge facilities capable of water-neutral operation where municipal lines are impractical. The Omgevingswet, effective 2024, consolidates abstraction permits into a single environmental review, enabling municipalities to expedite the approval of applicants offering circular water and heat reuse proposals. Vitens will raise tariffs by 21% in 2025 and levy surcharges on top-50 industrial buyers, nudging operators toward alternative sourcing. Early adopters include Penta Infra, which signed a 2024 letter of intent to feed waste heat from AMS01 into Haarlem’s district network, securing expedited permit approval. The policy mix of grants, tariff signals, and streamlined licensing is steadily increasing the Netherlands data center water consumption market uptake of circular solutions that minimize potable demand and elevate heat as a co-product.
Restraints Impact Analysis*
| Restraint | (~) % Impact on CAGR Forecast | Geographic Relevance | Impact Timeline |
|---|---|---|---|
| Tightening Water-Abstraction Permits in Randstad Corridor | -0.5% | Amsterdam, The Hague, Rotterdam, Utrecht, and surrounding municipalities | Short term (≤ 2 years) |
| Competing Municipal Uses During Summer Droughts | -0.3% | National, acute in Rhine and IJssel river basins | Medium term (2-4 years) |
| Social License Risk From Community Pushback | -0.2% | National, highest in densely populated Randstad and agricultural zones | Short term (≤ 2 years) |
| High CAPEX of Advanced Water Treatment Retrofits | -0.3% | National, disproportionately affects legacy colocation facilities in Amsterdam | Medium term (2-4 years) |
| Source: Mordor Intelligence | |||
Tightening Water-Abstraction Permits in Randstad Corridor
Vitens’ inability to guarantee new water connections to 45 industrial applicants underscores immediate scarcity around Amsterdam, The Hague, Rotterdam, and Utrecht. Draft municipal rules cap Amsterdam data-center grid load at 670 MVA and prohibit expansions lacking demonstrable heat reuse and low-water designs, effectively closing the door on conventional evaporative builds. Delta scenarios anticipate 20-40% summer Rhine flow reductions that will intensify industrial curtailment when cooling loads peak. Priority sequencing places drinking water and agriculture ahead of industry, exposing data centers to rationing during drought events. In response, operators pivot to closed-loop systems needing only infill volumes and annual makeup, thus limiting the negative CAGR drag on the Netherlands data center water consumption market.
High CAPEX of Advanced Water Treatment Retrofits
Retrofitting legacy air-cooled halls for high-density liquid racks costs more than integrating liquid from the outset because additional piping, pumps, and filtration must coexist within fixed footprints. Ultrapure-water plants, such as the reverse-osmosis line at Delfzijl, require ultrafiltration, electrodeionization, and real-time monitoring to keep conductivity below 1 µS/cm, adding both capital and operating charges. Vertiv recommends 50-micron filtration and semi-annual fluid testing, further increasing running costs compared with legacy air systems. Springer’s Schiphol rainwater study pegs simple harvesting systems at 30-year payback even before retrofitting pumps or membranes into brownfield halls. These economics hinder retrofit projects in Amsterdam, nudging some operators to shift new capacity to northern greenfield locations rather than reinvest in existing shells, tempering near-term growth in the Netherlands data center water consumption market.
*Our forecasts treat driver/restraint impacts as directional, not additive. The impact forecasts reflect baseline growth, mix effects, and variable interactions.
Segment Analysis
By Source of Water Procurement: Non-Potable Systems Break Potable Dominance
Potable connections represented 61.35% of the Netherlands data center water consumption market size in 2025; however, grey-water, rainwater, and surface-water solutions are projected to erode this majority as they grow 15.82% each year through 2031. Microsoft’s Dutch campuses already report 0.30 liters per kWh consumption after migrating to rainwater feeds and closed-loop liquid cooling, highlighting the performance ceiling now expected by regulators and enterprise clients.
Grey-water plants that polish sewage effluent to 10-50 µS/cm add roughly 1.71 kWh per cubic meter in energy demand, yet remove dependence on municipal abstraction permits, a trade-off operators accept to secure long-term growth in the Netherlands data center water consumption market. Pilot nature-based filtration at PWN WATERSOURCE reduces energy intensity 30-40% and doubles as seasonal storage, proving environmental measures can also lower operating costs. Seawater-based cooling, under review for Rotterdam facilities, utilizes titanium exchangers to prevent corrosion while providing an unlimited supply that bypasses drinking-water networks, demonstrating how coastal locations can deliver structural advantages.


By Data Center Cooling Technology: Liquid Architectures Displace Adiabatic Incumbents
Indirect adiabatic units held 47.35% Netherlands data center water consumption market share during 2025, a legacy from earlier builds that leveraged cool Dutch climates and low water tariffs. Direct-to-chip systems are on track for a 19.02% CAGR as AI rack densities surpass 40 kW and waste-heat targets necessitate outlet temperatures unsuitable for air systems.
Immersion cooling, long constrained by maintenance complexity, now moves into mainstream adoption after Asperitas’ 5 kW per RU platform, paired with Shell S5 X fluid, lowered the total cost of ownership by 45% and captured 99% of IT energy as 60 °C water. Rear-door heat exchangers offer a retrofit bridge, but they capture only 30-40% of the heat, pushing greenfield sites to leap directly into full liquid designs where district-heating mandates apply. Because heat-recovery feasibility is now mandatory above 1 MW, liquid systems that meet return temperatures of 70-80 °C will eventually become the baseline, locking in a medium-term growth engine for the Netherlands' data center water consumption market.
By Data Center Type: Hyperscale Cloud Gains as Colocation Defends
Colocation providers controlled 46.05% Netherlands data center water consumption market share in 2025, anchored by Equinix and Interxion’s Amsterdam carrier hotels. Hyperscale clouds are forecast to expand 13.78% annually through 2031 by building purpose-built campuses in Groningen and Hollands Kroon, locations unburdened by Randstad permit ceilings and grid congestion.
Colocation incumbents are integrating district-heating schemes. Equinix’s AM4-to-Diemen study is a recent example of preserving enterprise demand and satisfying ESG benchmarks that mandate water usage effectiveness below 0.5 liters per kWh. Edge providers, such as Greenhouse Datacenters, capitalize on investment diverted from Amsterdam by offering sub-3 MW suites in Rotterdam and Almere, with liquid-ready design baked in from day one. Enterprise on-premise footprints decline in absolute volume as hybrid strategies move batch workloads into the hyperscale layer, concentrating water demand into fewer, larger campuses that can absorb treatment CAPEX and monetize waste heat.
By Data Center Size: Mega Facilities Concentrate in Permitted Zones
Large campuses between 20 and 50 MW comprised 38.55% of the Netherlands data center water consumption market size in 2025 by serving latency-sensitive finance and cloud interconnects adjacent to AMS-IX. Mega sites above 100 MW are growing 12.02% annually because only two municipalities allow hyperscale construction, incentivizing operators to cluster new capacity in northern provinces.
Switch Datacenters opts for incremental module additions at Science Park to avoid triggering new abstraction permits yet still integrate closed-loop cooling and heat export to Diemen, illustrating how brownfield mega-campuses evolve within tight Randstad rules. Meanwhile, QTS’s Groningen project demonstrates that aligning with WarmteStad district heating can secure political support and lock in power and water allocations over multi-decade horizons. Medium bands (5-20 MW) retain relevance for government and edge applications but face capital-cost disadvantage when compared with mega-scale economies, moderating their share of the Netherlands data center water consumption market.
By End-User Industry: Cloud Services Displace IT and Telecom
IT and telecom accounted for 43.45% Netherlands data center water consumption market share in 2025, a legacy of carrier hotels and voice network nodes. Cloud services workloads, however, are expanding at an annual rate of 13.24% to 2031 as enterprises move compute-intensive AI and analytics to hyperscale clusters capable of amortizing the costs of costly water-treatment assets.
Banking and finance specify sub-0.5 liter per kWh contracts, steering demand toward liquid-cooled sites certified under ISO 14001 and 27001. Healthcare fleets deploy edge nodes in secondary cities to cut latency on imaging workflows while avoiding Randstad permit queues. Manufacturing users in Eindhoven’s Brainport region co-locate compute adjacent to fabs, using recovered server heat to pre-warm process water and cut overall facility energy 15-20%. Broadly, the shift toward hyperscale cloud concentrates water demand into a smaller set of well-capitalized operators, further professionalizing management practices across the Netherlands data center water consumption market.
Geography Analysis
Amsterdam’s Randstad cluster commanded roughly 85-90% of the installed IT load in 2025; nonetheless, capacity expansion is being throttled by Vitens’ permit backlog and a looming 670 MVA grid capacity cap that forces developers to propose water-neutral and heat-reuse commitments to secure approvals. Pre-leasing still reached 135 MW in H1 2024, owing to AMS-IX interconnection density, underscoring the lock-in effect even as growth migrates north. Municipalities now wield integrated permit powers under Omgevingswet, accelerating or stalling projects based on circular-water credentials.
Northern provinces, notably Groningen, offer exemption from the hyperscale moratorium and host abundant offshore wind connections, drawing Google, QTS, and Microsoft megacampuses that redefine the Netherlands data center water consumption market geography. Groningen municipalities court data centers as post-gas-field anchor industries, streamlining approvals and subsidizing district-heating links that transform water-neutral campuses into civic infrastructure. Rotterdam and Utrecht capture edge deployments redirected from Amsterdam, aided by seaport proximity and nationwide rail links that minimize latency to population centers.
Coastal and estuarine sites exploit seawater cooling options that eliminate potable competition but demand resilient metallurgy and thorough environmental assessments, costs bearable only at 20-MW scale and up. Delta Programme projections of 40% Rhine flow decrease grant structural advantage to Wadden Sea–adjacent provinces where water availability is not tied to continental river inputs. Eindhoven’s Brainport ecosystem illustrates how specialized supply chains and municipal incentives can create localized niches despite modest total capacity, proving the Netherlands data center water consumption market is evolving from a single-core to multi-node geography that balances latency, permits, and water risk.
The data center water consumption market is assessed by Mordor Intelligence through a multi-layered geographic lens, covering other regions such as Europe, Asia, and North America, along with detailed country-level analysis for United Kingdom, Germany, Canada, Mexico, France, and Spain.
Competitive Landscape
Equinix and Interxion control an estimated 40-50% of Amsterdam's colocation load, yet hyperscalers’ captive builds and Dutch cooling specialists, such as Asperitas and Incooling, inject fresh competition into the Netherlands' data center water consumption market. Equinix’s AM4 heat-reuse feasibility with Diemen municipality reflects a pivot toward thermal-service models that can justify premium pricing and differentiate against water-neutral hyperscale campuses. Greenhouse Datacenters leverages secondary-city permits and DC3’s sub-0.4 liter per kWh benchmark to win government and SME clients displaced from permit-constrained Amsterdam.
The MISD consortium’s EU-backed modular edge platform could enable smaller operators to achieve hyperscale-grade water intensity without requiring 100-MW economies, potentially leveling competitive asymmetry in targeted edge nodes. Technology leadership is becoming the primary battleground: immersion solutions that cut water demand up to 99% pair with district-heating revenue streams, whereas legacy air-cooled halls face retrofit costs that can exceed EUR 1 million (USD 1.16 million) per MW and still fall short of ESG targets. Regulatory compliance also shapes market share, particularly in the Energy Efficiency Sector.
Directive’s heat-recovery clause and ISO 14001 client mandates create sizable barriers to new entrants lacking capital or municipal partnerships, gradually consolidating the Netherlands data center water consumption market around well-funded incumbents and public-cloud giants.
Netherlands Data Center Water Consumption Industry Leaders
Equinix Netherlands BV
Interxion Holding NV (Digital Realty)
NorthC Group BV
EdgeConneX Netherlands BV
CyrusOne Netherlands BV
- *Disclaimer: Major Players sorted in no particular order

Recent Industry Developments
- April 2025: Greenhouse Datacenters opened its 2.4 MW DC3 facility in the Rotterdam-The Hague region with a water usage effectiveness of 0.380 liters per kWh and 100% Dutch wind energy sourcing.
- March 2025: Equinix initiated a feasibility study to export waste heat from AM4 to Diemen’s district network, building on prior successes in Helsinki and Paris.
- March 2025: nLighten commissioned a 4.2 MW AMS2 edge facility and launched a heat-recovery feasibility study for Amsterdam’s district grid.
- February 2025: Asperitas debuted the DFCX immersion platform, delivering up to 5 kW per RU with 99% heat capture at 60 °C through partnerships with Shell, Dell, and STULZ.


Netherlands Data Center Water Consumption Market Report Scope
The Netherlands Data Center Water Consumption Market Report is Segmented by Source of Water Procurement (Potable Water, Non-Potable Water including Greywater and Treated Sewage and Recycled, Alternate Source including Groundwater and Surface Water and Rainwater and Seawater and Produced Water), Data Center Cooling Technology (Indirect Adiabatic Cooling, Direct Adiabatic Cooling, Chilled Water Systems, Direct-to-Chip Liquid Cooling, Immersion Cooling, Rear-Door Heat Exchangers), Data Center Type (Enterprise, Colocation, Cloud Service Providers, Edge or Modular), Data Center Size (Mega over 100 MW, Massive 50-100 MW, Large 20-50 MW, Medium 5-20 MW, Small under 5 MW), End-User Industry (IT and Telecom, Banking and Finance, Government and Public Sector, Healthcare, Manufacturing, Other End-User Industry)The Market Forecasts are Provided in Terms of Volume in Liters.
The Netherlands data center water consumption market refers to the assessment and measurement of water volumes utilized by data centers of varying sizes and types across the country. It includes potable, non-potable, and alternative water sources used to support diverse cooling technologies such as adiabatic, chilled water, and advanced liquid cooling systems. Overall, the market tracks and forecasts water consumption in liters, reflecting the sector’s focus on efficient and sustainable resource use in IT, telecom, financial services, government, healthcare, and other industries.
| Smartphones |
| Laptops |
| Tablets |
| Wearables |
| On-Premises |
| Cloud |
| Hybrid |
| Mobile Device Management (MDM) |
| Mobile Application Management (MAM) |
| Mobile Threat Defense (MTD) |
| Unified Endpoint Management (UEM) |
| Identity and Access Management for Mobility |
| Small and Medium Enterprises |
| Large Enterprises |
| Banking and Insurance |
| Healthcare |
| IT and Telecom |
| Government |
| Retail and eCommerce |
| Manufacturing |
| Other End-User |
| By Device | Smartphones |
| Laptops | |
| Tablets | |
| Wearables | |
| By Deployment Model | On-Premises |
| Cloud | |
| Hybrid | |
| By Security Type | Mobile Device Management (MDM) |
| Mobile Application Management (MAM) | |
| Mobile Threat Defense (MTD) | |
| Unified Endpoint Management (UEM) | |
| Identity and Access Management for Mobility | |
| By Organization Size | Small and Medium Enterprises |
| Large Enterprises | |
| By End-User | Banking and Insurance |
| Healthcare | |
| IT and Telecom | |
| Government | |
| Retail and eCommerce | |
| Manufacturing | |
| Other End-User |


Key Questions Answered in the Report
How large is the Netherlands data center water consumption market in 2026?
The market is valued at USD 146.66 billion in 2026 and is projected to grow to USD 169.85 billion by 2031.
Which cooling technology is expanding fastest in Dutch data centers?
Direct-to-chip liquid cooling leads with a 19.02% CAGR through 2031 as AI racks exceed 40 kW density.
Why are data centers relocating capacity to Groningen and Hollands Kroon?
These municipalities are exempt from the 2024 hyperscale ban and offer grid headroom, renewable power, and looser abstraction rules.
What share of water procurement came from potable sources in 2025?
Potable connections comprised 61.35% of procurement, though non-potable systems are rising quickly.
How are operators addressing community concerns about water usage?
They deploy closed-loop cooling, harvest rainwater, and export recovered heat to municipal networks to gain social license.
Page last updated on:


