United States Data Center Water Consumption Market Size and Share
Market Overview
| Study Period | 2019 - 2030 |
|---|---|
| Forecast Data Period | 2025 - 2030 |
| Historical Data Period | 2019 - 2023 |
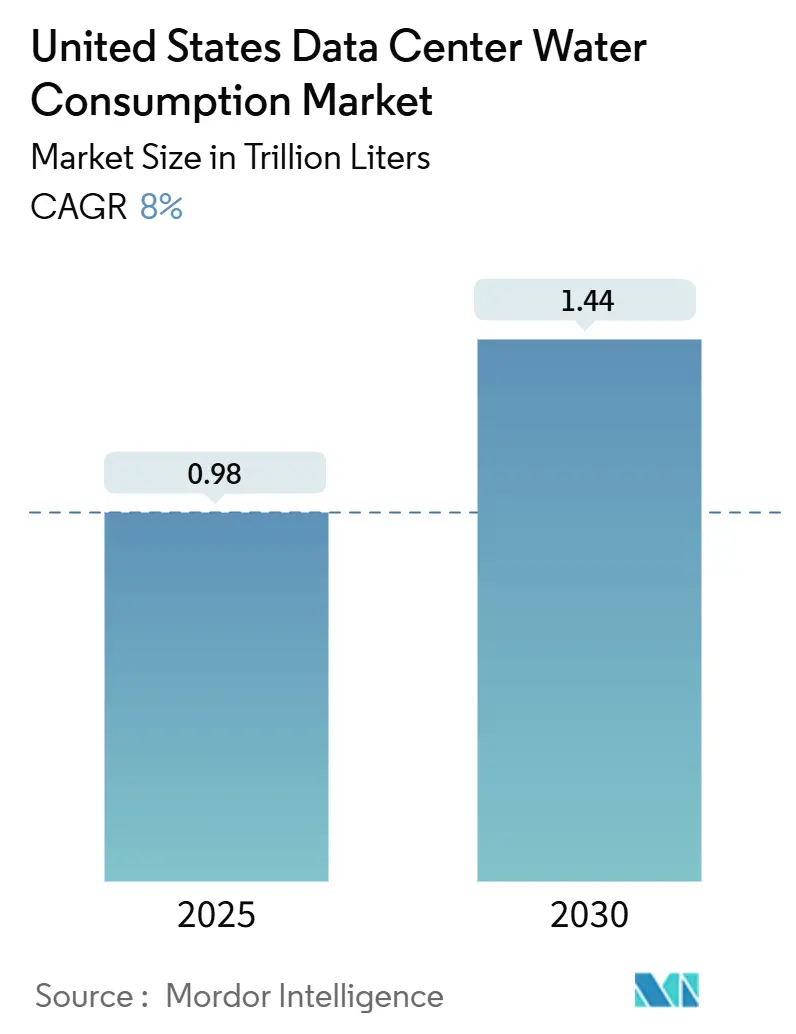
| Market Volume (2025) | 0.98 Trillion liters |
| Market Volume (2030) | 1.44 Trillion liters |
| Growth Rate (2025 - 2030) | 8.00% CAGR |
| Market Concentration | Medium |
Major Players *Disclaimer: Major Players sorted in no particular order Image © Mordor Intelligence. Reuse requires attribution under CC BY 4.0. | |
United States Data Center Water Consumption Market Analysis by Mordor Intelligence
The United States data center water consumption market size measured 0.98 trillion liters in 2025 and is projected to reach 1.44 trillion liters by 2030, reflecting an 8% CAGR. Accelerated AI build-outs, stricter water regulations, and federal tax incentives are converging to reshape cooling strategies and encourage operators to adopt reclaimed and non-potable water sources. Direct-to-chip liquid cooling, which reduces Water Usage Effectiveness (WUE) by up to 30%, is transitioning from the pilot stage to mainstream deployment, providing early adopters with cost and site-selection advantages. At the same time, cloud majors’ 2030 water-positive pledges are turning water procurement into a board-level priority, while escalating municipal tariffs are intensifying the search for closed-loop systems. As a result, the United States data center water consumption market is transitioning from cost-based to stewardship-based competition, an inflection that will influence site locations, vendor partnerships, and technology roadmaps across the decade.
Key Report Takeaways
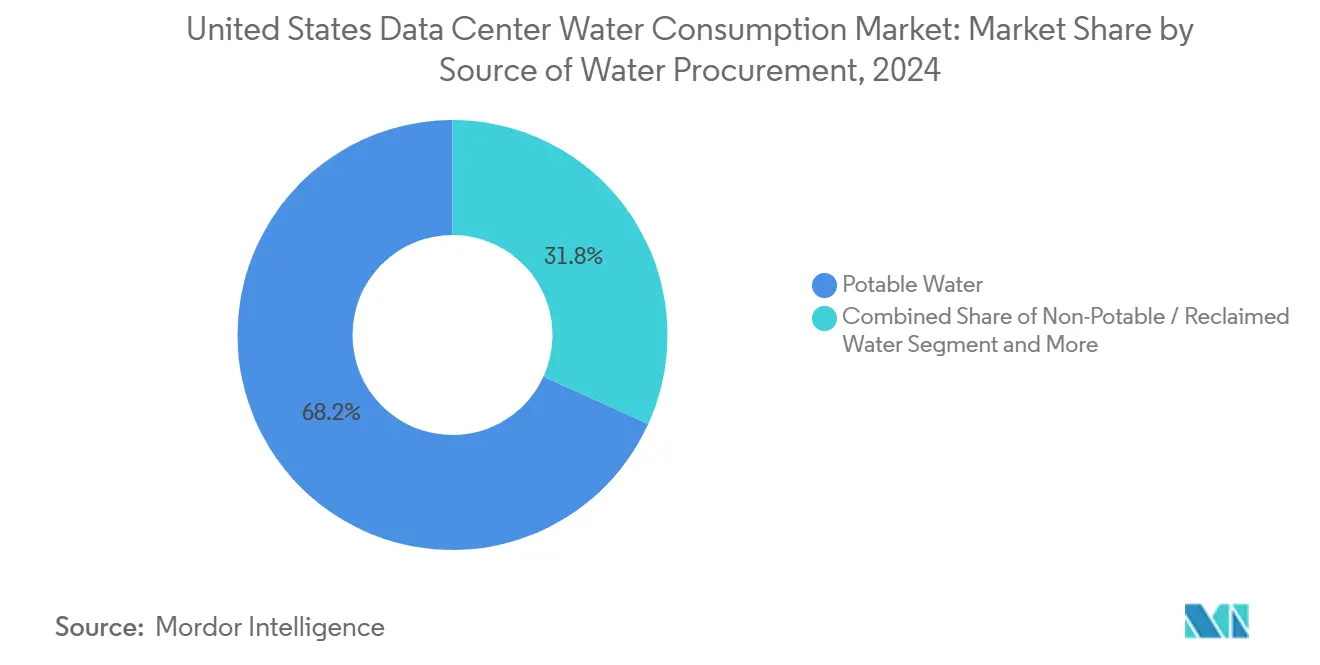
- By source of water procurement, potable supplies held 68.2% of the United States' data center water consumption market share in 2024, whereas non-potable and reclaimed sources are projected to advance at a 9.3% CAGR through 2030.
- By data center type, cloud service providers commanded a 46.7% revenue share of the United States data center water consumption market size in 2024; edge and micro-colocation facilities are expected to expand at a 10.7% CAGR through 2030.
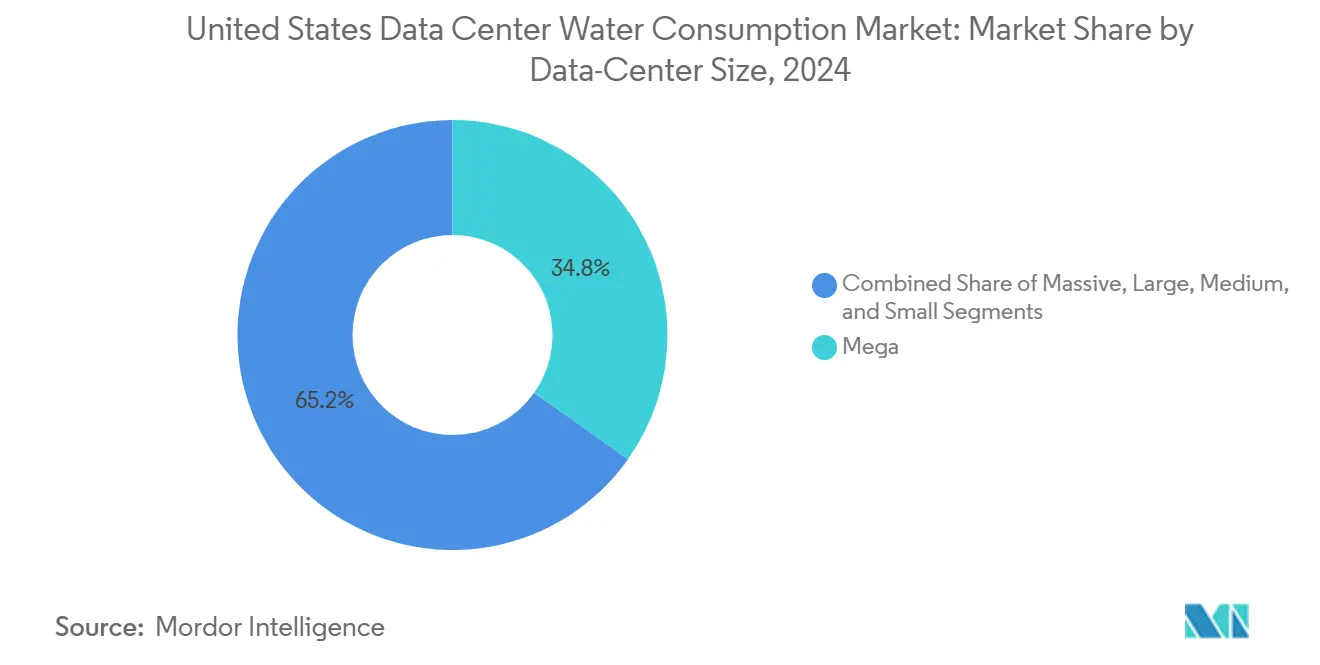
- By data center size, mega-scale installations accounted for a 34.8% share of the United States data center water consumption market size in 2024, while massive-scale deployments are expected to exhibit a 10.1% CAGR between 2025 and 2030.
United States Data Center Water Consumption Market Trends and Insights
Drivers Impact Analysis
| Driver | (~) % Impact on CAGR Forecast | Geographic Relevance | Impact Timeline |
|---|---|---|---|
| Exploding AI/ML workloads accelerating hyperscale build-outs | +2.1% | Global, concentrated in West and South regions | Medium term (2-4 years) |
| Federal tax incentives for reclaimed-water infrastructure | +1.3% | National, with early gains in California, Texas, Virginia | Short term (≤ 2 years) |
| Cloud majors’ “water-positive” pledges intensifying procurement of non-potable water | +1.8% | Global, priority in water-stressed regions | Long term (≥ 4 years) |
| Rising adoption of direct-to-chip liquid cooling (lowers WUE 20-30%) | +0.9% | North America, led by hyperscale deployments | Medium term (2-4 years) |
| Edge data-center proliferation in Tier-2 US cities | +1.2% | Midwest and South regions primarily | Long term (≥ 4 years) |
| Revenue-grade metering mandates by state regulators | +0.7% | California, Texas, Virginia leading adoption | Short term (≤ 2 years) |
| Source: Mordor Intelligence | |||
Exploding AI/ML Workloads Accelerating Hyperscale Build-Outs
Training and inference for large language models drive power densities from 5-10 kW to 40-60 kW per rack, forcing operators to pivot toward liquid cooling that can raise absolute water draw even while improving WUE. Google’s USD 20 billion partnership with Intersect Power to co-site renewable energy and data centers exemplifies integrated energy-water planning that underpins rapid capacity expansion. [1]Google Infrastructure Blog, “Intersect Power Partnership for Integrated Clean Energy Campuses,” google.com In this context, the United States data center water consumption market is expected to feel sustained upward pressure through 2028 as GPU clusters proliferate.
Federal Tax Incentives for Reclaimed-Water Infrastructure (IRA-2022)
Section 179D now offers deductions up to USD 1.00 per ft² for facilities achieving 50% energy savings, effectively subsidizing closed-loop water systems and on-site treatment plants. Microsoft’s Quincy campus leverages a USD 31 million reuse utility that saves 138 million gallons annually, illustrating how operators convert tax savings into water-saving CAPEX. [2]Internal Revenue Service, “Section 179D Energy-Efficient Commercial Buildings Deduction,” irs.govThese incentives accelerate technology payback periods and deepen the addressable pool for non-potable projects, cementing water stewardship as a competitive advantage in the United States data center water consumption market.
Cloud Majors’ Water-Positive Pledges Intensifying Procurement of Non-Potable Water
Amazon aims to return 8 billion liters per year to local basins and maintains a fleet-wide WUE of 0.19 L/kWh. Microsoft targets net-water-positive operations by 2030, pushing suppliers toward brackish, rainwater, and recycled sources. [3]Microsoft Sustainability Team, “2025 Environmental Sustainability Report,” microsoft.com Because hyperscale operators shape multiyear colocation and equipment contracts, their procurement criteria ripple across the broader United States data center water consumption market, lifting demand for advanced treatment membranes, modular reuse skids, and AI-based leak-detection software.
Rising Adoption of Direct-to-Chip Liquid Cooling (Lowers WUE 20-30%)
Nvidia GB200 NVL72 systems operate in closed loops that claim 300-fold water efficiency gains over evaporative towers.[4]Nvidia, “GB200 NVL72 System Architecture White Paper,” nvidia.com Digital Realty rolled out a liquid-to-chip platform across 170 sites and reports power densities up to 150 kW per rack with substantially lower make-up water. As capital costs fall, liquid cooling is set to penetrate enterprise and edge formats, reinforcing an 8% CAGR for the United States data center water consumption market without proportionate rises in water demand.
Restraints Impact Analysis
| Restraint | (~) % Impact on CAGR Forecast | Geographic Relevance | Impact Timeline |
|---|---|---|---|
| Heightened public scrutiny around hyperscale facilities in drought-prone counties | -1.4% | West region, particularly California and Nevada | Short term (≤ 2 years) |
| Escalating municipal “true-cost” water tariffs for industrial users | -0.8% | California, Texas, Arizona leading price increases | Medium term (2-4 years) |
| Supply-chain bottlenecks for high-grade recycled-water piping | -0.6% | National, affecting new construction timelines | Short term (≤ 2 years) |
| Uncertain permitting timelines for on-site desalination/ground-water wells | -0.9% | California, Arizona, Nevada primarily | Long term (≥ 4 years) |
| Source: Mordor Intelligence | |||
Heightened Public Scrutiny in Drought-Prone Counties
Google’s South Carolina well-withdrawal plan and a 7.6 million-liter-per-day Chile proposal drew community backlash, illustrating how public sentiment can stall projects even after regulatory sign-off. In Arizona, conditional permits increasingly hinge on third-party hydrology studies, adding months to approvals. These dynamics inject timeline risk into the United States data center water consumption market and steer operators toward water-abundant regions or zero-water designs.
Escalating Municipal “True-Cost” Tariffs
Los Angeles’ Tier 1 industrial rates rose to USD 8.129 per 100 cu ft in 2024, while new California rules enable fines of USD 10,000 per day for non-compliance with conservation targets. Similar frameworks in Texas and Nevada lift operating expenses by 40-60%, pressing facility managers to retrofit with reuse loops. The specter of escalating tariffs tempers demand in water-scarce metros but simultaneously accelerates efficiency investment across the United States data center water consumption market.
Segment Analysis
By Source of Water Procurement: Alternative Streams Gain Traction
Potable supplies accounted for 68.2% of the United States data center water consumption market in 2024, underscoring legacy dependence on municipal lines. Non-potable and reclaimed alternatives, however, are rising at a 9.3% CAGR as operators adopt rainwater capture, brackish-water treatment, and tertiary-effluent reuse. Amazon now runs recycled-water systems in 20 facilities, while Digital Realty hit 43% non-potable use in 2023. California’s upcoming onsite reuse code places clear guardrails around treatment quality, paving the way for standardized rollouts.
Early adopters report meaningful savings: a Seattle hyperscale campus reduced utility-grade withdrawals by 70% within 12 months, shifting the regional narrative on data center water burden. These precedents strengthen investor confidence and reinforce a cumulative move toward circular-water designs in the United States data center water consumption market.


By Data-Center Type: Edge Facilities Redefine Demand Curves
Cloud hyperscalers controlled 46.7% of 2024 consumption but edge and micro-colocation sites now chart a 10.7% CAGR as latency-sensitive AI inference moves nearer to end users. Edged Data Centers opened water-free sites in Texas and Arizona capable of saving 94-95 million gallons annually, illustrating how design innovation can mitigate localized scarcity. The United States data center water consumption market size for edge deployments is poised to advance rapidly, though absolute volumes remain smaller than hyperscale.
Hybrid enterprises are also re-architecting cooling. QTS’s Cedar Rapids campus will use a water-free platform across 250 MW, demonstrating how colocation providers translate sustainability mandates into tenant value propositions.
By Data-Center Size: Massive Deployments Lead Efficiency Innovation
Mega-scale halls captured 34.8% of 2024 volume, but massive-scale sites, those topping 300 MW are expanding at a 10.1% CAGR. Microsoft’s forthcoming zero-water architecture targets the largest campuses first, where economies of scale justify capital-intensive closed-loop systems. The United States data center water consumption market size for massive facilities is expected to double by 2030, even as per-MW withdrawals fall.
Medium and small-scale builds focus on modular chillers and hybrid cooling that modulate water draw in step with load. This layered approach helps operators meet community expectations while retaining flexibility for future AI hardware generations.
Geography Analysis
The West’s primacy stems from entrenched hyperscale clusters in Silicon Valley, Phoenix, and Reno, yet rising tariffs and groundwater limits are nudging builders toward seawater-cooled designs and desalinated make-up streams. California’s onsite reuse code, effective 2025, provides regulatory clarity but adds compliance costs that only the largest players can absorb. Nevada’s streamlined permitting offsets some friction, keeping the West vital to the United States data center water consumption market, though expansion rates are slowing relative to other regions.
The South blends regulatory speed with cost-competitive power, allowing Texas and Georgia campuses to scale quickly. Virginia’s data centers already use 2% of Potomac basin flows and could reach 33% by 2050 without intervention. Operators pre-emptively deploy closed-loop towers and condensate recovery to stay ahead of possible moratoria. These measures help balance growth, yet sustained tariff hikes could shift marginal projects northward.
The Midwest benefits from the Great Lakes Compact, which guards freshwater withdrawals but still offers ample allocations for industrial users. Data center build-outs around Chicago and Columbus leverage surface-water intakes to avoid aquifer stress, while Minnesota’s municipalities debate per-rack water taxes to mitigate long-term supply risks. Overall, lower scarcity premiums underpin the region’s 11.2% CAGR, making it the fastest-growing geography in the United States data center water consumption market.
Competitive Landscape
Amazon, Microsoft, and Google collectively control around 60% of hyperscale capacity, giving them outsize influence on technology standards and water-source procurement. Amazon’s 8 billion-liter annual replenishment target sets a high bar for stewardship, prompting peers to emulate similar programs. Microsoft’s zero-water campus initiative and Google’s integrated renewable-water campuses showcase proprietary innovation cycles that smaller operators cannot match. These moves elevate the competitive threshold within the United States data center water consumption market.
Colocation specialists such as Digital Realty and QTS compete by standardizing advanced cooling into multi-tenant offerings. Digital Realty’s partnership with Ecolab deploys AI analytics to predict scaling, corrosion, and bio-fouling in tower loops, enhancing uptime while shrinking withdrawals. Edge players like Edged and Vapor IO differentiate with dry-cooler or waterless designs suited to municipal constraints, capturing demand from latency-critical applications.
Strategic collaborations dominate investment flows. The BlackRock-Microsoft USD 30 billion AI infrastructure fund links capital access to sustainable design criteria, accelerating best-practice diffusion across the United States data center water consumption industry. Supply-chain vendors of membranes, ceramic filters, and corrosion-resistant piping report order backlogs exceeding 18 months, pointing to tight component markets that could shape deployment timelines through 2027.
United States Data Center Water Consumption Industry Leaders
Google LLC
Microsoft Corporation
Amazon Web Services Inc.
Meta Platforms Inc.
Digital Realty Trust
- *Disclaimer: Major Players sorted in no particular order

Recent Industry Developments
- June 2025: Amazon announced a comprehensive water-sustainability program for Georgia data centers, integrating recycled-water systems and watershed replenishment.
- June 2025: QTS unveiled a USD 750 million Cedar Rapids campus featuring water-free cooling for high-density AI compute.
- May 2025: Digital Realty deployed liquid-to-chip cooling across 170 sites, enabling 30-150 kW per rack without conventional towers.
- January 2025: Microsoft confirmed the launch of zero-water data centers by 2026, based on closed-loop heat-rejection technology.


United States Data Center Water Consumption Market Report Scope
The study examines the critical applications of water in large data centers, including cooling and power generation. It includes key applications based on water consumption in data centers and quantifies overall water usage in billion liters across regions. The study also identifies underlying trends and developments conceptualized by leading industry data center operators.
The United States Data Center Water Consumption Market is Segmented by Source of Water Procurement (Potable Water, Non-Potable / Reclaimed, and Alternate Sources), Data-Center Type (Enterprise, Colocation, and Cloud Service Providers), and Data-Center Size ( Mega, Massive, Large, Medium, and Small). The Market Forecasts are Provided in Terms of Volume.
| Potable Water |
| Non-Potable / Reclaimed Water |
| Alternate Sources (ground, surface, sea, rain, OandG produced) |
| Enterprise |
| Colocation |
| Cloud Service Providers |
| Mega |
| Massive |
| Large |
| Medium |
| Small |
| By Source of Water Procurement | Potable Water |
| Non-Potable / Reclaimed Water | |
| Alternate Sources (ground, surface, sea, rain, OandG produced) | |
| By Data-Center Type | Enterprise |
| Colocation | |
| Cloud Service Providers | |
| By Data-Center Size | Mega |
| Massive | |
| Large | |
| Medium | |
| Small |


Key Questions Answered in the Report
What is the current size of the United States data center water consumption market?
The market stood at 0.98 trillion liters in 2025 and is forecast to hit 1.44 trillion liters by 2030, growing at an 8% CAGR.
Which U.S. region is growing fastest for data center water demand?
The Midwest is fastest growing region in United States because of ample freshwater supplies and comparatively streamlined regulations.
How are cloud providers reducing water usage?
Strategies include direct-to-chip liquid cooling, onsite water reuse plants, and procurement of non-potable sources, supporting water-positive pledges by 2030.
What role do federal incentives play in water efficiency?
Section 179D of the Inflation Reduction Act allows deductions up to USD 1.00 per ft² for energy-efficient facilities, accelerating adoption of recycled-water infrastructure.
Page last updated on:


