
Technology, Media and Telecom
5th MayPricing Strategy for Semiconductor Components
3 Min Read
The Study of Data Center Water Consumption in China Report is Segmented by Source of Water Procurement (Potable Water, Non-Potable Water, Alternate Sources), by Data Center Type (Enterprise, Colocation, Cloud Service Providers), and by Data Center Size (Mega, Massive, Large, Medium, Small). The Market Sizes and Forecasts are Provided in Terms of Volume (Billion Liters).
Market Overview
| Study Period | 2022 - 2031 |
|---|---|
| Base Year For Estimation | 2025 |
| Forecast Data Period | 2026 - 2031 |
| Market Volume (2026) | 248.35 Billion liters |
| Market Volume (2031) | 374.75 Billion liters |
| CAGR | 8.57 % |
| Market Concentration | Medium |
Major Players *Disclaimer: Major Players sorted in no particular order. Image © Mordor Intelligence. Reuse requires attribution under CC BY 4.0. |
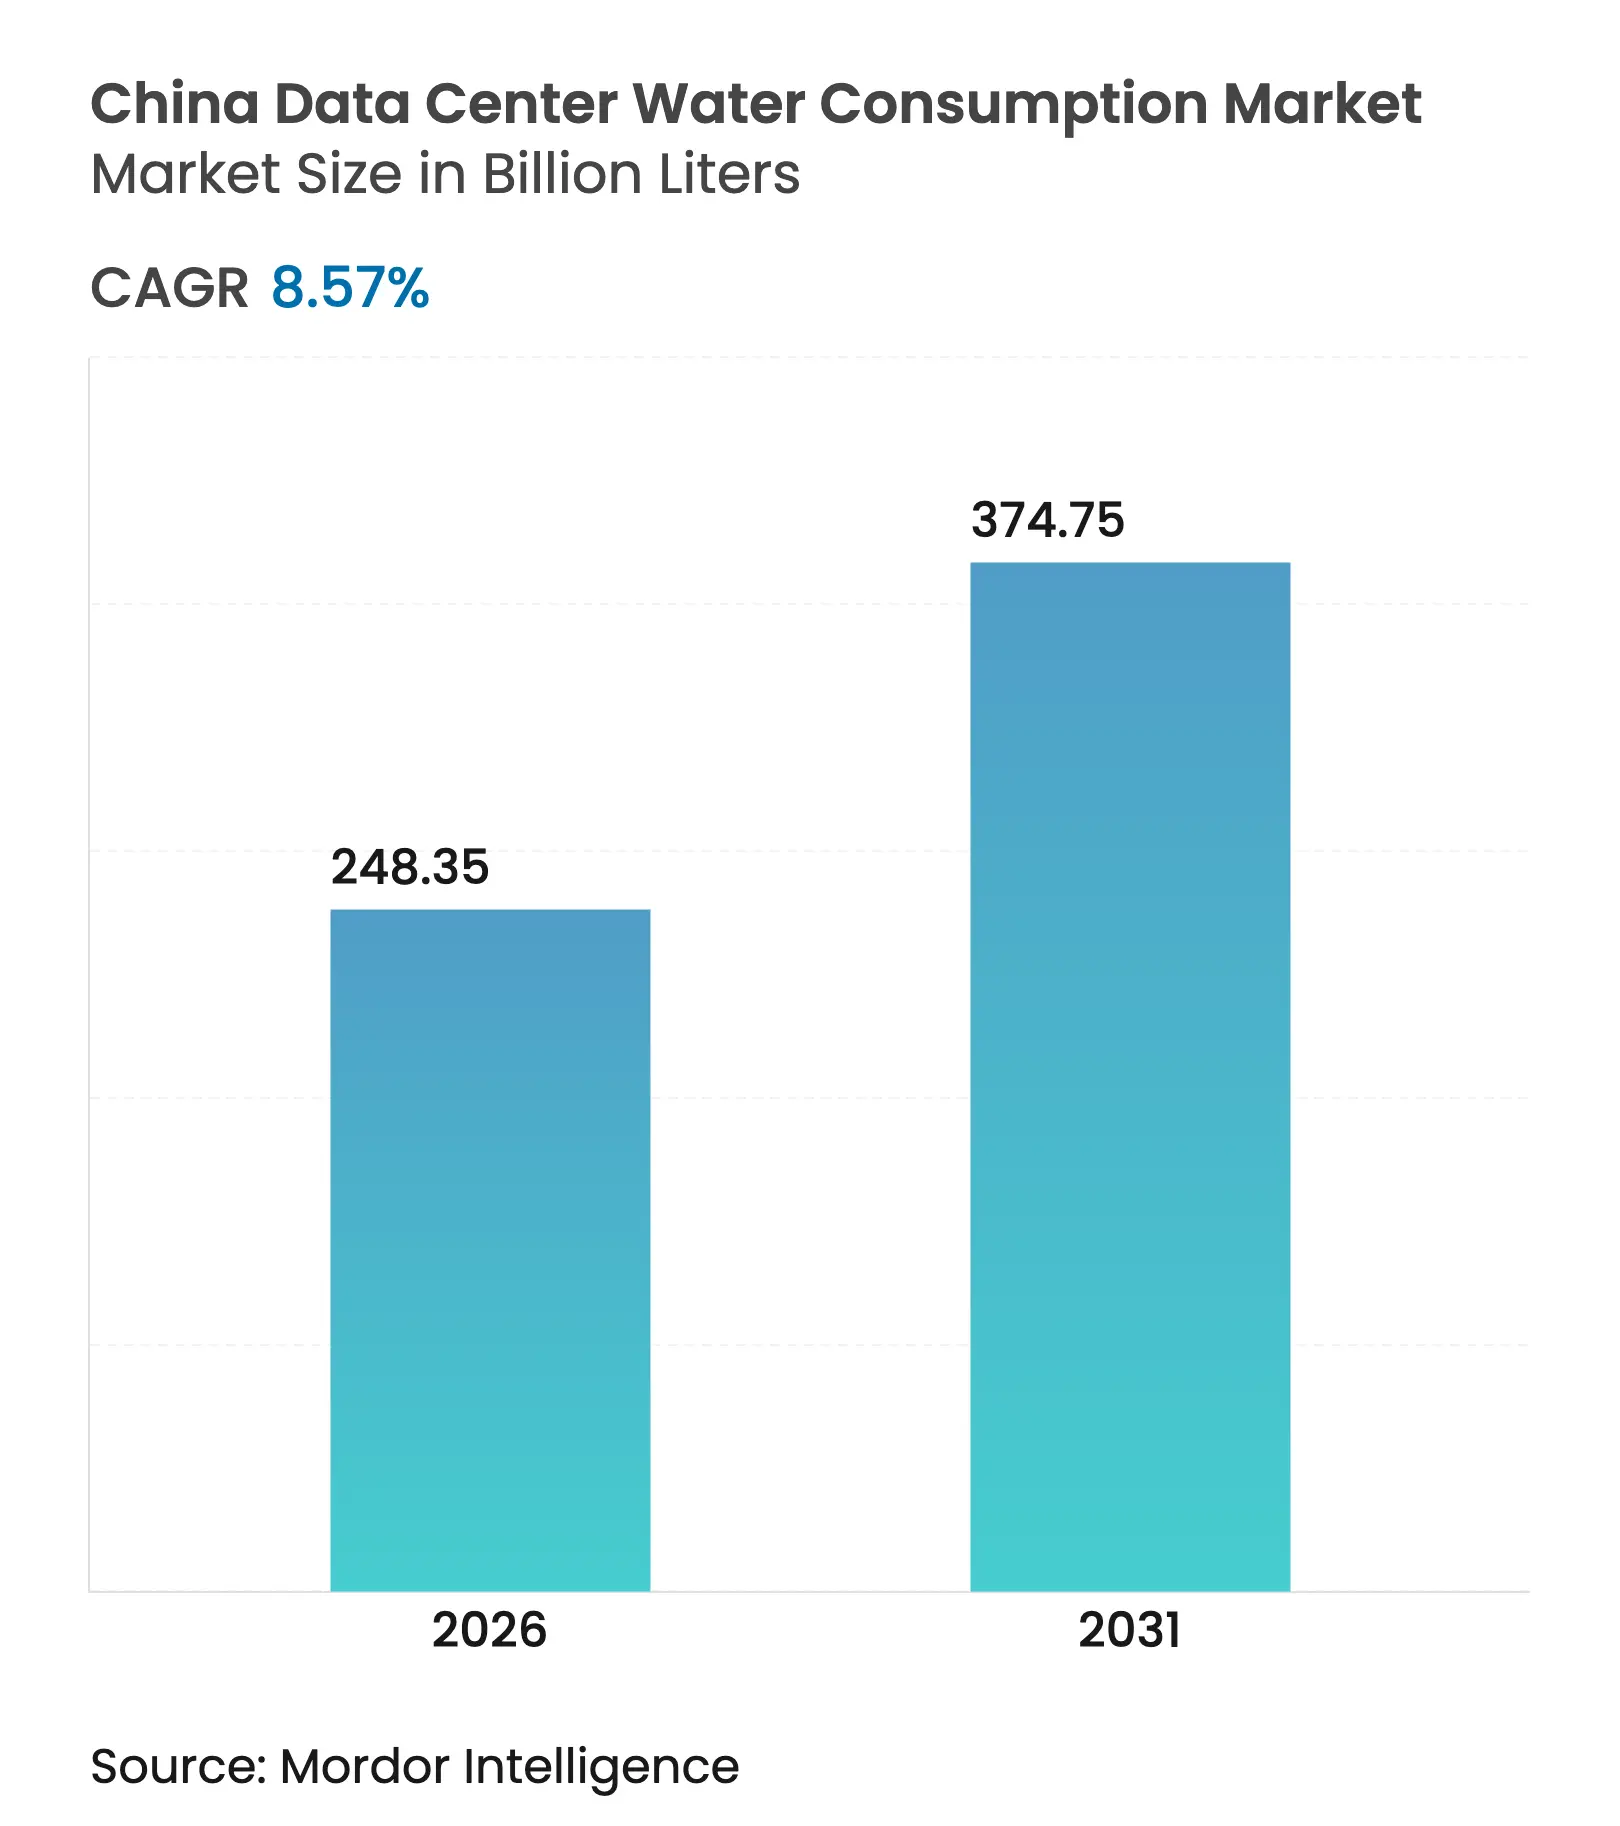
China’s data center water consumption market size in 2026 is estimated at 248.35 billion liters, growing from 2025 value of 228.74 billion liters with 2031 projections showing 374.75 billion liters, growing at 8.57% CAGR over 2026-2031. Surging AI workloads, stringent “dual-carbon” mandates, and relocation of power-hungry workloads to water-scarce western provinces converge to make water efficiency a board-level priority for both state-owned and private operators. Mandatory power-usage-effectiveness (PUE) limits of 1.3 for new builds in Beijing and Shanghai couple energy and water metrics into a single investment screen Beijing Municipal Government. Colocation leaders benefit from scale economics while cloud service providers accelerate adoption of direct-to-chip liquid cooling that can cut evaporative losses by up to 300 times Tom’s Hardware. Nearly half of China’s server farms sit in high or extreme water-stress zones, forcing a pivot to treated wastewater, seawater, and closed-loop cooling. Regulatory quotas now drive the data center water consumption market toward technologies that deliver both rack-level thermal efficiency and portfolio-wide water-use-effectiveness transparency.
Key Report Takeaways
Note: Market size and forecast figures in this report are generated using Mordor Intelligence's proprietary estimation framework, updated with the latest available data and insights as of 2026.
Drivers Impact Analysis
| Driver | (~) % Impact on CAGR Forecast | Geographic Relevance | Impact Timeline | |||
|---|---|---|---|---|---|---|
“Dual-carbon” policy incentives accelerate investment in
water-efficient cooling
“Dual-carbon” policy incentives accelerate investment in
water-efficient cooling
| +1.8% | National; early gains in Beijing, Shanghai, Guangdong | Medium term (2-4 years) | (~) % Impact on CAGR Forecast:
+1.8%
|
Geographic Relevance
:
National; early gains in Beijing, Shanghai, Guangdong
|
Impact Timeline
:
Medium term (2-4 years)
|
Mandatory water-use quotas for hyperscale facilities in
key provinces
Mandatory water-use quotas for hyperscale facilities in
key provinces
| +1.2% | Beijing, Shanghai, Guangdong, Jiangsu | Short term (≤ 2 years) | |||
Rapid rise of AI/ML workloads driving higher rack
densities and liquid-cooling adoption
Rapid rise of AI/ML workloads driving higher rack
densities and liquid-cooling adoption
| +2.1% | National; Tier-1 cities | Medium term (2-4 years) | |||
Government subsidies for industrial wastewater reuse
partnerships
Government subsidies for industrial wastewater reuse
partnerships
| +0.9% | Inner Mongolia, Xinjiang | Long term (≥ 4 years) | |||
Coastal city pilot projects for seawater cooling
Coastal city pilot projects for seawater cooling
| +0.7% | Hainan, Guangdong, Fujian | Long term (≥ 4 years) | |||
Real-time WUE disclosure demanded by major cloud clients
Real-time WUE disclosure demanded by major cloud clients
| +0.8% | Enterprise hubs nationwide | Short term (≤ 2 years) | |||
| Source: Mordor Intelligence | ||||||
“Dual-carbon” policy incentives accelerate investment in water-efficient cooling
The 2024–2025 Energy Conservation and Carbon Reduction Action Plan tasks new data centers with cutting non-fossil energy ratios by 20%, effectively steering capex toward closed-loop liquid cooling that reduces both energy and water demands Government of China. Operators earn preferential electricity tariffs and expedited land approvals when WUE targets are met, turning compliance into a cost advantage. Alibaba has already powered 56% of its cloud footprint with renewables and cut carbon emissions by 63.5%, demonstrating the twin benefit of greener energy and sharply lower evaporative losses South China Morning Post. Early adopters thus lock in access to scarce Tier-1 urban permits and insulate operations from escalating freshwater-withdrawal fees.
Mandatory water-use quotas for hyperscale facilities in key provinces
Beijing obliges new sites to stay below 2.5 liters per kWh of IT load Enviliance ASIA, while Shanghai links PUE ceilings of 1.3 to quota allocations Tencent Cloud. Penalties for exceedance range from stepped tariffs to suspension of expansion phases. The framework pushes greywater recycling and ultrafiltration plants to mainstream status, with best-in-class operators now reporting WUE of 0.2 liters per kWh. Quota trading among campuses creates a secondary market that rewards over-performance, further propelling the data center water consumption market toward circular-water solutions.
Rapid Rise of AI/ML Workloads and Liquid-Cooling Adoption
Large-language-model training drives rack densities above 100 kW, far beyond the 15 kW ceiling of legacy air cooling. Nvidia’s liquid-cooled reference design claims 300-fold water savings versus evaporative systems . Domestic integrators now bundle fluorinated dielectric coolants with high-density GPU clusters, shortening deployment cycles for AI platforms. As a result, the liquid-cooled segment of the data center water consumption market is on track to exceed CNY 133 billion by 2025, and most new hyperscale campuses specify liquid or hybrid cooling in their tender documents.
Government Subsidies for Industrial Wastewater Reuse Partnerships
The National Development and Reform Commission reimburses up to 30% of capex for data centers that co-locate with manufacturing plants to recycle process water. Typical projects channel treated effluent into closed-loop cooling circuits, achieving 85% recovery rates and reducing municipal withdrawals by nearly 70%. In regions where industrial water prices top 15 yuan per m³, these partnerships deliver three-year paybacks while easing grid-and-water permitting. Subsidized schemes underpin long-term resilience of the data center water consumption market in arid western provinces.
Restraints Impact Analysis
| Restraint | (~) % Impact on CAGR Forecast | Geographic Relevance | Impact Timeline | |||
|---|---|---|---|---|---|---|
Increasing freshwater-withdrawal fees in water-stressed
regions
Increasing freshwater-withdrawal fees in water-stressed
regions
| -1.4% | Northern China, Inner Mongolia, Xinjiang | Short term (≤ 2 years) | (~) % Impact on CAGR Forecast:
-1.4%
|
Geographic Relevance
:
Northern China, Inner Mongolia, Xinjiang
|
Impact Timeline
:
Short term (≤ 2 years)
|
Public backlash over mega-data-center builds near
agricultural zones
Public backlash over mega-data-center builds near
agricultural zones
| -0.8% | Hebei, Shandong, Henan | Medium term (2-4 years) | |||
High capex of advanced treatment plants for
grey-/brine-water recycling
High capex of advanced treatment plants for
grey-/brine-water recycling
| -1.1% | National; smaller operators | Medium term (2-4 years) | |||
Uncertain permitting timelines for deep-lake or offshore
cooling projects
Uncertain permitting timelines for deep-lake or offshore
cooling projects
| -0.6% | Coastal regions, major lakes | Long term (≥ 4 years) | |||
| Source: Mordor Intelligence | ||||||
Increasing Freshwater-Withdrawal Fees in Water-Stressed Regions
China’s nationwide water tax, fully rolled out in 2024, prices withdrawals between 0.1 and 3 yuan per m³ depending on scarcity tiers . Data centers in Beijing report cooling water now equals 25% of OPEX, intensifying the business case for treated wastewater. The progressive pricing schedule penalizes high-volume users, nudging the data center water consumption market toward closed-loop designs and alternative sources.
High Capex of Advanced Recycling Plants
Membrane bioreactors, reverse-osmosis skids and UV-oxidation units add up to USD 30 million per 50 MW of IT load, a burden smaller enterprise sites struggle to absorb. Financing hurdles prolong payback periods, especially where power tariffs remain low. Consequently, consolidation accelerates: smaller firms either divest assets or migrate workloads to larger campuses that already meet stringent WUE standards, reinforcing scale dynamics inside the data center water consumption industry.
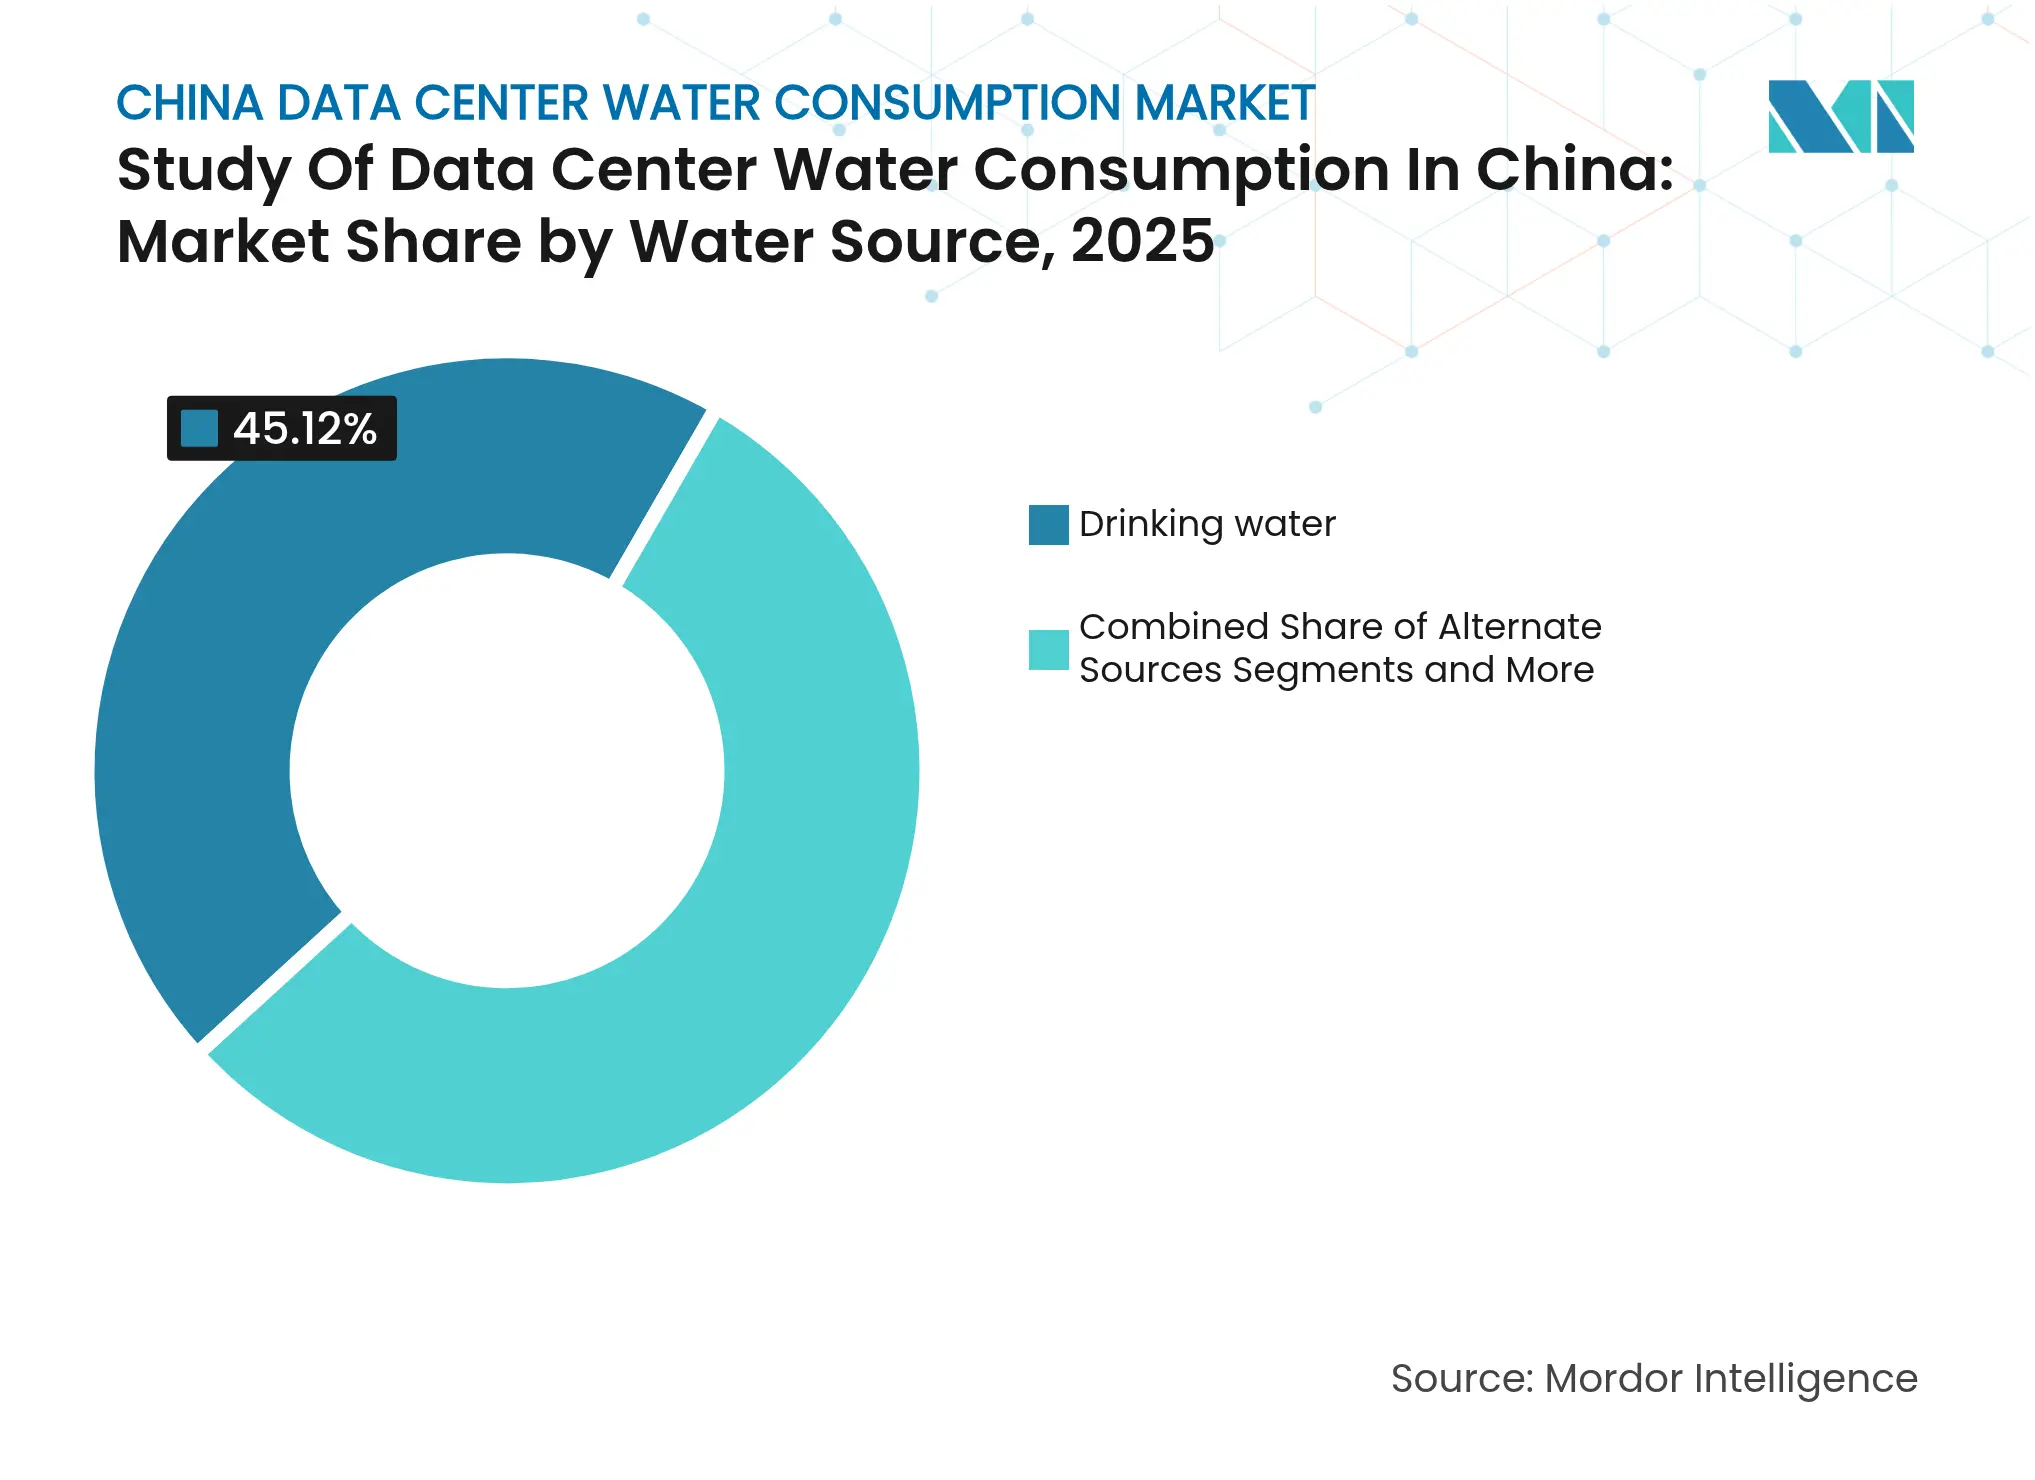
By Water Source: Alternative sources drive sustainability transition
Alternative sources grew 9.18% CAGR through 2031, eroding the 45.12% 2025 dominance of potable water Premier Partners. Municipal-grade treated wastewater now underpins urban facilities, trimming cooling bills by up to 60%. Seawater cooling pilots off Hainan exploit abundant coastal resources and demonstrate viability for AI training clusters. Rain harvesting remains supplementary because seasonal variability limits scale. Groundwater extraction faces growing permit denials to protect aquifers, pushing operators toward closed-loop recirculation.
Alternative water adoption reshapes procurement contracts. Veolia’s first China regeneration hub supplies reclaimed effluent suitable for hyperscale cooling, signaling institutional commitment to long-run water circularity Fluid Handling Pro. Capital markets view off-balance-sheet treatment plants as credit-positive, enabling lower coupon green bonds that fund expansion. Together, these shifts anchor a structural pivot that keeps the data center water consumption market aligned with provincial conservation targets.
Note: Segment shares of all individual segments available upon report purchase
By Data-Center Type: Cloud service providers accelerate capacity expansion
Cloud service providers grew at 10.98% CAGR, outpacing colocation’s 51.65% 2025 revenue share yet remaining below in absolute volume. GDS Holdings secured USD 1 billion for overseas builds while lifting Q3 2024 revenue 17.7%, underscoring investor faith in hyperscale-driven demand GDS Holdings. CSP campuses deploy integrated heat-exchange loops that lower WUE to 0.3 liters per kWh, securing early approvals in Tier-1 cities. Meanwhile, colocation operators leverage multitenant density to justify membrane bioreactor plants, achieving 40% lower water cost per rack than single-tenant sites.
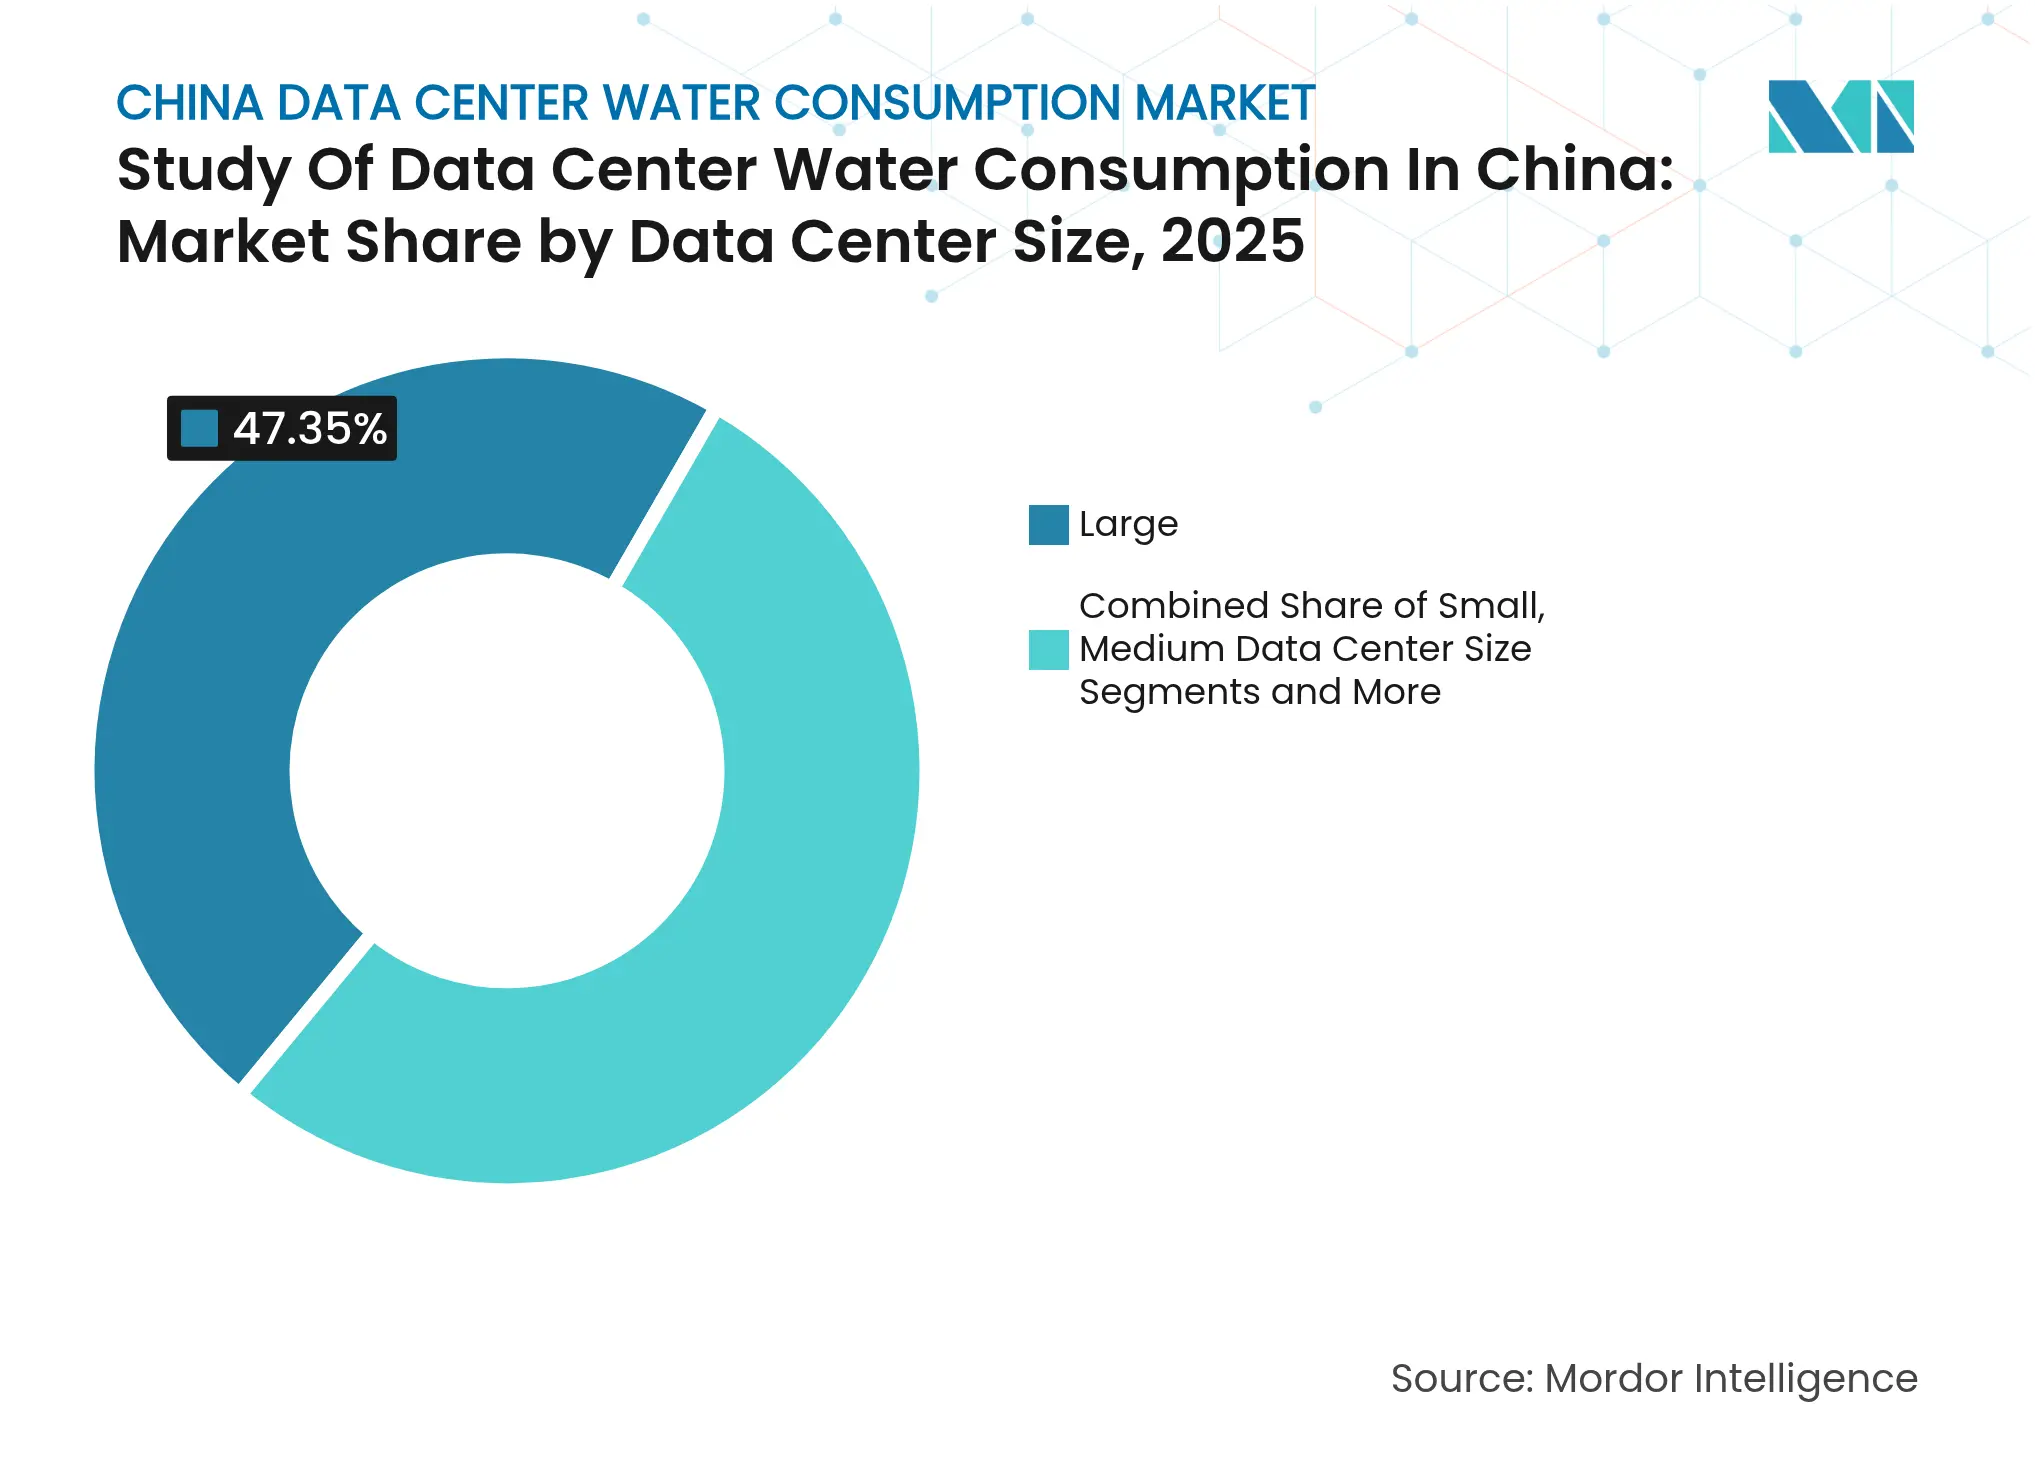
By Data-Center Size: Mega facilities lead innovation adoption
Mega facilities recorded a 10.62% CAGR driven by economies of scale that absorb the high capex of 85%-plus water-recovery systems. China’s underwater cluster at Lingshui showcases how module pooling can eliminate traditional cooling towers Light Reading. Large campuses also monetize waste heat for district networks, converting a cost center into a revenue stream and shortening payback for thermal-storage tanks.
Smaller operators face two options: migrate racks into larger campuses or invest in shared treatment plants through municipal PPP frameworks. Both routes funnel additional volume into mega campuses, reinforcing a virtuous cycle of efficiency improvements that deepens competitive moats.
Note: Segment shares of all individual segments available upon report purchase
Northern provinces, led by Beijing, shoulder the strictest quotas, forcing operators to adopt closed-loop systems that drive the regional data center water consumption market share down to 17.62% despite hosting 25% of compute capacity Enviliance ASIA. Facilities that comply win priority access to renewable-energy certificates, offsetting high retrofit costs. Urban planners also favor combined heat-and-power designs that channel server heat into residential districts, unlocking new revenue and mitigating public scrutiny.
Southern coastal provinces leverage plentiful seawater and progressive pilot programs. Guangdong’s new offshore campus uses direct seawater circulation to cool servers without consuming freshwater, demonstrating how coastal sites can sidestep looming freshwater taxes. Hainan’s underwater pods process 7,000 AI queries per second while the surrounding ocean dissipates heat.
Market Concentration
China Mobile, China Telecom, and China Unicom benefit from nationwide fiber backbones that lower incremental build costs. They bundle connectivity with colocation, locking in enterprise clients through integrated SLAs. Private entrants such as Chindata and GDS Holdings differentiate via WUE dashboards audited in real time, satisfying ESG-minded tenants. International players Equinix and Digital Realty import global best practices, including ash-free corrosion inhibitors that extend loop life and further trim water intensity Light Reading.
Technology roadmaps dominate competitive positioning. Early adopters of fluorinated dielectric coolants gain a thermal headroom edge that suits AI matrix math. Underwater data center pioneers, currently a niche cohort, can bypass freshwater entirely and may disrupt inland incumbents if module costs fall toward parity. As smaller operators struggle to meet quota stringency, acquisition opportunities emerge for capital-rich groups keen to roll up sub-scale assets and retrofit them to closed loops.

*Disclaimer: Major Players sorted in no particular order
1. INTRODUCTION
2. RESEARCH METHODOLOGY
3. EXECUTIVE SUMMARY
4. MARKET LANDSCAPE
5. DATA CENTER INDUSTRY OUTLOOK
6. MARKET SIZE and GROWTH FORECASTS (VOLUME)
7. COMPETITIVE LANDSCAPE
8. MARKET OPPORTUNITIES and FUTURE OUTLOOK
The study tracks the critical applications of water for running a large data centers, such as DC cooling, and power generation. The study also includes key applications based on the Water Consumption in Data Centers. The study also includes the overall water consumption based on the DC footprint across regions in terms of billion liters. Lastly, the study tracks the underlying trends and developments conceptualized by leading industry data center operators and cloud service providers.
The Study of Data Center Water Consumption in China is Segmented by Source of Water Procurement (Potable Water, Non-Potable Water, Other Alternate Sources), by Data Center Type (Enterprise, Colocation, Cloud Service Providers), and by Data Center Size (Mega, Massive, Large, Medium, Small). The Market Sizes and Forecasts are Provided in Terms of Volume (Billion Liters).
Pricing Strategy for Semiconductor Components
3 Min Read
Accelerating Additive Manufacturing Adoption in India
3 Min Read
Unlocking Growth in India’s Luxury Beauty & Skincare Market
3 Min Read
When decisions matter, industry leaders turn to our analysts. Let’s talk.