
Technology, Media and Telecom
5th MayPricing Strategy for Semiconductor Components
3 Min Read
The Study of Data Center Water Consumption in the Middle East and Africa Market is Segmented by Source of Water Procurement (Potable Water, Non-Portable, and More), Data Center Type (Enterprise, Colocation, and More), Data Center Size (Small, Medium, Large and More), Cooling Technology (Chilled-Water Systems, Indirect Evaporative, and More), and by Geography. The Market Forecasts are Provided in Terms of Volume (Billion Liters).
Market Overview
| Study Period | 2021 - 2031 |
|---|---|
| Base Year For Estimation | 2025 |
| Forecast Data Period | 2026 - 2031 |
| Market Volume (2026) | 153.25 Billion liters |
| Market Volume (2031) | 535.71 Billion liters |
| CAGR | 28.43 % |
| Market Concentration | Medium |
Major Players *Disclaimer: Major Players sorted in no particular order. Image © Mordor Intelligence. Reuse requires attribution under CC BY 4.0. |
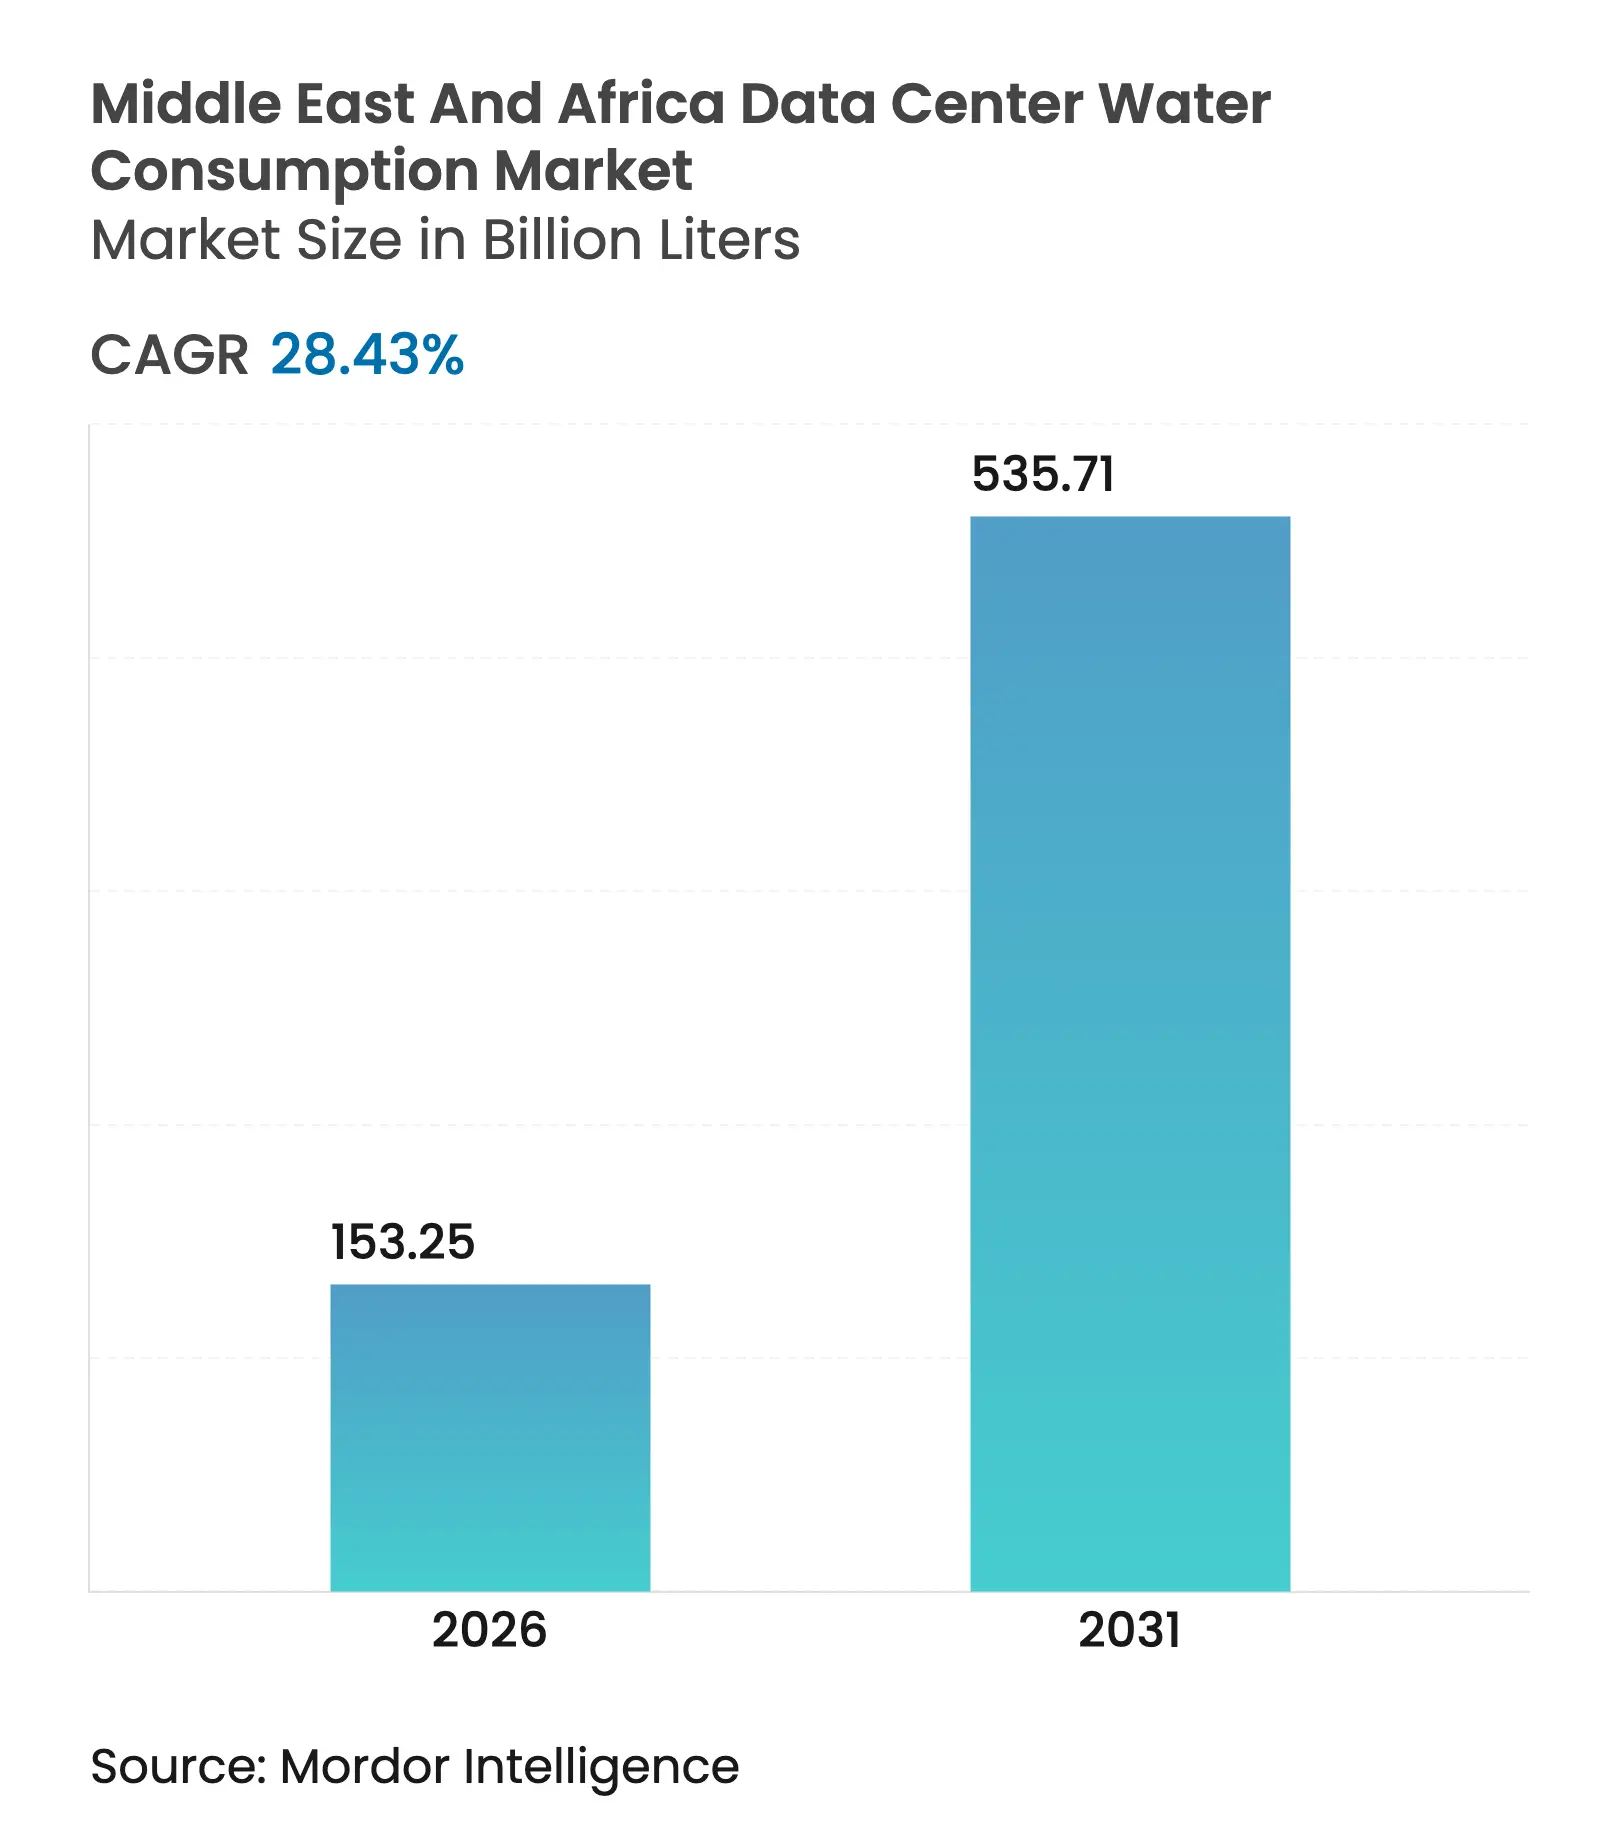
The Middle East & Africa data center water consumption market size is expected to grow from 119.34 billion liters in 2025 to 153.25 billion liters in 2026 and is forecast to reach 535.71 billion liters by 2031 at 28.43% CAGR over 2026-2031. The jump aligns with rapid build-outs of new capacity across the Gulf Cooperation Council, intensifying adoption of liquid-based cooling that safeguards equipment in ambient temperatures often above 40 °C. Surging AI inference and training clusters are elevating rack densities to 250 kW, tripling typical heat loads and lifting cooling water demand. Operators are responding with closed-loop systems, desalination tie-ins, and onsite treatment that recycle up to 96% of process water. The interplay of national water-security mandates and hyperscale growth is setting clear commercial incentives to cut municipal withdrawals, making water stewardship a front-of-mind metric for customers and investors alike.
Key Report Takeaways
Note: Market size and forecast figures in this report are generated using Mordor Intelligence's proprietary estimation framework, updated with the latest available data and insights as of 2026.
Drivers Impact Analysis
| Driver | (~) % Impact on CAGR Forecast | Geographic Relevance | Impact Timeline | |||
|---|---|---|---|---|---|---|
GCC Net-Zero Water Policies Accelerating Closed-Loop Cooling Adoption GCC Net-Zero Water Policies Accelerating Closed-Loop Cooling Adoption | +3.4% | GCC (UAE, Saudi Arabia, Qatar, Oman, Bahrain, Kuwait) | Medium term (2-4 years) | (~) % Impact on CAGR Forecast:+3.4% | Geographic Relevance:GCC (UAE, Saudi Arabia, Qatar, Oman, Bahrain, Kuwait) | Impact Timeline:Medium term (2-4 years) |
AI & High-Density Workloads Boosting Advanced Water-Cooling Demand AI & High-Density Workloads Boosting Advanced Water-Cooling Demand | +9.5% | Global, with concentration in UAE and Saudi Arabia | Short term (≤ 2 years) | |||
Rising Middle-East Water Tariffs Driving Re-use Investments Rising Middle-East Water Tariffs Driving Re-use Investments | +4.2% | GCC, Levant, North Africa | Medium term (2-4 years) | |||
Expansion of Edge DCs in Sub-Saharan Africa Leveraging Local Non-Potable Sources Expansion of Edge DCs in Sub-Saharan Africa Leveraging Local Non-Potable Sources | +2.8% | East Africa, West Africa, Southern Africa | Long term (≥ 4 years) | |||
Large-Scale Renewable-Powered Desalination Co-location Opportunities Large-Scale Renewable-Powered Desalination Co-location Opportunities | +1.5% | GCC core, spill-over to North Africa | Long term (≥ 4 years) | |||
ESG-Linked Financing Incentives for Water-Efficiency Retrofits ESG-Linked Financing Incentives for Water-Efficiency Retrofits | +2.3% | Global, with early gains in UAE, South Africa, Kenya | Medium term (2-4 years) | |||
| Source: Mordor Intelligence | ||||||
GCC Net-Zero Water Policies Accelerating Closed-Loop Cooling Adoption
Gulf governments now require data center developments to meet strict water neutrality targets. The United Arab Emirates is pushing leakage detection systems that cut non-revenue water to 13%, while a 2025 regional task force coordinates desalination upgrades and wastewater recycling programs.[1]Gulf Research Center, "Recent GCC Joint Environmental Initiatives", grc.net Data center operators are therefore deploying sealed chilled-water loops with adiabatic free cooling that bring Water Usage Effectiveness readings near zero. A single hyperscale campus can now avoid 95 million gallons of annual withdrawals compared with evaporative towers, reducing grid stress and aligning directly with sovereign net-zero pledges.
AI & High-Density Workloads Boosting Advanced Water-Cooling Demand
The transition from 10 kW to 250 kW racks for AI training changes the thermodynamic equation. Direct-to-chip liquid systems remove up to 80 kW per rack, slash fan energy by 45%, and deliver a 300-fold gain in water efficiency when paired with NVIDIA’s Blackwell architecture.[2]NVIDIA, "Blackwell Platform Boosts Water Efficiency by Over 300x", nvidia.com Suppliers such as Flex Power Modules document how rear-door heat exchangers and cold-plate loops run on small closed circuits that are refilled once a year, lowering site water footprints even in desert climates.
Rising Middle-East Water Tariffs Driving Re-use Investments
Municipal utilities are lifting volumetric charges to reflect desalination costs, pushing operators toward membrane filtration and ultraviolet disinfection. Amazon Web Services already uses reclaimed wastewater in 20 facilities and recycles 96% of cooling flows at selected campuses. The Middle East & Africa data center water consumption market is therefore redirecting capital toward onsite treatment that repays itself in two to four years through tariff avoidance.
Expansion of Edge DCs in Sub-Saharan Africa Leveraging Local Non-Potable Sources
Mobile content delivery and latency-sensitive workloads drive investment in edge facilities that often sit outside major municipal grids. Africa Data Centres reported only 6,242 liters of municipal intake in fiscal 2024 by harvesting rainwater and recycling condensate from HVAC coils.[3]Cassava Technologies, "Sustainability Report 2024", cassavatechnologies.com Atmospheric water generation is gaining traction, with Microsoft field-testing air-moisture capture at coastal sites to support GPU clusters. These solutions extend infrastructure to drought-prone regions without straining domestic supplies.
Restraints Impact Analysis
| Restraint | (~) % Impact on CAGR Forecast | Geographic Relevance | Impact Timeline | |||
|---|---|---|---|---|---|---|
Intensifying Water-Rights Regulation in Water-Stressed African Nations Intensifying Water-Rights Regulation in Water-Stressed African Nations | -2.1% | East Africa, Southern Africa | Medium term (2-4 years) | (~) % Impact on CAGR Forecast:-2.1% | Geographic Relevance:East Africa, Southern Africa | Impact Timeline:Medium term (2-4 years) |
High Capex of Membrane-Based Water Treatment High Capex of Membrane-Based Water Treatment | -1.8% | Global, with higher impact in developing markets | Short term (≤ 2 years) | |||
Limited Skilled Workforce for Advanced Recycling Systems Limited Skilled Workforce for Advanced Recycling Systems | -1.2% | Sub-Saharan Africa, emerging Middle East markets | Long term (≥ 4 years) | |||
Intermittent Municipal Supply in Remote Areas Intermittent Municipal Supply in Remote Areas | -0.9% | Rural Sub-Saharan Africa, remote Middle East locations | Medium term (2-4 years) | |||
| Source: Mordor Intelligence | ||||||
Intensifying Water-Rights Regulation in Water-Stressed African Nations
South Africa and Kenya now compel data centers to document efficiency plans before receiving abstraction permits. Regulators prioritize agriculture over industrial uses, forcing operators to design for sub-0.3 liters per kWh consumption. Facilities add high-resolution digital water meters and real-time telemetry to prove compliance and avoid shutdowns during seasonal drought alerts.
High Capex of Membrane-Based Water Treatment
Reverse osmosis and silicon-carbide ultrafiltration units can triple project budgets, especially in markets where discount rates exceed 12%. Biofouling at 70% of regional seawater plants raises maintenance costs, demanding pre-treatment such as ultrafiltration and UV.[4]Purdue University, "Biofouling in SWRO", docs.lib.purdue.eduSmaller colocations favor leasing treated greywater from municipal plants until economies of scale or green-bond financing make onsite systems viable.
By Source of Water Procurement: Potable Water Dominates Despite Sustainability Pressures
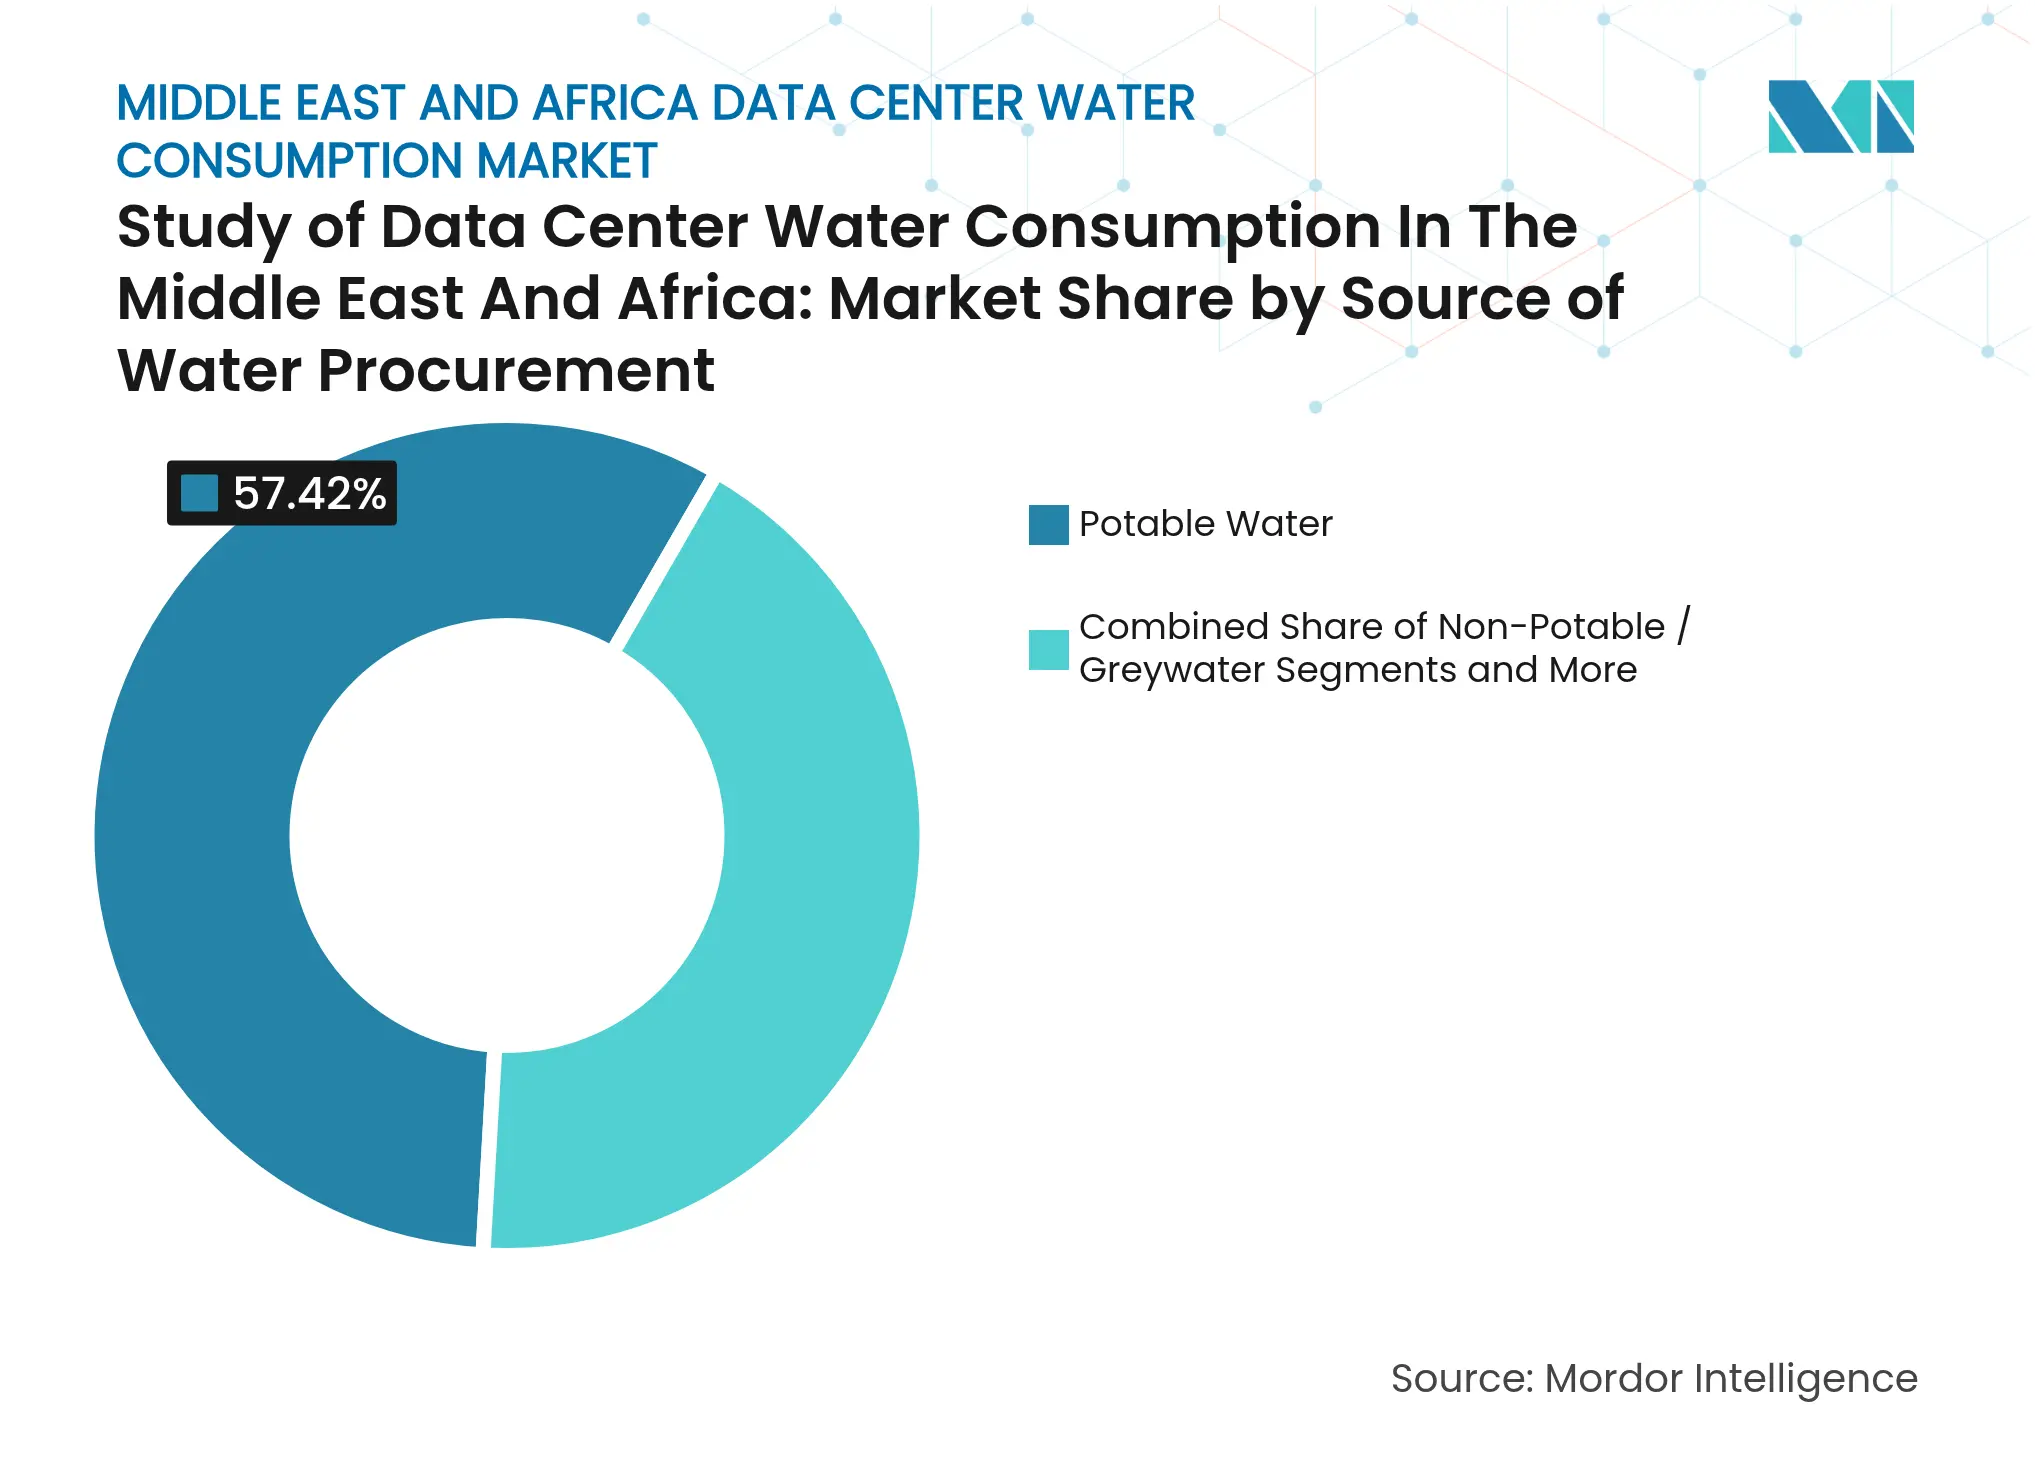
Potable water held 57.42% of Middle East & Africa data center water consumption market share in 2025, reflecting the maturity of municipal networks and the reliability of treated supplies. Operators, however, face tariff increases that are eroding cost advantages and exposing projects to potential rationing during peak demand seasons. Non-potable and greywater streams, therefore, present a path to resilience, especially in emirates where reclaimed wastewater already meets a sizeable share of public green-space irrigation.
The non-potable segment is growing at a 28.88% CAGR as hyperscalers sign offtake agreements with wastewater utilities and finance tertiary treatment upgrades. In East Africa, atmospheric capture units and rooftop harvesting systems are enabling start-ups to cool edge racks with negligible potable demand. These shifts imply that the Middle East & Africa data center water consumption market size tied to non-potable sources could surpass one-third of total demand before 2030. Desalinated seawater and brackish groundwater are also joining the procurement mix, underpinned by renewable energy that limits indirect emissions.
Note: Segment shares of all individual segments available upon report purchase
By Data Center Type: Colocation Providers Lead Water Efficiency Innovations
Colocation vendors captured 46.55% of the Middle East & Africa data center water consumption market size in 2025 by spreading advanced cooling assets over multi-tenant footprints. High utilization rates create steady thermal loads that justify investment in sealed chilled-water loops and waste-heat recovery to nearby buildings. Some Gulf campuses report Water Usage Effectiveness below 0.02, signalling best-in-class stewardship.
Cloud service providers are recording the fastest 29.42% CAGR as hyperscalers roll out direct liquid cooling at new availability zones. The Middle East & Africa data center water consumption market benefits when single-tenant facilities adopt near-ambient liquid loops that operate without evaporative towers. Enterprise sites remain smaller but are piloting modular immersion enclosures that can be installed without major plant retrofits, widening access to efficient cooling across the region.
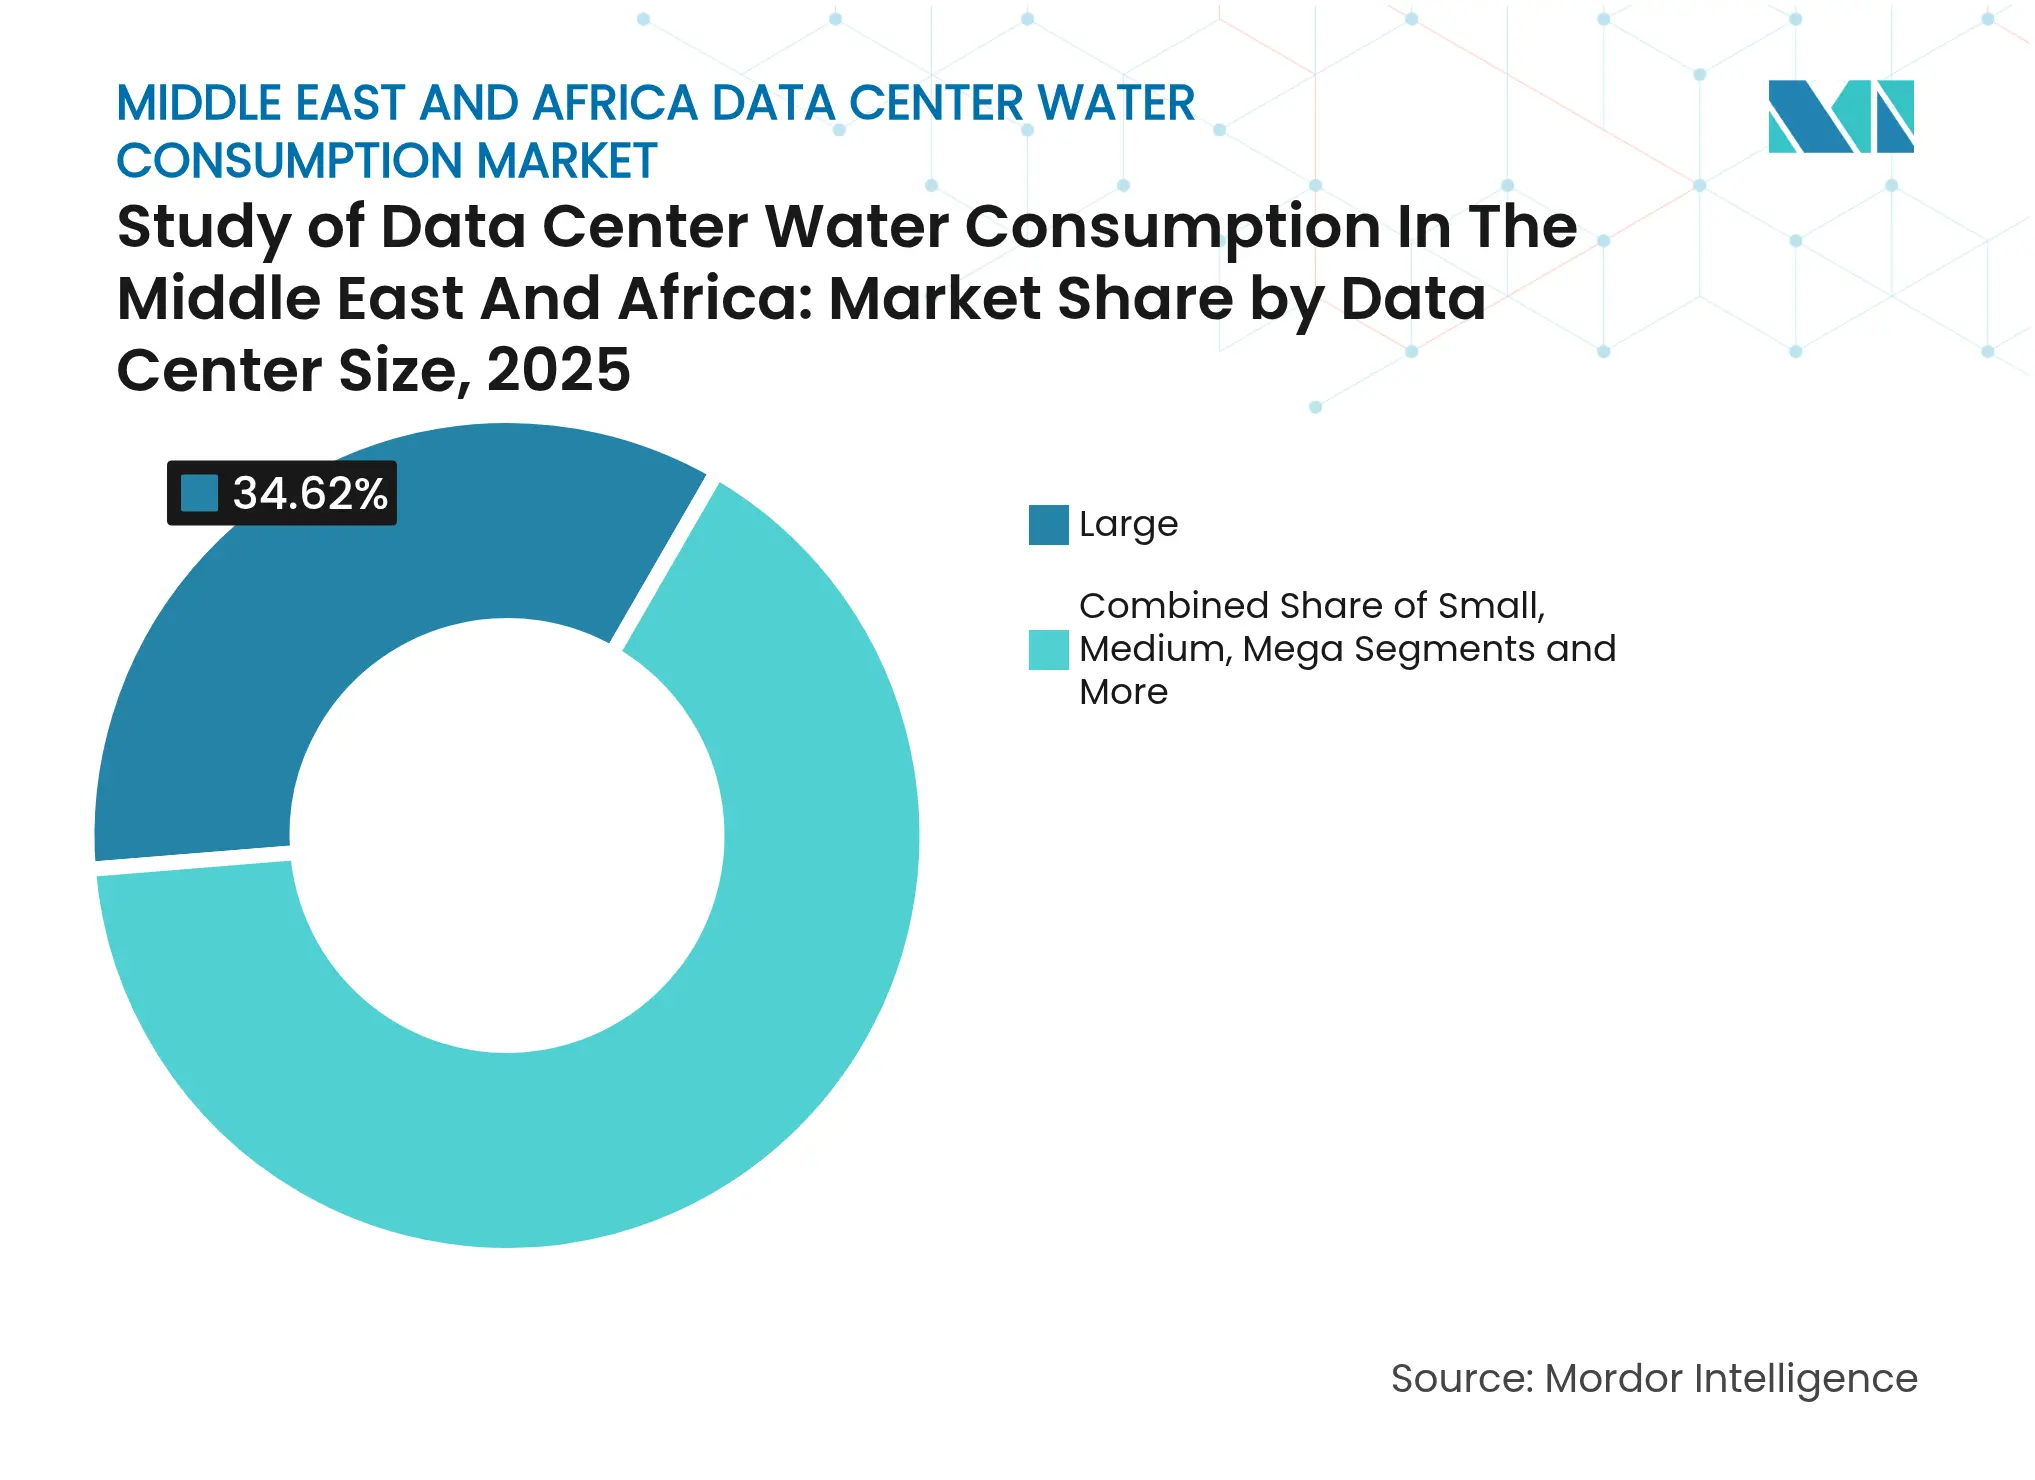
By Data Center Size: Large Facilities Dominate While Mega Centers Grow Fastest
Large campuses commanded 34.62% of the Middle East & Africa data center water consumption market share in 2025 due to early investments by telecom incumbents. These sites typically combine evaporative assistance in winter with chilled-water circuits in summer, balancing water and power spends. Recycling systems now recover up to 96% of blow-down and condensate, trimming utility bills and improving ESG scores.
Mega centers above 100 MW, often located in Saudi Arabia free zones, are expanding at a 29.06% CAGR. Designs include underground thermal storage and onsite desalination powered by photovoltaic arrays. As a result, the Middle East & Africa data center water consumption market size anchored in mega projects is poised to triple within five years. Small and midsize facilities continue to adopt prefabricated modules that integrate nanofiltration and UV to meet emerging compliance thresholds.
Note: Segment shares of all individual segments available upon report purchase
By Cooling Technology: Chilled-Water Systems Maintain Dominance as Direct Liquid Cooling Surges
Chilled-water systems retained a 49.55% share in 2025 thanks to proven reliability and compatibility with both low-density and mixed-density halls. Operators enhance efficiency through variable speed drives and AI-driven control algorithms that adapt flow rates to live thermal maps. These steps are critical for the Middle East & Africa data center water consumption market, where summers push wet-bulb temperatures to extremes.
Direct liquid cooling is scaling fastest at a 31.20% CAGR because it removes heat at the chip and reduces reliance on high makeup water volumes. Vendors deliver cold plates pre-charged with biodegradable dielectric fluids, enabling top-up cycles of once a year rather than daily. Hybrid deployments combine DLC on AI pods with chilled-water coils on traditional IT, creating balanced portfolios that future-proof new builds. This trend is pivotal for long-run reductions in the Middle East & Africa data center water consumption market footprint.
The GCC accounted for 47.60% of the Middle East & Africa data center water consumption market in 2025, backed by sovereign funds that prioritize digital infrastructure within national diversification agendas. United Arab Emirates facilities are pairing waste heat with adjacent desalination trains that push brine rejects to solar ponds, closing water loops in deserts where precipitation is under 100 mm annually. Saudi Arabia’s Red Sea giga-projects deploy photovoltaic-powered reverse-osmosis and use the reject heat to drive absorption chillers for adjacent GPU farms, reinforcing circular resource flows.
East Africa posts the fastest 28.95% CAGR on the back of undersea cable landings and national cloud strategies. Kenya’s upcoming 1 GW green zone integrates treated effluent from nearby municipal plants into data hall cooling loops, showcasing a replicable model for other cities facing tight freshwater quotas. Rainwater harvesting tanks and atmospheric moisture capture backstop supply during drought cycles, positioning the region as a test bed for resilient designs.
North Africa is gaining traction as Egypt leverages its crossroads location to host connectivity hubs that also serve European workloads during seasonal peaks. Integration with Nile River treated sewage effluent creates cost savings, though climate variability elevates the value of redundant groundwater rights. Southern Africa remains a mature node with Johannesburg and Cape Town clusters moving toward greywater cooling as utility tariffs climb. Regional collaboration on shared treatment infrastructure will influence how the Middle East & Africa data center water consumption market evolves beyond 2030.
Market Concentration
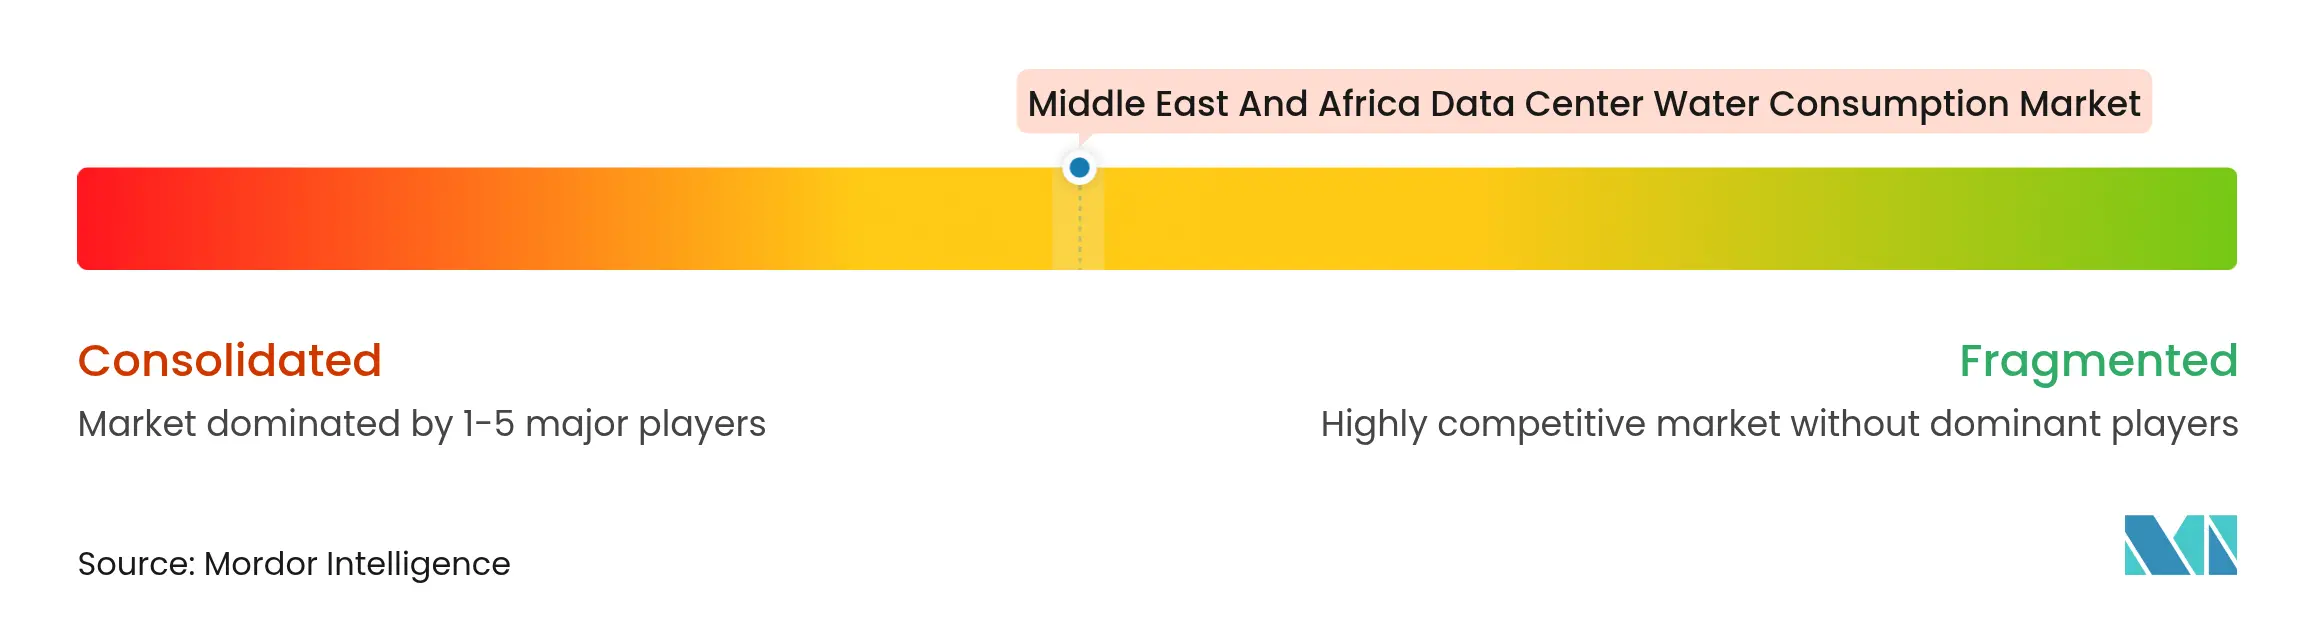
The Middle East & Africa data center water consumption market is moderately concentrated, with international platforms such as Equinix and Digital Realty operating alongside regional champions including Khazna Data Centers and Africa Data Centres. Barriers to entry stem from capital intensity, energy availability, and permitting complexity tied to water use. Differentiation is shifting toward water performance indicators as customers integrate sustainability clauses into service-level agreements.
Strategic alliances with technology suppliers give operators an edge. DataVolt partners with Aquatech to embed zero liquid discharge and membrane distillation that reclaims near 100% of the cooling loop blowdown. Equinix embeds its sites within a green finance framework that earmarks proceeds for water efficiency projects. OEMs such as 2CRSi deliver rack-integrated cold-plate assemblies that lower both water and power footprints.
Regional policy shifts accelerate competition. Gulf regulators now publish public dashboards of data center WUE, allowing customers to benchmark suppliers. This transparency rewards early movers who invested in closed-loop cooling and onsite desalination. Supply chain partnerships with membrane vendors and UV system integrators unlock cost economies, strengthening the strategic posture of firms that can finance entire water ecosystems in one capital cycle.

*Disclaimer: Major Players sorted in no particular order
1. INTRODUCTION
2. RESEARCH METHODOLOGY
3. EXECUTIVE SUMMARY
4. MARKET LANDSCAPE
5. MARKET SIZE AND GROWTH FORECASTS (VALUE)
6. COMPETITIVE LANDSCAPE
7. MARKET OPPORTUNITIES AND FUTURE OUTLOOK
Pricing Strategy for Semiconductor Components
3 Min Read
Accelerating Additive Manufacturing Adoption in India
3 Min Read
Deep-Dive Analysis of Feed Probiotics Across Key Regions
5 Min Read
When decisions matter, industry leaders turn to our analysts. Let’s talk.