United Kingdom Data Center Water Consumption Market Size and Share
Market Overview
| Study Period | 2020 - 2031 |
|---|---|
| Forecast Data Period | 2026 - 2031 |
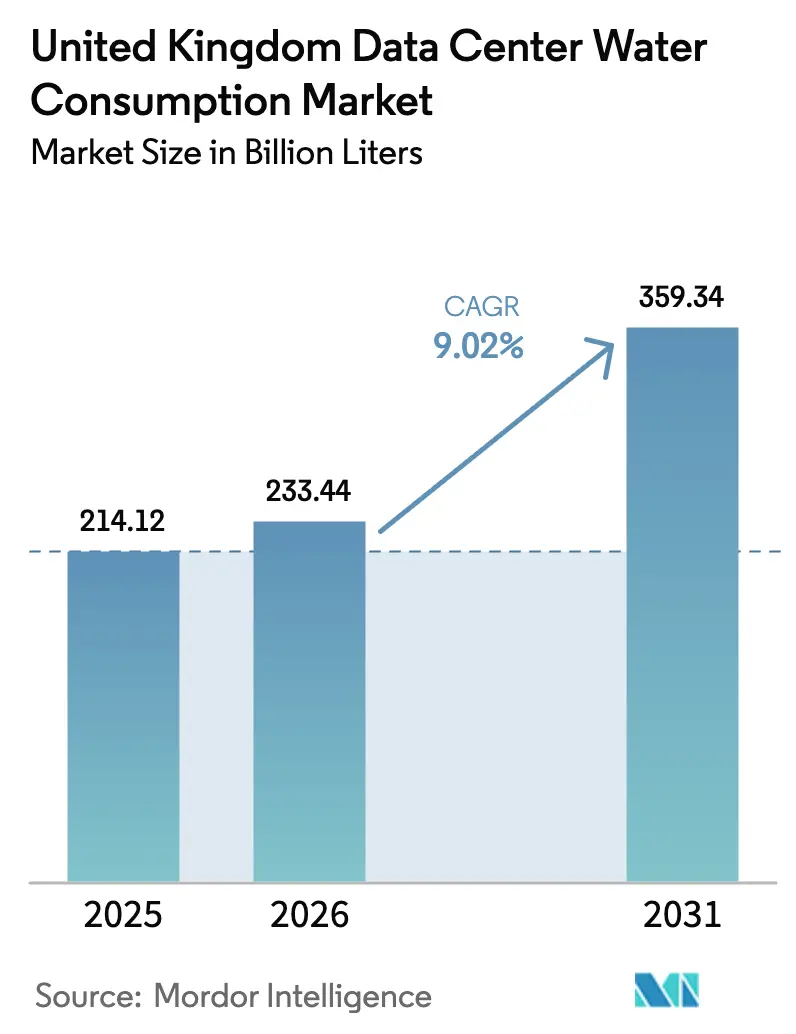
| Base Year Market Size (2025) | 214.12 Billion liters |
| Market Volume (2026) | 233.44 Billion liters |
| Market Volume (2031) | 359.34 Billion liters |
| Growth Rate (2026 - 2031) | 9.02% CAGR |
| Market Concentration | Medium |
Major Players *Disclaimer: Major Players sorted in no particular order Image © Mordor Intelligence. Reuse requires attribution under CC BY 4.0. | |
United Kingdom Data Center Water Consumption Market Analysis by Mordor Intelligence
United Kingdom data center water consumption market size in 2026 is estimated at 233.44 billion liters, growing from 2025 value of 214.12 billion liters with 2031 projections showing 359.34 billion liters, growing at 9.02% CAGR over 2026-2031. Rapid AI-driven rack densification, the government’s Critical National Infrastructure designation, and escalating water stress across the South-East are driving this expansion. Hyperscalers are installing direct liquid and immersion cooling that draws 3 to 4 times the heat load of legacy servers yet can cut makeup water by up to 95% when configured in closed loops.[1]Kevin Scott, “Microsoft Shows Data Centers Can Save Water While Staying Cool,” microsoft.com At the same time, planning fast-tracks and priority grid connections has accelerated site approvals, though regulators now require detailed water-efficiency plans. Operators in Scotland benefit from land costs that are up to 90% lower than in London and cooler ambient temperatures, which extend free-cooling hours. In contrast, those in water-stressed catchments face tighter abstraction and discharge permits, resulting in operating costs that are 20% to 40% higher.
Key Report Takeaways
- By data center type, colocation facilities held 41.65% of the United Kingdom data center water consumption market size in 2025, whereas cloud service providers are expanding at a 10.35% CAGR through 2031.
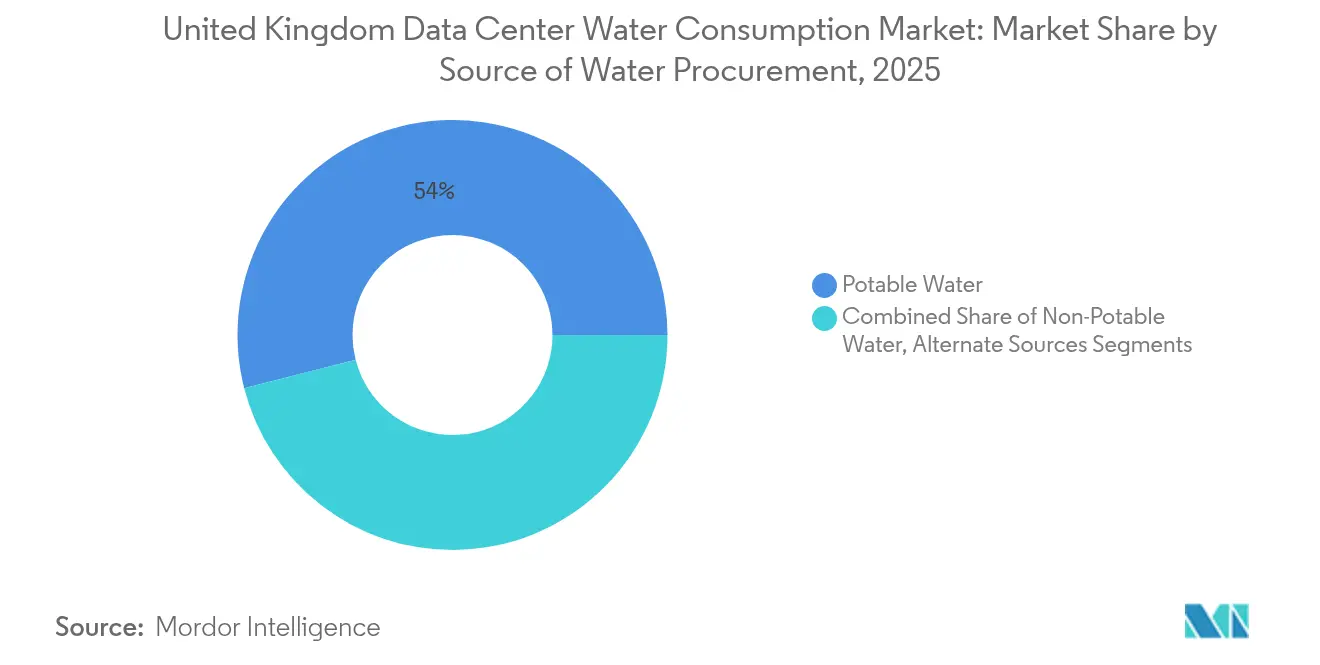
- By source of water procurement, potable municipal supply accounted for 53.98% share of the United Kingdom data center water consumption market in 2025, and non-potable sources are climbing at an 10.62% CAGR to 2031.
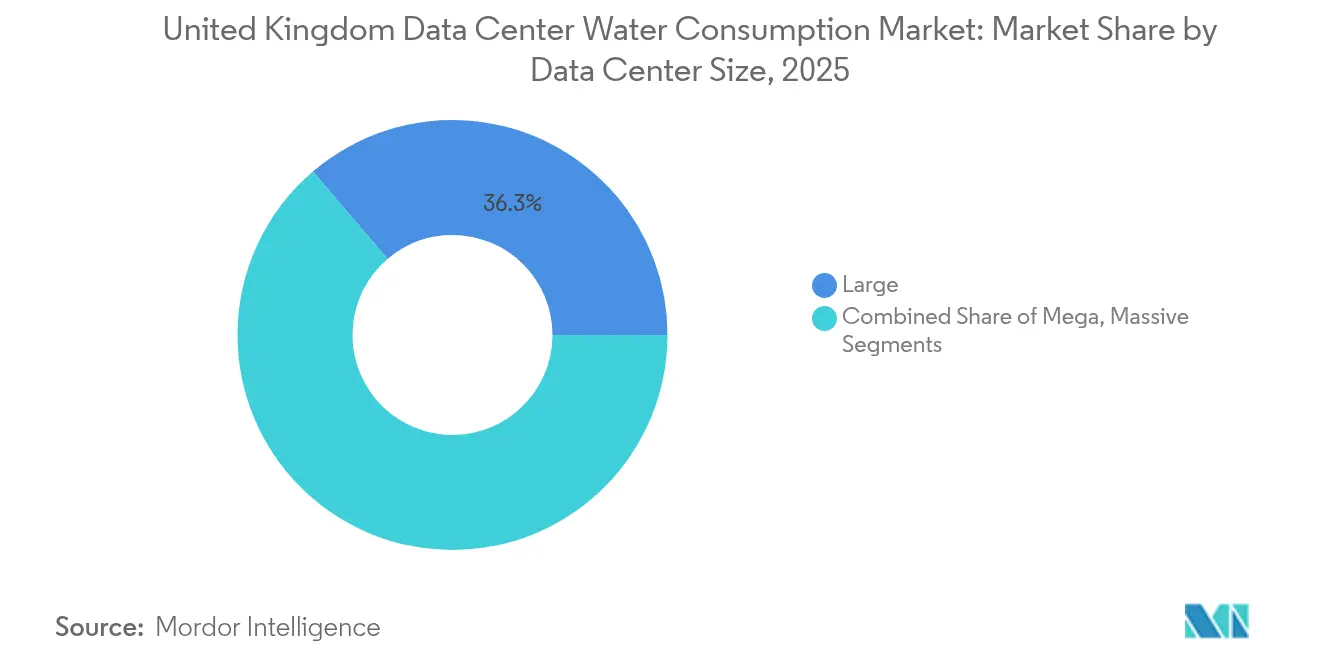
- By size, large facilities captured 36.25% share of the United Kingdom data center water consumption market size in 2025, yet mega sites above 50 MW are growing at an 10.21% CAGR through 2031.
- By treatment method, reverse osmosis commanded 31.12% share of the United Kingdom data center water consumption market in 2025, whereas filtration is the fastest-growing at 9.41% CAGR.
Note: Market size and forecast figures in this report are generated using Mordor Intelligence’s proprietary estimation framework, updated with the latest available data and insights as of 2026.
Proportional positioning is established by comparing country level and regional contributions against the global total, including that of United kingdom. The data center water consumption market share in our global report expresses these relative weights.
United Kingdom Data Center Water Consumption Market Trends and Insights
Drivers Impact Analysis*
| Driver | (~) % Impact on CAGR Forecast | Geographic Relevance | Impact Timeline |
|---|---|---|---|
| Accelerating AI-Driven Compute Expansion | +2.5% | England, Scotland | Short term (≤ 2 years) |
| Government Digital-Infrastructure Investments | +1.8% | National | Medium term (2-4 years) |
| Sustainability Mandates for Water-Efficient Cooling | +1.5% | England, Wales, Scotland | Medium term (2-4 years) |
| Rising Electricity Prices Driving Energy-Water Efficiency | +1.2% | National | Short term (≤ 2 years) |
| Heat Reuse Incentives Favor Closed-Loop Water Systems | +0.8% | England, Scotland | Long term (≥ 4 years) |
| Utility Partnerships for Non-Potable Supply | +0.7% | England, Wales | Medium term (2-4 years) |
| Source: Mordor Intelligence | |||
Accelerating AI-Driven Compute Expansion
Generative AI workloads raise rack densities from 8 to 12 kW to 40 to 70 kW, compelling a shift toward direct liquid cooling and rear-door heat exchangers that can lower total water use by up to 90% in closed-loop designs. AWS has earmarked GBP 8 billion (USD 10.67 billion) for United Kingdom capacity through 2028 to support AI and machine learning, an investment expected to sustain 14,000 jobs annually. Google’s GBP 790 million (USD 1053.84 million) Waltham Cross campus integrates heat recovery so that AI inference heat can be exported to neighboring buildings, sidestepping evaporative cooling altogether. In Scotland, cooler ambient temperatures below 15 °C on more than 200 days a year allow operators to defer liquid-cooling retrofits until densities top 25 kW.
Government Digital-Infrastructure Investments
The September 2024 Critical National Infrastructure status confers planning priority and expedited grid connections, while also embedding water-efficiency metrics within approvals.[2]GOV.UK, “Data Centres to be Given Critical National Infrastructure Status,” gov.uk Government modeling indicates that doubling national data-center capacity by 2030 could result in an additional 100 to 150 billion liters of annual demand if legacy evaporative systems remain prevalent. Regional AI Growth Zones enjoy favorable tariffs; however, several overlapping catchments are already flagged as water-stressed by the Environment Agency. Scotland’s Green Data Centres Action Plan advances brownfield sites with pre-existing abstraction rights, cutting permitting cycles from 24 months to nearer 9 months.
Sustainability Mandates for Water-Efficient Cooling
Water Usage Effectiveness targets below 0.5 L per kWh for new builds, well under the 1.5 to 2.0 L benchmark of air-cooled legacies, are now common. The revised licensing regime requires operators in over-abstracted catchments to demonstrate water neutrality or finance river restoration offsets. Microsoft pledges to achieve water-positive operations by 2030 and has implemented closed-loop liquid systems that recycle coolant with zero blowdown, eliminating the 3% to 5% losses typically associated with cooling towers. Two-phase immersion cooling remains niche because dielectric fluids cost GBP 200 to 400 (USD 266.79 to 533.59) per liter, yet adoption is rising in 70 kW AI clusters.
Rising Electricity Prices Driving Energy-Water Efficiency
Industrial power averaged GBP 0.25 (USD 0.33) per kWh in 2024, making evaporative cooling financially attractive despite its higher water draw. Operators in Scotland leverage day-time wind surpluses to run mechanical chillers and store cold energy in phase-change pipes, reducing both power and water bills by up to 70% relative to London peers. Google secured below-market renewable electrons from ENGIE’s Moray West offshore wind farm, enabling an air-cooled, heat-recovery design that eliminates evaporative water entirely.
Restraints Impact Analysis*
| Restraint | (~) % Impact on CAGR Forecast | Geographic Relevance | Impact Timeline |
|---|---|---|---|
| Escalating Water Stress in South-East and East England | -1.5% | England | Short term (≤ 2 years) |
| Tightening Abstraction and Discharge Permitting | -1.2% | England, Wales | Medium term (2-4 years) |
| Public Backlash to Rural AI Super-Cluster Projects | -0.6% | England, Scotland | Short term (≤ 2 years) |
| High Capex for On-Site Treatment Infrastructure | -0.5% | National | Medium term (2-4 years) |
| Source: Mordor Intelligence | |||
Escalating Water Stress in South-East and East England
The National Framework for Water Resources projects a 4 billion-liter daily deficit in the South-East by 2050, prompting seasonal abstraction bans and variable tariffs for high-volume users. Thames Water, carrying GBP 15 billion (USD 20.01 billion) of debt, has warned London data-center hubs of impending flow restrictions. Anglian Water already mandates on-site storage that covers 7 to 14 days of cooling demand during droughts. Investors are diverting funds to Scotland, Wales, and Northern Ireland where permits clear in 6 to 12 months versus up to 36 months in the South-East.
Tightening Abstraction and Discharge Permitting
Buckinghamshire Council’s 2024 rejection of a Denham super-cluster cited unacceptable impacts on the Colne Valley chalk aquifer.[3]Buckinghamshire Council, “Planning Decision on Greystoke Land,” buckinghamshire.gov.uk New licenses in over-licensed catchments must fund aquifer recharge or retire an equal abstraction elsewhere, while blow-down discharges must now meet 1 mg/L phosphorus and nitrogen limits that often require reverse osmosis pretreatment costing GBP 2 million (USD 2.67 million) to GBP 5 million (USD 6.67 million) per 20 MW site.
*Our forecasts treat driver/restraint impacts as directional, not additive. The impact forecasts reflect baseline growth, mix effects, and variable interactions.
Segment Analysis
By Source of Water Procurement: Non-Potable Sources Displace Potable Supply
Non-potable supply leads growth at an 10.62% CAGR as operators hedge against impending municipal flow caps. Potable water still held 53.98% of the United Kingdom data center water consumption market share in 2025, but its dominance is waning amid higher scarcity tariffs. Rainwater harvesting, greywater reuse, and recycled effluent, together, will exceed a 50% share of the United Kingdom data center water consumption market size by 2031, if current project pipelines materialize. Scotland’s rainfall above 1,200 mm per year ensures that most new campuses meet 30% or more potable water offset targets via rain capture alone.
Microsoft’s closed-loop deployments reduce makeup water by 95%, enabling rainwater and greywater to meet residual demand and secure permits in over-licensed catchments. Midlands operators negotiate a treated effluent offtake agreement with Severn Trent, securing a drought-resilient supply while monetizing unused treatment capacity for the utility. In the South East, the lack of new licenses is pushing legacy sites toward costly retrofits or relocation to Scotland and Wales.


By Data Center Type: Cloud Providers Extend Lead on High-Density Builds
Cloud platforms grew 10.35% in 2025, faster than any other type, as AWS, Microsoft, and Google adopted liquid cooling that supports 30 to 150 kW racks. Colocation facilities retained a 41.65% slice of the United Kingdom data center water consumption market size, leveraging London’s connectivity but facing retrofit hurdles. Enterprise facilities trail with low single-digit growth as corporate owners migrate workloads to public cloud or outsource to liquid-ready colocation suites.
Hyperscale economics allow amortizing GBP 100 million (USD 133.40 million) cooling systems over tens of thousands of racks, whereas legacy colocation halls struggle to justify upgrades unless anchor tenants pre-commit. The Competition and Markets Authority notes AWS and Microsoft now control 70%-80% of cloud capacity, underscoring a structural tilt toward hyperscale that concentrates water-efficient investment.
By Data Center Size: Mega Sites Above 50 MW Capture AI Workloads
Mega campuses above 50 MW are the fastest-expanding size class at 10.21% CAGR, displacing distributed 10 to 50 MW builds. Large data centers still held 36.25% of the United Kingdom data center water consumption market share in 2025, but developers now favor Scotland and the Midlands, where land is cheap and abstraction licenses persist from former power stations. Small and medium facilities play a crucial role near latency-sensitive London finance hubs, yet local supply limitations constrain their water footprint.
DataVita’s plan to scale from 40 MW to 500 MW on a single Scottish campus exemplifies the appeal of mega-sites, pairing wind power PPAs with closed-loop cooling to achieve 90% water savings. Google’s 33-acre Waltham Cross project, although below 50 MW, deploys heat recovery and air cooling to win approval in a water-stressed Hertfordshire setting.
By Water Treatment Method: Filtration Surges on Pretreatment Needs
Reverse osmosis retained 31.12% share of the United Kingdom data center water consumption market in 2025, owing to its 95%-plus total dissolved solids removal, yet filtration is climbing fastest at 9.41% CAGR as a universal first barrier. Closed-loop liquid cooling reduces the biological load, but particulate fouling of plate heat exchangers still necessitates the use of multi-stage filters. UV disinfection grows in tandem as operators ditch chlorine to meet stricter discharge thresholds set by the Environment Agency. Softening lags because only hard-water regions justify the ongoing expense of regeneration.
Facilities in over-abstracted catchments must achieve sub-1 mg/L phosphorus and nitrogen in blowdown, pushing many toward costly reverse-osmosis and ion-exchange systems. Operators with sealed liquid systems instead spend on glycol filtration and online corrosion monitoring, which cuts their chemical budgets by up to 60%.
Geography Analysis
England consumed 62.05% of the national volume in 2025, but its share is expected to decline as flow caps and planning rejections slow new builds. Google’s Waltham Cross campus received approval only after committing to zero evaporative loss, indicating that future projects must prove water neutrality. Thames and Anglian water stress signals lengthen, permitting timelines to 24 to 36 months and inflating capital costs for retrofit systems. Midlands sites around Birmingham gain momentum because abstraction rights remain available and utilities offer treated effluent.
Scotland is the fastest-growing geography, with a 7.52% CAGR, underpinned by annual rainfall exceeding 1,200 mm, surplus wind power, and brownfield land with grandfathered cooling-water licenses. The Green Data Centres Action Plan lists twelve priority locations, and Scottish Enterprise tallied GBP 25 billion (USD 33.35 billion) of prospective data-center investment in 2024 alone. DataVita, Blackstone, Cloud HQ, and CoreWeave have collectively announced gigawatt-scale ambitions, anticipating both lower energy costs and simplified water compliance.
Wales and Northern Ireland jointly accounted for less than 10% of 2025 demand, yet could absorb overflow from England if abstraction limits tighten further. Severn Trent’s effluent-offtake framework positions the Welsh border as an attractive corridor, while Northern Ireland’s windy grid and low land costs mirror Scotland’s advantages.
Mordor Intelligence examines the data center water consumption market across diverse other regional markets as well, including Europe, Asia, and North America, while also offering granular country-level perspectives for France, Netherlands, United States, Spain, Chile, and Brazil and more.
Competitive Landscape
The United Kingdom data center water consumption market is moderately fragmented. Hyperscalers dominate new capacity, funding closed-loop cooling, reverse-osmosis skids, and utility pipelines that smaller operators cannot match. Colocation specialists Equinix, Digital Realty, Ark, and Virtus differentiate themselves through flexible, liquid-ready suites, but rely on customers' willingness to embrace higher-density racks. Enterprise operators, many of whom are in finance and telecom, continue to divest on-premises halls rather than retrofitting for 70 kW AI racks.
Technology leadership sets hyperscalers apart. Microsoft’s chip-level zero-water cooling saves 125 million liters per site each year, giving it an edge in water-stressed regions. Deep Green’s distributed model monetizes waste heat without district networks, illustrating a niche path for smaller firms. Utility partnerships remain an underexploited differentiator, with Severn Trent pioneering effluent supply deals, while Thames and Anglian Water trail behind.
M&A momentum is building as water-efficient capex escalates. Mid-tier colocation portfolios lacking financial depth are prime targets for hyperscaler carve-outs or infrastructure-fund roll-ups. Expect continued consolidation through 2030, with valuation premiums for campuses already equipped with closed-loop systems and non-potable supply contracts.
United Kingdom Data Center Water Consumption Industry Leaders
Amazon Web Services Inc.
Ark Data Centres Limited
Centersquare Limited
Colt Technology Services Group Limited
CyrusOne LLC
- *Disclaimer: Major Players sorted in no particular order

Recent Industry Developments
- September 2024: UK government granted data centers Critical National Infrastructure status, accelerating capacity growth yet tying approvals to water-efficiency metrics.
- September 2024: AWS committed GBP 8 billion to United Kingdom expansion through 2028, focused on AI capacity and water-saving cooling.
- July 2024: Google secured planning for a GBP 790 million Waltham Cross campus using air cooling with heat recovery.
- June 2024: Scottish Government released its Green Data Centres Action Plan to shorten permitting on twelve brownfield sites.


United Kingdom Data Center Water Consumption Market Report Scope
Data centers in the United Kingdom consume water for cooling, humidification, and various operational needs. This market analysis delves into consumption trends, examining factors such as water sources, types and sizes of data centers, and treatment methods employed to maintain efficiency and comply with regulations.
The United Kingdom Data Center Water Consumption Market Report is Segmented by Source of Water Procurement (Potable Water, Non-Potable Water, Alternate Sources), Data Center Type (Enterprise, Colocation, Cloud Service Providers), Data Center Size (Mega, Massive, Large, Medium, Small), Water Treatment Method (Filtration, Reverse Osmosis, UV Disinfection, Chemical Treatment, Softening), and Geography (England, Scotland, Wales, Northern Ireland). The Market Forecasts are Provided in Terms of Volume (Liters).
| Potable Water |
| Non-Potable Water |
| Alternate Sources |
| Enterprise |
| Colocation |
| Cloud Service Providers |
| Mega |
| Massive |
| Large |
| Medium |
| Small |
| Filtration |
| Reverse Osmosis |
| UV Disinfection |
| Chemical Treatment |
| Softening |
| By Source of Water Procurement | Potable Water |
| Non-Potable Water | |
| Alternate Sources | |
| By Data Center Type | Enterprise |
| Colocation | |
| Cloud Service Providers | |
| By Data Center Size | Mega |
| Massive | |
| Large | |
| Medium | |
| Small | |
| By Water Treatment Method | Filtration |
| Reverse Osmosis | |
| UV Disinfection | |
| Chemical Treatment | |
| Softening |


Key Questions Answered in the Report
How much water does the United Kingdom data center sector use today?
The United Kingdom data center water consumption market size stands at 233.44 billion liters in 2026 and is set to climb to 359.34 billion liters by 2031.
Which cooling technology is gaining fastest adoption?
Closed-loop direct liquid cooling that can cut makeup water by up to 95% is expanding quickest, especially in AI-focused hyperscale campuses.
Why are operators moving north of London?
Scotland and the Midlands offer lower land costs, abundant renewable power, and easier abstraction licensing, making them attractive alternatives to water-stressed South-East England.
What share of consumption comes from potable water?
Potable municipal supply still accounts for 53.98% of total volume, but non-potable sources such as treated effluent and harvested rainwater are growing at an 10.62% CAGR.
How do regulators judge new site proposals?
Planning authorities require proof of water neutrality or net-positive hydrologic impact, strict discharge compliance, and alignment with the National Framework for Water Resources.
Who leads the shift toward zero-water cooling?
Microsoft has deployed chip-level liquid cooling across all United Kingdom facilities, saving roughly 125 million liters per site each year.
Page last updated on:


