North America Data Center Water Consumption Market Size and Share
Market Overview
| Study Period | 2019 - 2030 |
|---|---|
| Forecast Data Period | 2025 - 2030 |
| Historical Data Period | 2019 - 2023 |
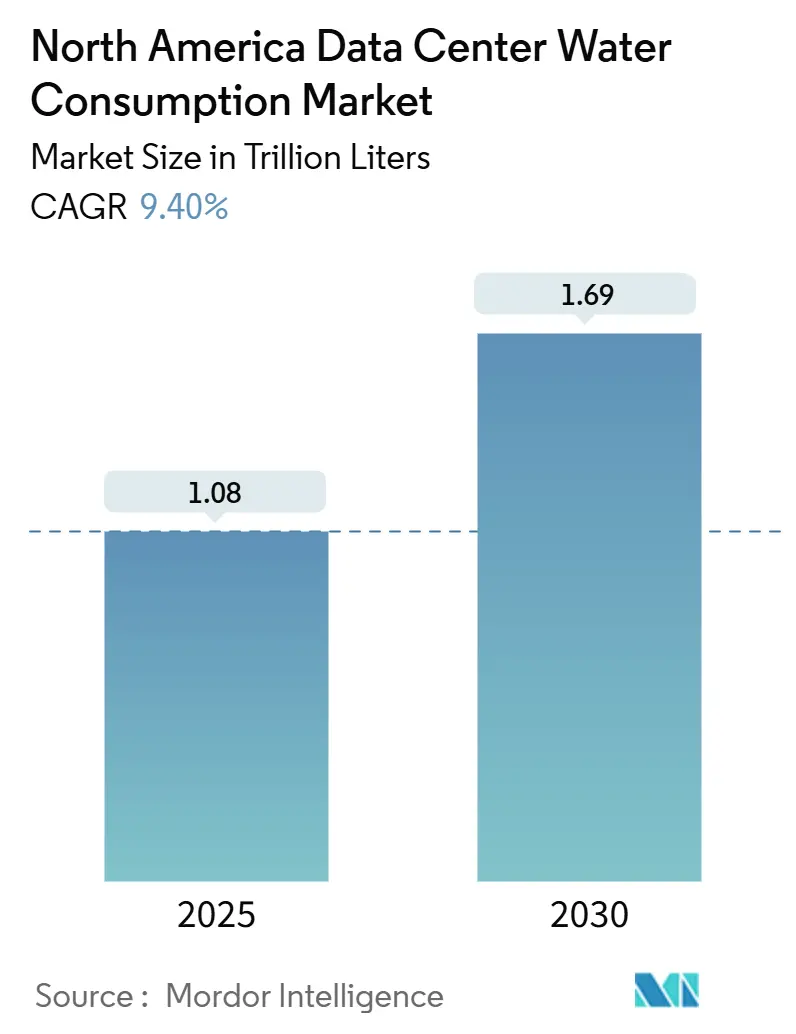
| Market Volume (2025) | 1.08 Trillion liters |
| Market Volume (2030) | 1.69 Trillion liters |
| Growth Rate (2025 - 2030) | 9.40% CAGR |
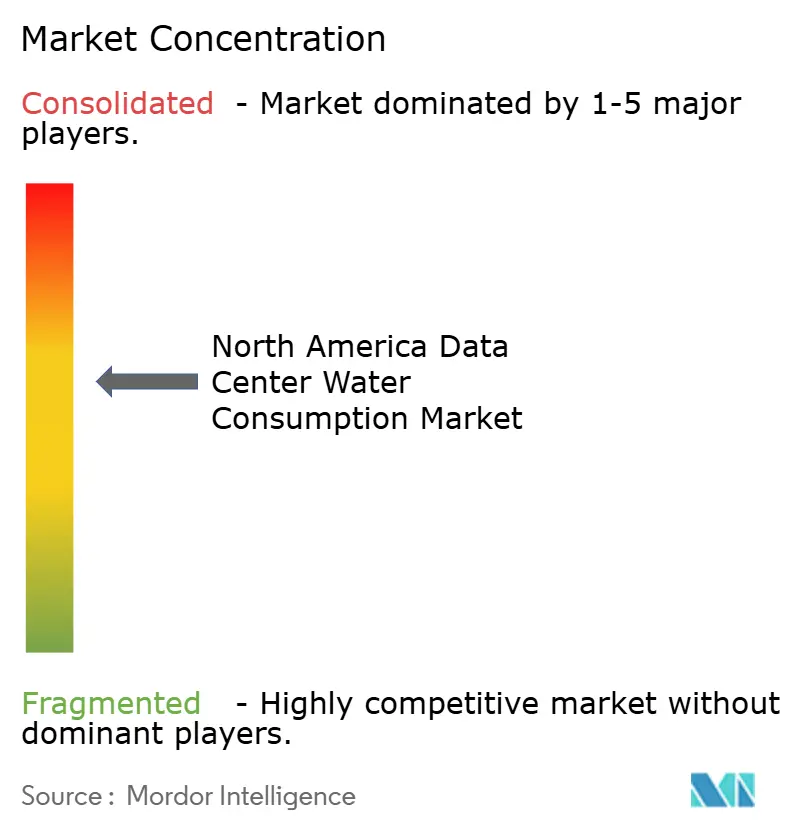
| Market Concentration | Medium |
Major Players *Disclaimer: Major Players sorted in no particular order Image © Mordor Intelligence. Reuse requires attribution under CC BY 4.0. | |
North America Data Center Water Consumption Market Analysis by Mordor Intelligence
The North America data center water consumption market size reached 1.08 trillion liters in 2025 and is on track to reach 1.69 trillion liters by 2030, advancing at a 9.40% CAGR. The expansion is tightly linked to hyperscale data-center buildouts that support AI and 5G workloads, alongside stricter municipal water-use mandates in the United States. Liquid-cooling architectures, especially direct-to-chip designs, are gaining popularity because they can handle high thermal densities, yet they also increase absolute water demand, even while improving compute efficiency. Operators respond by clustering facilities in water-abundant regions and by investing in on-site treatment systems that shrink potable withdrawals. Rising water tariffs across drought-prone hubs such as Virginia and Arizona, combined with disclosure requirements under ISO/IEC 30134-9, reinforce water stewardship as a board-level priority. The upshot is that the North America data center water consumption market is moving from voluntary sustainability to enforced compliance, creating a premium for proven water-efficient cooling innovations.
Key Report Takeaways
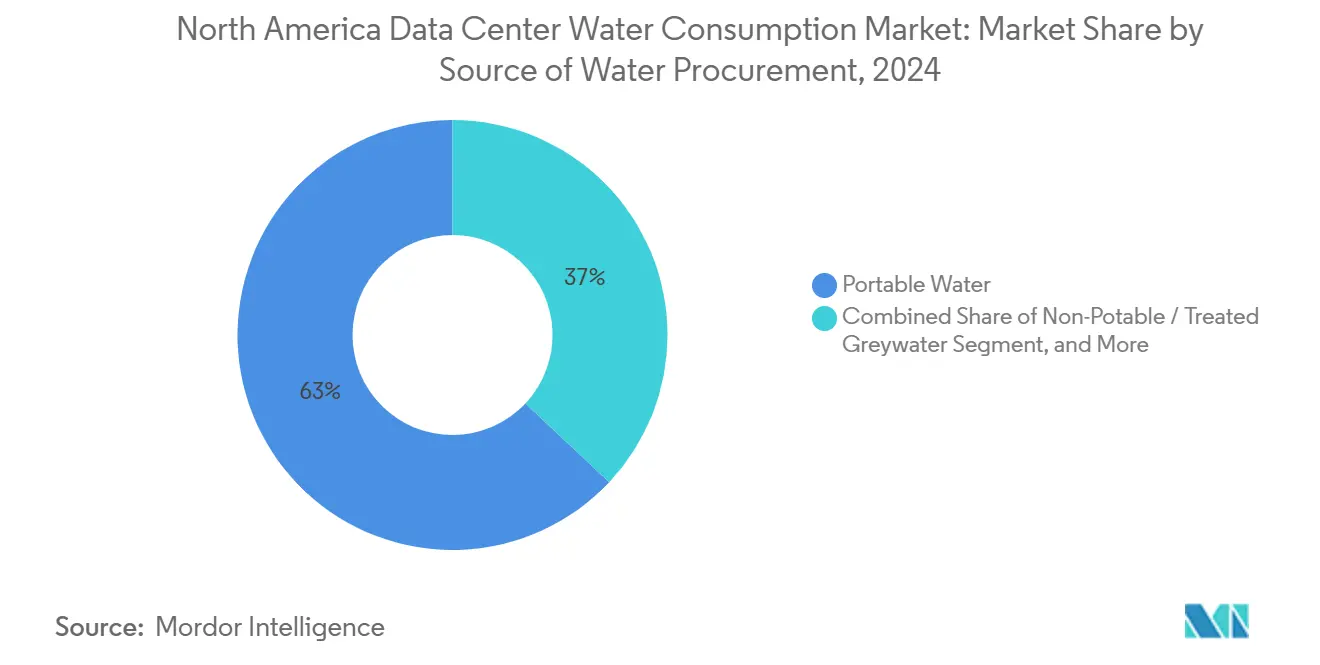
- By source of water procurement, potable water accounted for 63% of the North America data center water consumption market share in 2024; non-potable and treated greywater is projected to post the fastest CAGR of 9.56% from 2024 to 2030.
- By data-center type, cloud service providers led with 48% of the North America data center water consumption market share in 2024, while colocation facilities are forecast to expand at a 10.20% CAGR through 2030.
- By data center size, massive facilities accounted for 36% of the North America data center water consumption market share in 2024, and mega facilities are set to grow at an 11.12% CAGR through 2030.
- By cooling technology, air-based systems retained an 83% share of the North America data center water consumption market in 2024; direct-to-chip liquid cooling is expected to record the highest 12.4% CAGR during the forecast period.
- By country, the United States accounted for 90.70% of the North America data center water consumption market share in 2024, whereas Canada is projected to advance at a 10.70% CAGR through 2030.
North America Data Center Water Consumption Market Trends and Insights
Drivers Impact Analysis
| Driver | (~) % Impact on CAGR Forecast | Geographic Relevance | Impact Timeline |
|---|---|---|---|
| Hyperscale expansion driven by AI and 5G workloads | +3.2% | North America, concentrated in Virginia, Texas, Arizona | Medium term (2-4 years) |
| Mandatory WUE disclosure in U.S. municipal permits | +1.8% | United States, especially California, Virginia, Texas | Short term (≤ 2 years) |
| Rapid adoption of direct-to-chip liquid cooling systems | +2.1% | Global, early uptake in North America hyperscale sites | Medium term (2-4 years) |
| Water-positive pledges and onsite harvesting to secure local approvals | +1.4% | North America, scaling in water-stressed regions | Long term (≥ 4 years) |
| Utility–data-center power-purchase contracts bundling low-water renewables | +0.9% | North America, spillover to renewable-rich regions | Long term (≥ 4 years) |
| ESG reporting requirements and sustainability mandates | +1.1% | Global, strictest in North America and EU | Medium term (2-4 years) |
| Source: Mordor Intelligence | |||
Hyperscale expansion driven by AI and 5G workloads
Facilities optimized for AI model training consume 10-50 times more cooling water than traditional server farms. Microsoft disclosed 1.7 billion gallons of water use in 2022, a 34% jump tied to GPU clusters, while Google’s Iowa campus registered 980 million gallons in 2023. Direct-to-chip cooling removes heat 3,500 times more efficiently than air, yet it raises total withdrawals, prompting site selection to shift toward basins with secure supplies. These dynamics are altering the geographic footprint of the North America data center water consumption market, making local hydrology a primary factor in capacity planning.
Mandatory WUE disclosure in U.S. municipal permits
California’s permanent water-conservation rules effective January 2025 compel large users to report Water Usage Effectiveness and meet prescribed targets or incur fines up to USD 10,000 per day. Similar ordinances in Virginia and Texas are moving disclosure from a marketing metric to an approval prerequisite. ISO/IEC 30134-9 supplies a uniform methodology, generating peer-benchmark data that intensifies competition on water performance.[1]ISO, “ISO/IEC 30134-9:2022 Data-Center KPIs—Water,” iso.org Public transparency is accelerating investments in metering and analytics platforms that identify hidden leaks and optimize cooling loops, thereby lifting the addressable spend for water-efficiency technologies in the North America data center water consumption market.
Rapid adoption of direct-to-chip liquid cooling systems
Carrier unveiled its QuantumLeap suite in February 2025 and took an equity stake in ZutaCore to speed commercialization of liquid-cooling blocks aimed at AI clusters. Digital Realty added a turnkey direct-liquid-cooling service in May 2024, signaling that colocation providers must offer high-density racks or risk tenant churn. Microsoft’s life-cycle assessment shows that closed-loop liquid systems can cut blue-water withdrawals by as much as 52% versus air cooling while enabling heat recovery for district-energy projects. As costs fall, liquid cooling is poised to displace legacy CRAC units and reshape supplier power across the North America data center water consumption market.
Water-positive pledges and onsite harvesting to secure local approvals
Google targets a 120% water-replenishment ratio by 2030, and Amazon is rolling out recycled-water networks in every new U.S. campus. Builders now integrate rainwater capture, greywater reuse and atmospheric harvesters to offset withdrawals and to overcome permitting roadblocks in arid counties. Digital Realty achieved 43% non-potable usage in 2023 by adding membrane bioreactor plants and AI leak-detection software. These initiatives elevate capital intensity but secure community goodwill, reinforcing water stewardship as a competitive differentiator in the North America data center water consumption market.
Restraints Impact Analysis
| Restraint | (~) % Impact on CAGR Forecast | Geographic Relevance | Impact Timeline |
|---|---|---|---|
| Severe drought and rising water tariffs in key DC hubs | –2.3% | Virginia, Arizona, Texas, California | Short term (≤ 2 years) |
| Stricter state groundwater-withdrawal caps | –1.7% | California, Nevada, Arizona; expanding westward | Medium term (2-4 years) |
| Indirect water footprint (power generation) scrutiny by investors | –0.8% | North America, especially coal-heavy grids | Long term (≥ 4 years) |
| Rising insurance premiums for water-risk exposures | –1.1% | Water-stressed regions globally | Medium term (2-4 years) |
| Source: Mordor Intelligence | |||
Severe drought and rising water tariffs in key DC hubs
Virginia’s data-center water use climbed from 1.13 billion gallons in 2019 to 1.85 billion gallons in 2023, triggering tiered tariff hikes and seasonal caps. Arizona regulators are debating mandatory efficiency standards for campuses around Phoenix, while community objections led to USD 64 billion in delayed or cancelled projects nationwide. Operators must now model multi-decade water budgets and hedge against tariff escalation, adding cost and risk that weigh on the North America data center water consumption market.
Stricter state groundwater-withdrawal caps
California’s Sustainable Groundwater Management Act prohibits withdrawals that exceed aquifer recharge rates, forcing developers to secure alternative supplies or invest in recharge credits. Nevada and Arizona are instituting similar caps, with each permit requiring a 20-year water-balance study validated by hydrologists. Compliance expenses—including continuous monitoring wells and advanced leak-prevention sensors—raise entry barriers, favoring large operators able to amortize costs across mega-scale campuses. These policy shifts constrain land availability and complicate expansion strategies within the North America data center water consumption market.
Segment Analysis
By Source of Water Procurement: Potable Dependence Spurs Diversification
Potable systems supplied 63% of withdrawals in 2024, yet the segment is only advancing at a 9.56% CAGR, a pace nearly in line with the broader North America data center water consumption market. The North America data center water consumption market size for potable sources stood at 681.8 billion liters in 2025, reflecting the reliability and regulatory clarity of municipal water contracts. Still, direct-air-cooling retrofits and closed-loop treatments are gaining favor as rate structures penalize heavy users.
Non-potable and treated greywater adoption is increasing because operators can reclaim blow-down and HVAC condensate on-site. Digital Realty reported a 43% substitution rate in 2023, supported by membrane bioreactors that cleanse effluent to cooling-tower standards. Several municipalities, led by California, finalized 2025 reuse guidelines that streamline permitting for greywater piping. As a result, alternate sources ranging from surface-water intake to atmospheric generators will cut potable dependency below 50% post-2030 across the North America data center water consumption market.
Note: Segment shares of all individual segments available upon report purchase
By Data Center Type: Colocation Ascends
Cloud service providers (CSPs) commanded 48% of volume in 2024, banking on vertical integration to secure cheap water across nationwide portfolios. Their scale enabled bulk treatment plants and aquifer-recharge projects that dilute tariff spikes. In contrast, enterprise operators are migrating to colocation to offload water-related compliance costs, driving a 10.20% CAGR for the segment, well ahead of the overall North America data center water consumption market growth rate.
Colocation vendors differentiate by guaranteeing WUE levels inside service-level agreements. Digital Realty and Equinix have both launched AI-enabled leak-detection dashboards that tenants can track in real time, aligning with corporate ESG disclosures. The trend redistributes bargaining power toward providers that can document low-water footprints, further reshaping procurement strategies within the North America data center water consumption market.
By Data Center Size: Mega-Scale Advantage
Massive data centers represent 36% of current market capacity, benefiting from established infrastructure and operational optimization that enables efficient water utilization across large-scale deployments. Mega-scale facilities achieve the highest growth rate at 11.12% CAGR as operators pursue economies of scale in water procurement, treatment, and recovery systems that reduce per-unit consumption costs. Large campuses can justify on-site desalination, reclaimed-water pipelines and deep-lake cooling reservoirs, which slash marginal costs per liter. The North America data center water consumption market share for mega-scale sites therefore grows steadily as smaller facilities struggle with compliance overhead.
Massive and large facilities can retrofit liquid cooling, but medium and small sites face consolidation pressure because they lack capital to meet groundwater-monitoring mandates. QTS’s USD 750 million Cedar Rapids build demonstrates the scale economics: an 80 MW water-free cooling platform supported by redundant rainwater cisterns. These layouts set new efficiency benchmarks that smaller rivals find hard to replicate, deepening scale-based competitive moats in the North America data center water consumption market.

Note: Segment shares of all individual segments available upon report purchase
By Cooling Technology: Liquid Systems Disrupt Status Quo
Air-based CRAC and CRAH units still represented 83% of installed cooling in 2024 and posted an 11.82% CAGR due to legacy workloads. Yet AI clusters now exceed 80 kW per rack, overwhelming air’s thermal limits. Direct-to-chip liquid cooling removes heat at the source and supports rack densities beyond 150 kW, cutting floor space by up to 30% and enabling heat reuse for district systems.
Immersion baths and evaporative towers serve as transition technologies, but Microsoft is testing zero-water indirect cooling that uses heat pipes and external radiators for 2026 deployment. As component reliability improves, liquid cooling will hold the lion’s share of new builds after 2027, while air will persist mainly in retrofit contexts. This technology pivot is a cornerstone in the long-term trajectory of the North America data center water consumption market.
Geography Analysis
The United States accounted for 90.70% of total volume in 2025, equal to 979.6 billion liters of the North America data center water consumption market size. Growth remains strong in Northern Virginia and Dallas–Fort Worth because of fiber density and utility incentives, but prolonged droughts are testing the viability of large-scale expansions. Permanent efficiency regulations mean only operators with sophisticated water-management teams can secure new permits.
California, with a 3.5 GW project pipeline, illustrates this tension: resource availability is tight, yet proximity to tech talent and renewable power justifies continued builds under strict conservation mandates.[2]California State Water Resources Control Board, “Permanent Water Conservation Regulations,” waterboards.ca.gov Operators answer by adopting liquid cooling paired with recycled-water schemes, such as Santa Clara Valley Water District’s purple-pipe program, to keep WUE below 0.3 l/kWh. These adaptations help keep the North America data center water consumption market expanding even in arid locales.
Canada is registering a 10.70% CAGR through 2030 as developers look north for abundant water and cooler ambient temperatures. eStruxture’s USD 1.8 billion investment thrusts Montreal and Vancouver into the hyperscale map, leveraging hydroelectric grids that curb indirect cooling water linked to thermal generation.[3]eStruxture, “Fengate-Led Consortium Invests USD 1.8 Billion for Canadian Expansion,” eStruxture, estruxture.com Hydro-Québec expects data-center electricity demand to rise by 4.1 TWh between 2023 and 2032, underlining Canada’s ascendant role in the North America data center water consumption market.
Competitive Landscape
Moderate consolidation defines the North America data center water consumption market. The top five hyperscale cloud providers together account for about 68% of total data-center capacity, giving them leverage over municipal utilities for bulk-water contracts. Microsoft’s zero-water cooling R&D, scheduled for rollout in 2026, exemplifies vertical integration of both technology and sourcing.
Strategic alliances are multiplying. Carrier’s partnership with ZutaCore aligns hardware design with cooling chemistry, while Digital Realty teams with Dell and Intel to validate liquid-ready colocation suites. These moves accelerate commercialization cycles and lock in supply-chain relationships that smaller incumbents cannot easily replicate.
White-space entrants differentiate through extreme water efficiency. Scala Data Centers’ “AI City” campus in Brazil is exporting a zero-WUE blueprint to potential Arizona and Nevada sites, while atmospheric-water-generation startups court operators in Mexico’s dry highlands. As blocked projects exceed USD 64 billion in proposed capital, local authorities increasingly favor builders that present measurable replenishment plans, further shifting bargaining power within the North America data center water consumption market.
North America Data Center Water Consumption Industry Leaders
Google LLC (Alphabet Inc. )
Amazon Web Services, Inc.
Meta Platforms, Inc.
Microsoft Corporation
Digital Realty Trust, Inc.
- *Disclaimer: Major Players sorted in no particular order
Recent Industry Developments
- June 2025: University of California San Diego announced a passive-cooling breakthrough using engineered fiber-membrane technology that removes heat through evaporation and can significantly reduce data-center water consumption.
- April 2025: CyrusOne broke ground on the DFW7 campus in Fort Worth, Texas, with 70 MW initial capacity and a focus on sustainable cooling technologies.
- February 2025: Carrier launched the QuantumLeap suite of cooling solutions and announced a strategic investment in ZutaCore to accelerate direct-to-chip liquid-cooling adoption across data-center markets.
- January 2025: Aligned Data Centers secured USD 12 billion in equity and debt financing to expand AI-ready infrastructure across the Americas, emphasizing innovative cooling systems to address high-performance computing water consumption requirements.
North America Data Center Water Consumption Market Report Scope
North America Data Center Water Consumption Market is Segmented by Source of Water Procurement (Potable Water, Non-Potable/Treated Greywater, Alternate Sources), Data Center Type (Enterprise, Colocation, Cloud Service Provider), Data Center Size (Mega, Massive, Large, Medium, Small), Cooling Technology (Air-Based (CRAC / CRAH), Adiabatic / Evaporative Cooling Tower, Direct-to-Chip Liquid Cooling, Immersion Cooling), and Country (United States, Canada, Mexico). The Market Forecasts are Provided in Terms of Volume (Liters).
| Potable Water |
| Non-Potable / Treated Greywater |
| Alternate Sources (Ground-, Surface-, Sea-, Rainwater, OandG By-product) |
| Enterprise |
| Colocation |
| Cloud Service Provider (CSP) |
| Mega |
| Massive |
| Large |
| Medium |
| Small |
| Air-Based (CRAC / CRAH) |
| Adiabatic / Evaporative Cooling Tower |
| Direct-to-Chip Liquid Cooling |
| Immersion Cooling |
| United States |
| Canada |
| Mexico |
| By Source of Water Procurement | Potable Water |
| Non-Potable / Treated Greywater | |
| Alternate Sources (Ground-, Surface-, Sea-, Rainwater, OandG By-product) | |
| By Data Center Type | Enterprise |
| Colocation | |
| Cloud Service Provider (CSP) | |
| By Data Center Size | Mega |
| Massive | |
| Large | |
| Medium | |
| Small | |
| By Cooling Technology | Air-Based (CRAC / CRAH) |
| Adiabatic / Evaporative Cooling Tower | |
| Direct-to-Chip Liquid Cooling | |
| Immersion Cooling | |
| By Country | United States |
| Canada | |
| Mexico |
Key Questions Answered in the Report
What is the projected size of the North America water consumption market by 2030?
The market is forecast to reach 1.69 trillion liters in 2030, growing at a 9.40% CAGR.
Which segment is expanding the fastest by data-center type?
Colocation facilities are advancing at a 10.20% CAGR through 2030 as enterprises shift workloads to shared infrastructure.
How much of current cooling relies on air-based systems?
Air-based solutions still account for 83% of installed capacity in 2024, although they are steadily being displaced by liquid cooling.
Why are mega-scale data centers gaining share?
Their scale supports on-site treatment, reuse, and alternative sourcing, allowing an 11.12% CAGR while reducing per-unit water costs.


