Market Overview
| Study Period | 2020 - 2031 |
|---|---|
| Forecast Data Period | 2026 - 2031 |
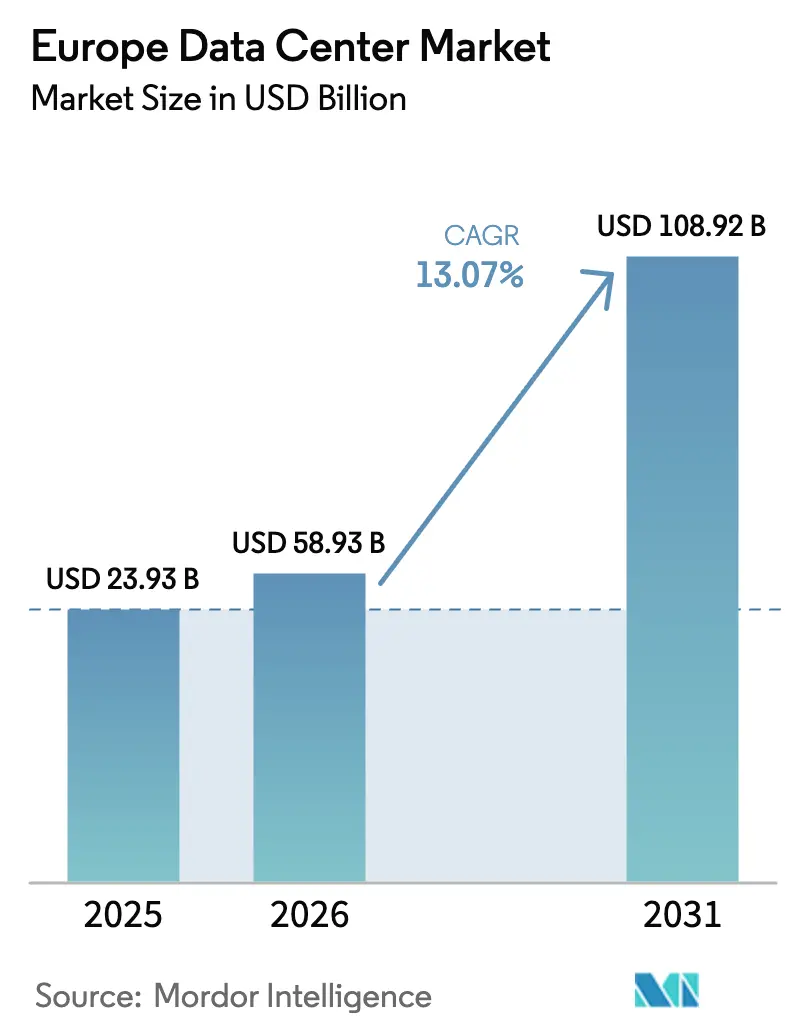
| Base Year Market Size (2025) | USD 23.93 Billion |
| Market Size (2026) | USD 58.93 Billion |
| Market Size (2031) | USD 108.92 Billion |
| Growth Rate (2026 - 2031) | 13.07% CAGR |
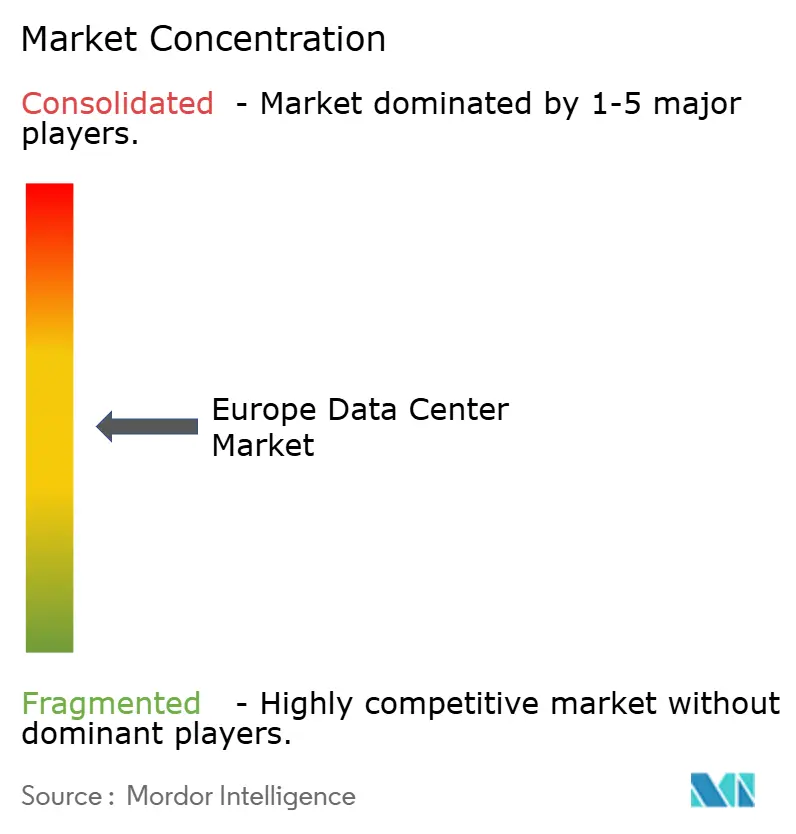
| Market Concentration | Medium |
Major Players *Disclaimer: Major Players sorted in no particular order Image © Mordor Intelligence. Reuse requires attribution under CC BY 4.0. | |
Europe Data Center Market Analysis by Mordor Intelligence
The Europe Data Center Market size was valued at USD 52.12 billion in 2025 and estimated to grow from USD 58.93 billion in 2026 to reach USD 108.92 billion by 2031, at a CAGR of 13.07% during the forecast period (2026-2031). In terms of the installed base, the market is expected to grow from 23.93 thousand megawatts in 2025 to 54.71 thousand megawatts by 2030, at a CAGR of 17.98% during the forecast period (2025-2030). The market segment shares and estimates are calculated and reported in terms of MW. Rapid scale-out by hyperscale cloud providers, accelerated 5G deployments, and strict regional data-sovereignty regulations collectively fuel capacity additions across both primary and secondary hubs. Intensifying edge computing requirements compel operators to distribute micro-facilities near end-users, while renewable energy power purchase agreements (PPAs) increasingly influence total cost of ownership decisions. Grid congestion in Frankfurt, London, Amsterdam, Paris, and Dublin (FLAP-D) prompts developers to scout less-crowded locales, and the interplay between carbon-reduction mandates and campus-level power procurement now defines competitive advantage. Persistent demand from banking, financial services, and insurance (BFSI) clients, as well as telecom operators, underscores the market’s resilience across macroeconomic cycles.
Key Report Takeaways
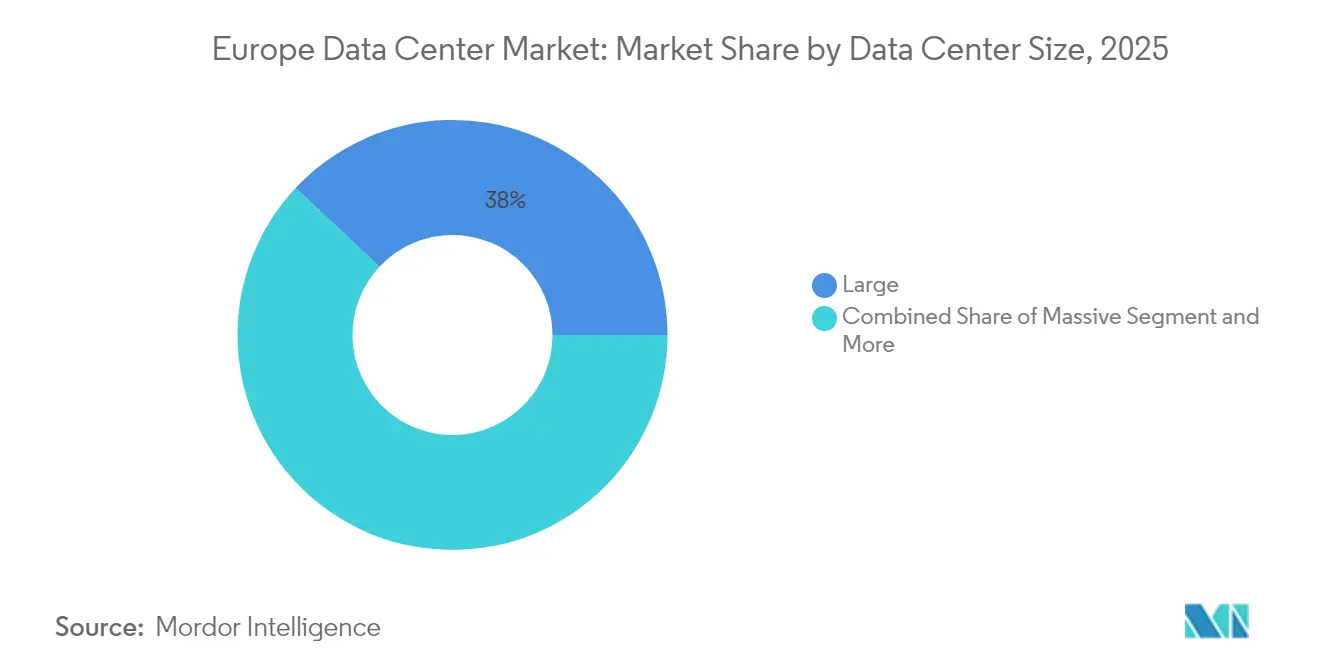
- By data center size, large facilities held 38.02% of Europe data center market share in 2025; massive deployments are forecast to expand at an 18.12% CAGR through 2031.
- By tier type, Tier 3 infrastructure commanded 60.62% share of the Europe data center market size in 2025, whereas Tier 4 is projected to grow fastest at an 17.86% CAGR.
- By data center type, colocation services accounted for 63.05% of the Europe data center market size in 2025, while hyperscale self-built facilities record the strongest 19.21% CAGR.
- By end user, IT and telecom represented 55.21% of Europe data center market share in 2025; the BFSI segment is advancing at an 17.95% CAGR to 2031.
- By geography, Germany led with 15.04% Europe data center market share in 2025, whereas the United Kingdom is set to post a 19.45% CAGR through 2031.
Note: Market size and forecast figures in this report are generated using Mordor Intelligence’s proprietary estimation framework, updated with the latest available data and insights as of 2026.
Europe Data Center Market Trends and Insights
Drivers Impact Analysis*
| Driver | (~) % Impact on CAGR Forecast | Geographic Relevance | Impact Timeline |
|---|---|---|---|
| Surging hyperscale cloud investment across FLAP-D | +3.20% | Germany, United Kingdom, Netherlands, France | Medium term (2-4 years) |
| Accelerated 5G rollouts driving edge demand | +2.80% | Urban Europe | Short term (≤2 years) |
| Data-sovereignty regulations such as GAIA-X | +2.10% | Core EU, Switzerland, Norway | Long term (≥4 years) |
| Renewable energy PPAs lowering TCO | +1.90% | Nordics, Spain, Germany | Medium term (2-4 years) |
| Submarine cable expansion into secondary hubs | +1.60% | Mediterranean, Baltic coastlines | Long term (≥4 years) |
| Nordic tax incentives for modular builds | +1.40% | Sweden, Norway, Denmark, Finland | Short term (≤2 years) |
| Source: Mordor Intelligence | |||
Surging Hyperscale Cloud Investment Across FLAP-D Markets
Record capital commitments by Amazon Web Services, Microsoft, and Google underscore a deep pipeline of hyperscale capacity additions. Aws earmarked EUR 8.8 billion (USD 10.24 billion) for Frankfurt expansions through 2026, while Microsoft is injecting USD 3.2 billion into Swedish cloud infrastructure to serve Northern Europe.[1] Amazon Web Services, “AWS Announces €8.8 Billion Investment in Germany,” aws.amazon.comGoogle’s EUR 1 billion Finnish build-out highlights a shift toward colder climates with abundant renewables. These projects emphasize artificial-intelligence workloads that demand higher power densities and liquid-cooling systems. European operators such as Data4 respond with multibillion-euro campus plans that feature 100 MW+ blocks and on-site substations. Collectively, these investments compress build timelines, elevate land prices near major peering exchanges, and accelerate competitive differentiation based on sustainability metrics.
Accelerated 5G Rollouts Driving Edge Data Center Demand
Telecom carriers rolling out private 5G services push compute resources closer to factories, hospitals, and city centers to achieve sub-10 millisecond latency. Nokia reports a sharp uptick in micro-facility tenders located within 20 kilometers of manufacturing clusters as Industry 4.0 transitions from pilot to production. [2]Nokia, “Private 5G Networks Drive Edge Demand,” nokia.com BSO’s EUR 100 million (USD 116.36 million) DataOne site in London, purpose-built for high-frequency trading, exemplifies this distributed strategy. Edge nodes also anchor content-delivery and autonomous-vehicle testbeds, broadening the customer mix for regional colocation providers. Spectrum authorities fast-track 5G allocations for private enterprise networks, accelerating procurement cycles. Resulting traffic localization amplifies demand for hardened space and power outside traditional core hubs.
Data Sovereignty Regulations Such as GAIA-X Pushing In-Region Storage
The GAIA-X initiative compels European enterprises to retain full operational control over data-processing locales and interfaces. [3]GAIA-X, “Federated Cloud Infrastructure Framework,” gaia-x.eu Banks and insurers move mission-critical workloads into EU-governed regions to meet supervisory guidelines and client expectations. OVHcloud leverages its European roots to win contracts that stipulate non-extraterritorial jurisdiction. Sovereignty requirements extend beyond physical location to include credential management, audit access, and encryption-key residency, raising the bar for compliance audits. As national governments roll out mandatory domestic hosting for sensitive sectors, a protected revenue stream emerges for providers able to document end-to-end European oversight.
Rapid Build-Out of Renewable Energy PPAs Lowering TCO
Long-dated PPAs with wind and solar producers in Spain and the Nordics mitigate electricity price volatility while slashing Scope 2 emissions. Spain’s abundance of utility-scale solar assets has yielded some of the lowest unit costs for new megawatts dedicated to data center consumption. [4]Spanish Wind Energy Association, “Renewables and Data Centers,” aeeolica.org Nordic hydro and on-shore wind offer nearly carbon-free baseload, aligning with EU taxonomy rules that steer institutional capital toward green assets. Microsoft’s Swedish wind farm-backed data centers illustrate vertically integrated power sourcing models. Intelligent workload-scheduling platforms now shift compute to regions with immediate renewable oversupply, further enhancing energy-cost arbitrage opportunities. Together, these factors compress operating margins for fossil-fuel-reliant facilities and redirect new builds toward green-power clusters.
Restraints Impact Analysis*
| Restraint | (~) % Impact on CAGR Forecast | Geographic Relevance | Impact Timeline |
|---|---|---|---|
| Grid congestion and power availability limitations | -1.8% | Frankfurt, London, Amsterdam, Dublin | Short term (≤2 years) |
| Extended permitting timelines amid environmental pushback | -1.2% | Germany, Netherlands, United Kingdom suburbs | Medium term (2-4 years) |
| High-voltage equipment bottlenecks (HV transformers and switchgear) leading to delayed energization | -0.9% | Germany, Ireland, Nordics; CEE hubs (Poland, Czechia) | Short–medium term (1–3 years) |
| Cooling water availability and sustainability restrictions (drought, discharge limits) raising capex/ops complexity | -0.7% | Spain, Portugal, Italy, Southern France | Medium–long term (2–5 years) |
| Source: Mordor Intelligence | |||
Grid Congestion and Power Availability Constraints in Tier-I Markets
Power-distribution bottlenecks in FLAP-D arise as existing substations near capacity, triggering moratoria on new megawatt connections in Amsterdam and Dublin.[5]Amsterdam Municipality, “Data Center Development Moratorium,” amsterdam.nl National Grid ESO notes that London requires multi-billion-euro uprates by 2027 to support projected hyperscale loads. Consequently, operators pivot to secondary metros or conceive sub-50 MW modular deployments distributed across multiple grid-nodes. Investors factor in 3-to-5-year lead times for network reinforcements, reshaping return-on-capital expectations. Some hyperscalers lock in dedicated generation assets, such as gas peakers paired with battery storage, to bypass utility queues, albeit at higher upfront capital intensity.
Long Permitting Timelines Due to Environmental Opposition
Community activism and stringent environmental reviews extend project cycles across densely populated regions. German federal guidelines require full lifecycle impact analyses that add 18-to-24 months to traditional schedules. The Netherlands enforces spatial-planning caps that prevent large concrete structures near residential zones, limiting site options around the Amsterdam metro. Objections commonly cite noise, land-use change, and heat-emission footprints. To gain approval, developers incorporate waste-heat reuse into district-heating grids and offer community-benefit funds. While these steps build local goodwill, they increase design complexity and cost, tempering near-term capacity additions in prime corridors.
*Our forecasts treat driver/restraint impacts as directional, not additive. The impact forecasts reflect baseline growth, mix effects, and variable interactions.
Segment Analysis
By Data Center Size: Massive Facilities Lead Growth Acceleration
Massive sites accounted for a 38.02% slice of the Europe data center market size in 2025 and are on track to outpace all other categories at an 18.12% CAGR through 2031. Enterprises continue leasing sizeable footprints inside these campuses to access hyperscale-like efficiencies without capital exposure. The Europe data center market benefits from Brookfield’s USD 10 billion Swedish artificial-intelligence hub, which illustrates investor appetite for 100 MW-plus single-building loads.
Mega campuses, some exceeding 500 MW across multiple halls, represent the next frontier. Such projects require dedicated substations and multi-gigabit fiber rings, hence cluster around heavy-industry brownfields where land is abundant. Modular design advances enable rapid expansion phases, allowing operators to defer spend until lease-up milestones trigger. Conversely, medium and small facilities cater to latency-sensitive or regulatory-restricted workloads. Although their Europe data center market share declines incrementally, they remain critical in edge rollouts and sovereign micro-cloud deployments.


By Tier Type: Tier 4 Infrastructure Gains Hyperscale Traction
Tier 3 dominated with 60.62% share of the Europe data center market size in 2025, serving mainstream workloads that balance redundancy and cost. Hyperscalers, however, increasingly demand Tier 4 certifications, driving an 17.86% CAGR for the category as artificial-intelligence training and financial-transaction clearing mandate near-zero downtime.
Investments in concurrent-maintainability designs, dual power spines, and fault-tolerant cooling elevate capital intensity yet unlock premium pricing models focused on availability guarantees. Lower tiers see diminished relevance except in test or batch-processing environments. Regulatory pushes for continuous data-protection audits under GDPR further favor high-tier builds, cementing Tier 4’s ascent across both mature and emerging sub-regions.
By Data Center Type: Hyperscale Self-Built Accelerates at Premium Growth
Colocation remained supreme with 63.05% of the Europe data center market share in 2025, but self-built hyperscale assets will race ahead at a 19.21% CAGR as cloud majors crave bespoke densities and liquid-cool deployments. Custom campus blueprints allow operators to position high-usage GPUs and optical interconnects without multi-tenant design compromises.
Retail colocation still attracts small and medium enterprises transitioning from on-premises rooms, while wholesale suites accommodate regional software-as-a-service platforms pursuing dedicated cages. Edge-only facilities appear in 1–5 MW blocks and emphasize local peering rather than large floor plates. Collectively, these archetypes populate a continuum that lets customers shift between models as digital-transformation roadmaps evolve.

By End User: BFSI Sector Drives Digital Transformation Investments
IT and telecom players generated 55.21% of overall demand in 2025, powered by 5G core rollouts and network-function virtualization initiatives. The BFSI vertical, at an 17.95% CAGR, is the most aggressive adopter of high-tier infrastructure due to stringent uptime and encryption obligations.
E-commerce spikes prompt seasonal leasing of burst-capacity cages, while media companies require contiguous racks with 100 Gbps ports to stream 4K and 8K content. Manufacturing customers install edge nodes on factory grounds to govern robotic assembly lines and predictive-maintenance analytics. Governments embed security-cleared rooms inside accredited colocation sites to align with cloud-first mandates yet remain compliant with classified-data handling protocols.
Geography Analysis
Germany held a 15.04% leadership position in 2025, underpinned by Frankfurt’s role as DE-CIX’s heart and the nation’s extensive industrial-grade grid. Expansion projects, such as Data4’s multi-site investment program, proceed despite rigorous environmental reviews that stretch delivery timelines. Renewable-energy adoption, propelled by national Energiewende policies, prompts operators to blend on-site solar arrays with PPAs for hydro and offshore wind.
The United Kingdom posts the highest growth trajectory at a 19.45% CAGR, as London’s liquidity pools and Scotland’s renewable corridors converge with investor confidence following post-Brexit clarity. The United Kingdom government’s AI strategy funnels grants and tax credits toward compute-intensive R and D clusters, drawing both domestic and overseas capital. Secondary nodes in Manchester and Cardiff gain momentum as London’s grid tightens and space premiums rise.
France, the Netherlands, Spain, and Nordics each carve specific niches. France aligns with sovereignty goals by nurturing domestic providers under cybersecurity-certification schemes. Amsterdam grapples with grid moratoria yet retains its strategic magnetism through dense submarine-cable landings. Spain’s sunny climate fuels low-cost solar PPAs that lure AI and blockchain operators. Nordic states capitalize on free-cooling climates, low carbon intensity, and favorable depreciation schedules, positioning Stockholm and Oslo as preferred destinations for GPU-rich clusters.
Competitive Landscape
Competitive intensity is rising as hyperscale self-build programs remove megawatts from the retail colocation pipeline, prompting incumbents to differentiate through interconnection fabrics, managed security, and sustainability credentials. Digital Realty and Equinix leverage pan-European footprints and neutral-carrier exchanges to maintain stickiness, while OVHcloud markets its European ownership structure to sovereignty-minded clients. Regional specialists, including NorthC and AQ Compute, scale through acquisitions that knit together edge-oriented sites across Benelux and DACH regions.
Technology moats now center on immersion-cooling systems, AI-ready cage densities, and real-time carbon-tracking dashboards aligned with EU taxonomy disclosures. Strategic alliances emerge between colocation landlords and chip manufacturers to host reference clusters that shorten supply chains for cloud service rollouts. Liquid-cool retrofits spread as operators strive to support 100 kW racks without overhauling entire mechanical plants.
Private-equity inflows accelerate consolidation, with Bain Capital’s EUR 800 million (USD 930.85 million) purchase of AQ Compute illustrating appetite for cash-flow-stable yet growth-rich assets. Meanwhile, open compute-inspired designs erode proprietary hardware margins, nudging operators to monetize differentiators such as dark-fiber overlays, sovereign cloud zones, and AI model hosting platforms. Overall, competitive focus shifts from gross-area metrics to workload suitability, environmental impact, and cross-border compliance frameworks.
Europe Data Center Industry Leaders
Amazon Web Services, Inc.
Microsoft Corporation
Digital Realty Trust Inc.
Equinix, Inc.
Google Inc.
- *Disclaimer: Major Players sorted in no particular order

Recent Industry Developments
- January 2025: OpenAI announced partnership with Norwegian data center operators to establish Arctic infrastructure for artificial-intelligence training workloads.
- December 2024: Brookfield Asset Management committed USD 10 billion to Swedish artificial-intelligence infrastructure development.
- November 2024: Microsoft expanded its Swedish cloud infrastructure investment to USD 3.2 billion.
- October 2024: Bain Capital completed acquisition of AQ Compute for EUR 800 million (USD 930.85 million), broadening European edge reach.


Europe Data Center Market Report Scope
Large, Massive, Medium, Mega, Small are covered as segments by Data Center Size. Tier 1 and 2, Tier 3, Tier 4 are covered as segments by Tier Type. Non-Utilized, Utilized are covered as segments by Absorption. France, Germany, Ireland, Netherlands, Norway, Spain, Switzerland, United Kingdom are covered as segments by Country.
By Data Center Size
| Large |
| Massive |
| Medium |
| Mega |
| Small |
By Tier Type
| Tier 1 and 2 |
| Tier 3 |
| Tier 4 |
By Data Center Type
| Hyperscale/Self-built | ||
| Enterprise/Edge | ||
| Colocation | Non-Utilized | |
| Utilized | Retail Colocation | |
| Wholesale Colocation | ||
By End User
| BFSI |
| IT and ITES |
| E-Commerce |
| Government |
| Manufacturing |
| Media and Entertainment |
| Telecom |
| Other End Users |
By Country
| United Kingdom |
| Germany |
| France |
| Russia |
| Belgium |
| Spain |
| Norway |
| Austria |
| Netherlands |
| Italy |
| Sweden |
| Switzerland |
| Denmark |
| Rest of Europe |
| By Data Center Size | Large | ||
| Massive | |||
| Medium | |||
| Mega | |||
| Small | |||
| By Tier Type | Tier 1 and 2 | ||
| Tier 3 | |||
| Tier 4 | |||
| By Data Center Type | Hyperscale/Self-built | ||
| Enterprise/Edge | |||
| Colocation | Non-Utilized | ||
| Utilized | Retail Colocation | ||
| Wholesale Colocation | |||
| By End User | BFSI | ||
| IT and ITES | |||
| E-Commerce | |||
| Government | |||
| Manufacturing | |||
| Media and Entertainment | |||
| Telecom | |||
| Other End Users | |||
| By Country | United Kingdom | ||
| Germany | |||
| France | |||
| Russia | |||
| Belgium | |||
| Spain | |||
| Norway | |||
| Austria | |||
| Netherlands | |||
| Italy | |||
| Sweden | |||
| Switzerland | |||
| Denmark | |||
| Rest of Europe | |||


Key Questions Answered in the Report
What capacity additions are expected for Europe data centers by 2031?
Installed IT load is projected to rise from 23.93 thousand MW in 2025 to 28.16 thousand MW in 2026 and 63.49 thousand MW by 2031, reflecting an 17.65% CAGR during the forecast period (2026-2031).
Which European country shows the fastest growth in new facilities?
The United Kingdom is anticipated to expand at a 19.45% CAGR through 2031, driven by post-Brexit investment incentives and London’s finance-sector demand.
Why are renewable energy PPAs important for operators?
Long-term PPAs in Spain and the Nordics lower electricity costs and help facilities comply with EU carbon-reduction mandates, directly influencing site-selection decisions.
How are 5G rollouts reshaping the data center footprint?
Private 5G networks require micro-facilities within 10–20 kilometers of users, stimulating edge deployments across urban and industrial zones.
What makes Tier 4 sites attractive to hyperscalers?
Tier 4 offers fault-tolerant design and near-zero downtime, essential for AI model training and regulated financial workloads that cannot tolerate service interruption.
How do data-sovereignty laws affect provider choice?
Regulations like GAIA-X require in-region control over infrastructure and data, prompting enterprises to favor operators that can guarantee European jurisdictional oversight.
Page last updated on:


