
Cable Connector Market Size and Share
Market Overview
| Study Period | 2020 - 2031 |
|---|---|
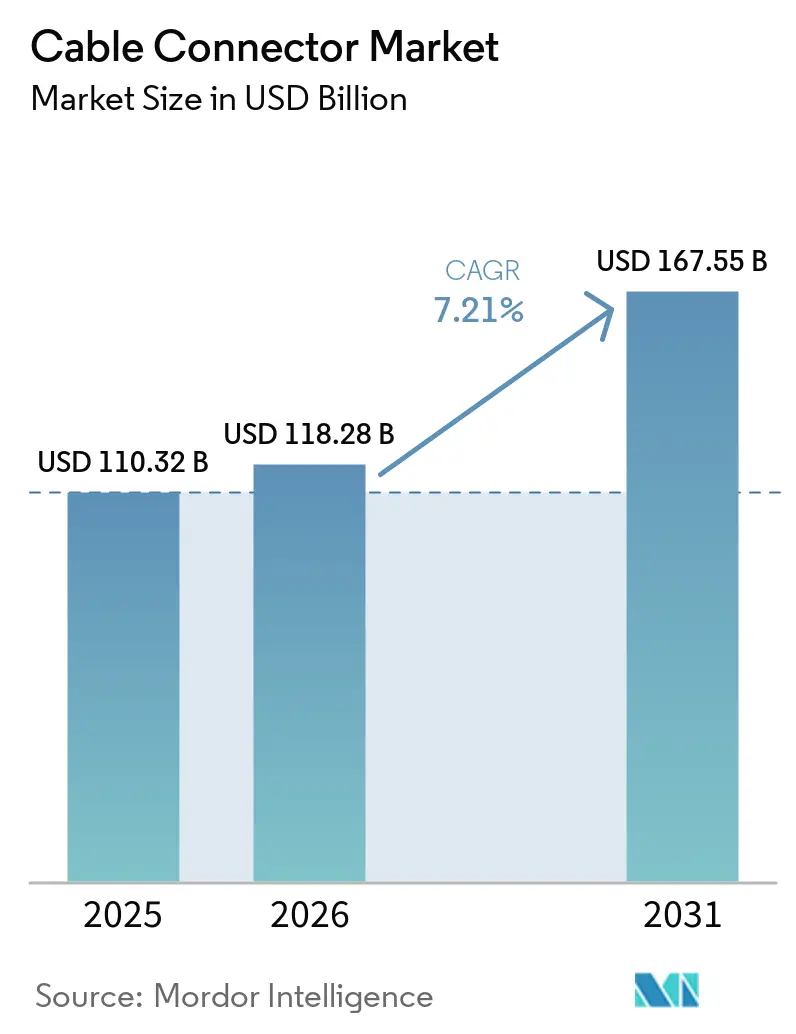
| Market Size (2026) | USD 118.28 Billion |
| Market Size (2031) | USD 167.55 Billion |
| Growth Rate (2026 - 2031) | 7.21 % |
| Fastest Growing Market | Asia Pacific |
| Largest Market | Asia Pacific |
| Market Concentration | Medium |
Major Players *Disclaimer: Major Players sorted in no particular order Image © Mordor Intelligence. Reuse requires attribution under CC BY 4.0. | |
Cable Connector Market Analysis by Mordor Intelligence
The cable connector market size is expected to grow from USD 110.32 billion in 2025 to USD 118.28 billion in 2026 and is forecast to reach USD 167.55 billion by 2031 at 7.21% CAGR over 2026-2031. Current expansion reflects a decisive swing toward higher-value, technically advanced connector solutions that sustain pricing power even when copper and precious-metal costs remain volatile. Growth momentum stems from simultaneous 5G roll-outs, electric-vehicle (EV) production scaling, and hyperscale data-center upgrades that mandate ultra-high-speed interconnects. Asia-Pacific holds structural cost and scale advantages, but supply-chain diversification toward North America and Europe is accelerating as geopolitical tension rises. Competitive intensity remains moderate because design complexity, qualification cycles, and patent portfolios temper rapid commoditization, allowing incumbents to defend share while emerging Asian firms pursue cost-led disruption.
Key Report Takeaways
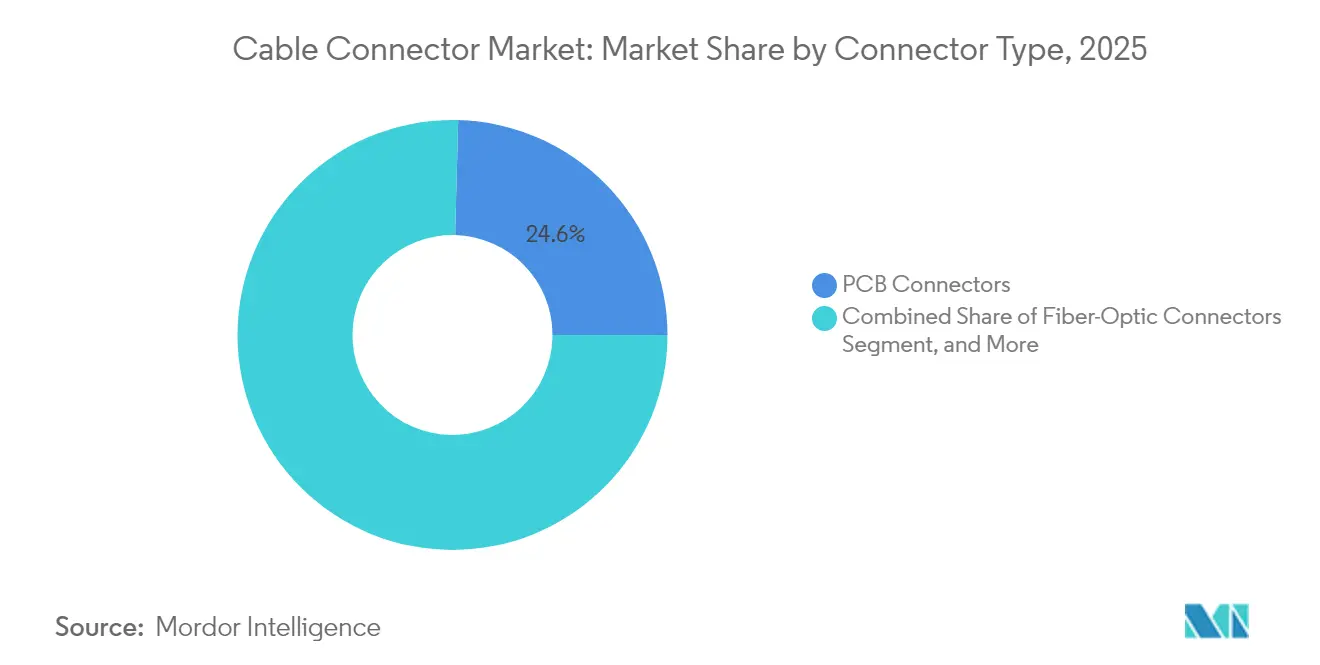
- By connector type, PCB connectors led with 24.58% of cable connector market share in 2025, while power and high-voltage EV connectors posted the fastest 8.52% CAGR through 2031.
- By mounting configuration, board-to-board solutions held 35.62% share of the cable connector market size in 2025, whereas panel or feed-through formats are projected to expand at a 8.78% CAGR.
- By end-user industry, consumer electronics accounted for a 26.92% share of the cable connector market in 2025; automotive and transportation are advancing at an 8.33% CAGR.
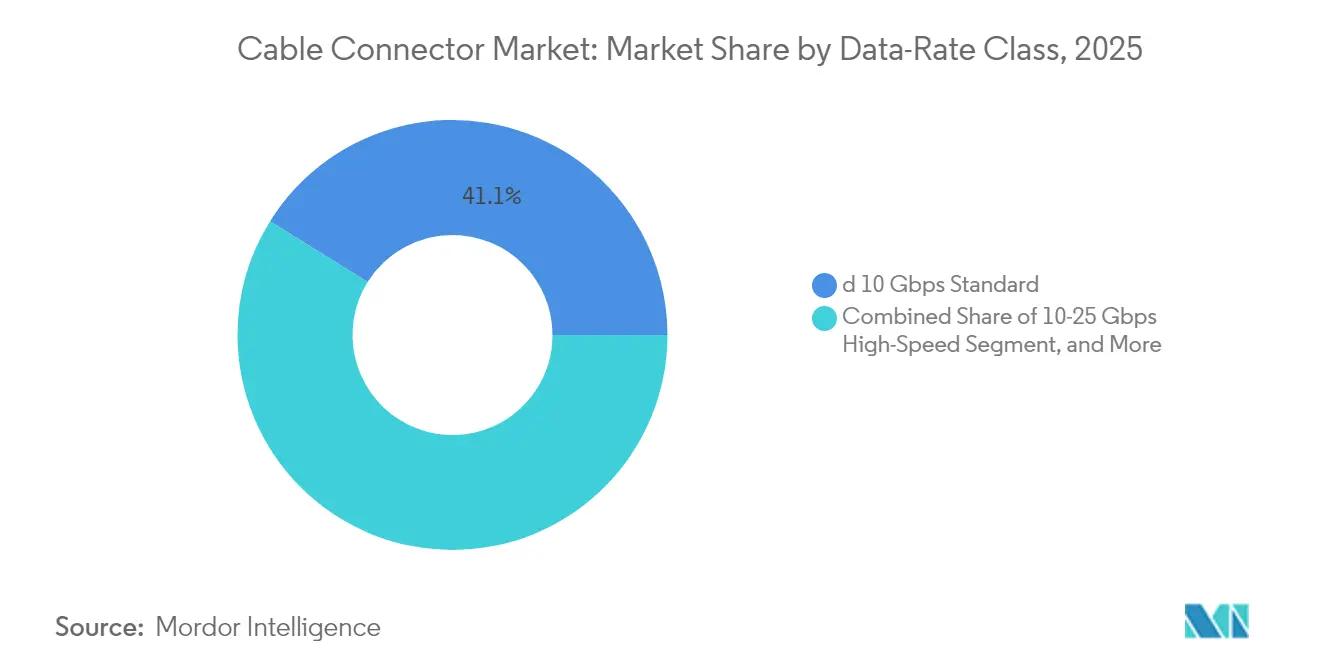
- By data-rate class, standard ≤10 Gbps connectors captured 41.12% share of the cable connector market in 2025, yet ultra-high-speed ≥25 Gbps solutions are growing at an 8.25% CAGR.
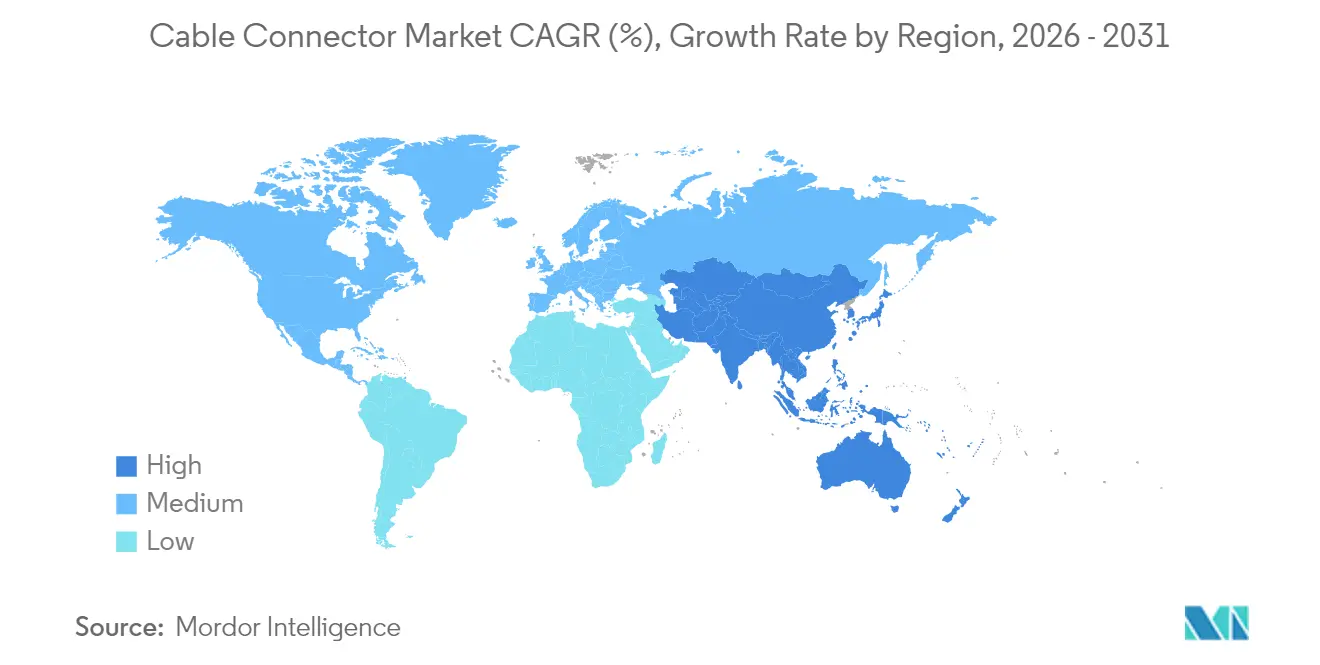
- By geography, Asia-Pacific commanded a 42.05% share of the cable connector market in 2025 and continues as the fastest region with an 7.88% CAGR to 2031.
Note: Market size and forecast figures in this report are generated using Mordor Intelligence’s proprietary estimation framework, updated with the latest available data and insights as of 2026.
Market Trends and Insights
Drivers Impact Analysis of Cable Connector Market*
| Driver | (~) % Impact on CAGR Forecast | Geographic Relevance | Impact Timeline |
|---|---|---|---|
| 5G roll-out and fiber backhaul densification | +1.8% | Global, APAC and North America | Medium term (2-4 years) |
| Miniaturization of electronics | +1.2% | Global, APAC hubs | Long term (≥ 4 years) |
| Rapid EV production ramp-up | +1.5% | Global, Europe and China | Medium term (2-4 years) |
| Co-packaged optics adoption | +0.9% | North America and APAC | Short term (≤ 2 years) |
| PCIe Gen5/Gen6 12 VHPWR GPU power spec | +0.7% | Global data-center nodes | Short term (≤ 2 years) |
| Government on-shore manufacturing incentives | +0.6% | North America and Europe | Long term (≥ 4 years) |
| Source: Mordor Intelligence | |||
5G Roll-out and Fiber Backhaul Densification
Global 5G deployment demands high-frequency connectors that preserve signal integrity at millimeter-wave bands while tolerating outdoor stressors and temperature swings.[1]Ericsson AB, “5G Infrastructure Requirements and Deployment Trends,” ericsson.com Each new 5G macro site integrates three to four times more fiber runs than legacy 4G sites, multiplying optical connector volume. Small-cell densification in urban cores further boosts demand for sealed, IP67/IP68 connectors capable of rapid field installation. Private 5G networks inside factories extend requirements to ruggedized connectors that resist oil mist, vibration, and thermal cycling. As densification accelerates, optical-connector suppliers that can combine low insertion loss with tool-less termination gain pricing leverage.
Miniaturization of Electronics
Smartphones, wearables, industrial sensors, and medical patches now integrate more functionality in tighter envelopes. Pitch distances below 0.5 mm and height profiles under 1 mm are becoming default design rules, pushing connector makers to invest in precision molding, vision-guided pick-and-place, and laser-welded shielding.[2]Samtec Inc., “Fine-Pitch Connector Manufacturing,” samtec.com Advanced cameras and VR headsets demand high-pin-count board-to-board connectors that withstand repeated hinge movement without intermittency. Industrial IoT deployments require similar compactness yet must survive −40 °C to 125 °C temperatures. Vendors that align with mini-LED backlighting and foldable-device roadmaps secure multi-year design wins that lock in demand over product lifecycles.
Rapid EV Production Ramp-up
The shift toward 800 V architectures and 350 A charging currents drives a niche for high-voltage, high-current connectors featuring advanced insulation and thermal paths.[3]Porsche AG, “Taycan 800 V Architecture and Charging Technology,” newsroom.porsche.com ISO 26262 functional-safety mandates introduce interlock and arc-fault detection features that increase part complexity and validation time. Automakers simultaneously pressure suppliers for lighter, space-saving designs to extend vehicle range, prompting exploration of copper-nickel-silicon alloys that offer comparable conductivity at lower weight. Each battery-electric vehicle uses three to four times more connectors than an internal-combustion model, and the cable connector market therefore scales directly with BEV assembly volumes.
Co-Packaged Optics Adoption
Hyperscale operators embrace co-packaged optics (CPO) to cut switch power by roughly 30% while hitting 51.2 Tbps bandwidth targets.[4]Broadcom Inc., “Co-Packaged Optics Solutions for Data Centers,” broadcom.com CPO integrates optical engines beside ASICs, eliminating pluggable optics and calling for bespoke, ultra-short copper interposers with alignment tolerances below 0.1 µm. Connector firms collaborate with switch-silicon vendors from the concept stage, which locks out fast-follower competitors. Designs must contain electromagnetic interference that rises steeply above 56 GHz, spurring investment in proprietary dielectric films and shield geometries. Early movers enjoy premium pricing because qualification demands extend well beyond commodity expectations.
Restraints Impact Analysis of Cable Connector Market*
| Restraint | (~) % Impact on CAGR Forecast | Geographic Relevance | Impact Timeline |
|---|---|---|---|
| Copper and precious-metal price volatility | -0.8% | Global | Short term (≤ 2 years) |
| Alignment tolerances below 0.5 mm pitch | -0.6% | Global, high-tech hubs | Medium term (2-4 years) |
| High scrap rates for ultra-fine-pitch SMT | -0.4% | APAC manufacturing | Short term (≤ 2 years) |
| IP-rated sealing cost inflation | -0.3% | Global industrial sites | Long term (≥ 4 years) |
| Source: Mordor Intelligence | |||
Volatility of Copper and Precious-Metal Prices
Copper traded between USD 8,000 and USD 11,000 per ton during 2024–2025, and gold plating jumped 40% year on year, slicing margins for cost-sensitive standard connectors. Selective plating and alloy substitution offset some swings, but long-term fixed-price contracts expose mid-tier suppliers to losses when raw-material hedges misalign. Larger vendors use scale to negotiate variable pricing clauses, but smaller firms struggle to absorb quarterly shocks. End customers push back on surcharges, slowing pass-through, and elongating cash-conversion cycles.
Alignment Tolerances Below 0.5 mm Pitch
As pitches tighten to meet miniaturization roadmaps, tooling accuracy must hold ±0.05 mm, raising capex by up to 80% compared with conventional lines. Vision inspection, force-feedback insertion testing, and specialized reflow profiles add process steps that extend time-to-volume and lift scrap rates above 7% in first production runs. The learning curve penalizes late entrants, and any latent alignment drift triggers latent field failures, undermining OEM confidence. Resultant warranty reserves and field-service campaigns act as direct hits to operating margins.
*Our forecasts treat driver/restraint impacts as directional, not additive. The impact forecasts reflect baseline growth, mix effects, and variable interactions.
Cable Connector Market Segment Analysis
By Connector Type:
Power Formats Accelerate in EV PlatformsThe connector-type landscape shows PCB connectors retaining 24.58% cable connector market share in 2025, thanks to their omnipresence across consumer, telecom, and industrial electronics. Revenue in this segment stayed on pace with the overall cable connector market at a mid-single-digit CAGR, aided by shrinking pitch innovations and higher pin densities. Circular and rectangular connectors maintained solid positions in aerospace and defense as reliability certifications justify premium pricing and lengthy contracts. Fiber-optic interfaces prospered alongside data-center and 5G fronthaul investments, where reduced insertion loss and outdoor durability attract infrastructure spending. I/O and RF coaxial designs reinforced their niches in test equipment and instrumentation, where repeatability counts more than sheer volume. The standout growth story resides in power and high-voltage EV connectors, projected at an 8.52% CAGR through 2031. They benefit from every new battery-electric platform that mandates 800 V architectures and ultrafast charging demand, creating the fastest-moving pocket of the cable connector market.
Global OEM qualification criteria demand arc-suppression, touch-proof enclosures, and thermocouple integration to monitor junction temperatures. These design layers inflate the average selling price even as they limit qualified supplier pools. Established automotive-grade connector specialists leverage process technologies such as cavity-free over-molding to minimize resistive losses, while new entrants target cost-down variants for two-wheel electrification in India and Southeast Asia. Segment leaders that can harmonize international standards like IEC 62196 with regional charging protocols win multi-year sourcing deals. The combined effect positions the power connector segment as the largest contributor to incremental cable connector market size over the forecast horizon.



By Mounting Configuration:
Panel Solutions Win at the EdgeBoard-to-board assemblies dominated 35.62% of the cable connector market size in 2025, underpinned by complex multi-board electronics architectures that characterize mobile devices, laptops, and advanced driver-assistance systems. OEMs favor ultra-low-profile stacking connectors that survive torsional stress during drop events. Wire-to-board variants persist in markets where field-service interchangeability trumps internal space constraints, such as factory automation panels. Cable-to-cable links excel in modular robotic arms and renewable-energy combiner boxes where re-routing flexibility is paramount.
Panel or feed-through solutions, while representing a smaller base, chart a 8.78% CAGR into 2031 as edge-computing cabinets, outdoor 5G radios, and battery-storage enclosures require hermetic seals and rapid mating. IP67 and IP68 compliance add material layers and gasketing complexity that increase ticket prices. Hybrid power-and-signal feed-through models enable single-hole installations that trim labor time during tower climbs or skid-mount deployments. Vendors that pre-integrate EMC shielding and condensation venting capture specification wins among telecom tower OEMs. Consequently, panel configurations stand out as share-gainers in the cable connector market.
By End-User Industry:
Vehicle Electrification Ups the StakesConsumer electronics held 26.92% share in 2025, buoyed by unit volumes in smartphones, tablets, and wearables. However, price sensitivity and continual miniaturization erode per-unit connector revenue. IT and telecom infrastructure purchases intensify demand for QSFP-DD and OSFP modules at 25 Gbps lanes and higher, catalyzing growth in high-speed board-edge connectors that complement fiber modules. Industrial automation requires metal-shell M12 and M8 connectors with vibration resistance, helping suppliers preserve margins when mass-market handset contracts tighten. Energy, power, and subsea projects order stainless-steel or titanium variants able to withstand pressure and corrosion, often at ten times the average market pricing.
Automotive and transportation surfaces as the fastest movers with an 8.33% CAGR. Each battery pack integrates thousands of signal and power terminals that monitor cell voltages, coolant-pump speeds, and inverter status. High-speed telematics, lidar systems, and in-cabin infotainment add separate connector stacks. Asia-Pacific assemblers press for cost-effective yet reliable connectors, while European luxury brands stipulate rigorous salt-spray and thermal-shock tests. Vendors proficient in zero-defect capabilities and automatic optical inspection present compelling value propositions, propelling automotive volumes to drive net new cable connector market size.
By Data-Rate Class:
Ultra-High-Speed Lifts ASPStandard ≤10 Gbps interfaces remained the volume leader at 41.12% share in 2025. These products power legacy Ethernet, USB 3.x, and HDMI 2.1 ecosystems where mature tooling yields competitive cost structures. High-speed 10–25 Gbps designs address enterprise storage, edge routers, and surveillance backhaul, often combining twin-ax cabling with low-profile mezzanine connectors to balance signal integrity and thermal dissipation in ethernet connector and transformer applications.
Ultra-high-speed ≥25 Gbps formats command the steepest ASP uplift and post an 8.25% CAGR as 400G and 800G switch upgrades accelerate inside hyperscale data centers. PCIe Gen5 and Gen6 workloads draw on 12 VHPWR connectors for AI accelerator cards, driving robust orders among Tier-1 cloud providers. Signal-integrity challenges increase exponentially beyond 56 Gbps PAM4, requiring coherent copper-foil structures and selective plating to mitigate skin-effect losses. Suppliers with in-house simulation and test labs enjoy an entry barrier that supports healthy gross margins despite material inflation. Overall, speed class migration functions as a structural catalyst for premium-priced cable connector market subsegments.
By Material:
Copper-Nickel-Silicon Gains TractionCopper-alloy connectors accounted for a 36.22% share in 2025 owing to favorable conductivity and entrenched supply chains. Gold-over-nickel plating ensures oxidation resistance in data-center operating environments, although price spikes pressure bills of material. Aluminum and lightweight alloys notch incremental share in aerospace and EV domains, where every gram saved translates to range extension or fuel savings.
Engineering plastics such as PBT and LCP replace metal housings in moisture-tolerant or RF-transparent applications, with polymer scientists adapting flame-retardant grades that pass UL 94 V-0 while resisting reflow-oven shrinkage. Precious-metal-plated products stay mission-critical for spaceflight and surgical devices despite price fluctuations. The fastest-growing pocket is copper-nickel-silicon alloy, projected at a 8.84% CAGR, delivering better stress relaxation and spring properties than phosphor-bronze at comparable conductivity. Automakers embrace the alloy in 800 V battery connectors to keep contact resistance low across half a million load cycles. Resulting adoption lifts material innovation into an influencer role on the future cable connector market size.
Geography Analysis
APAC Cable Connector Market
Asia-Pacific retained a 42.05% share in 2025 as China, Japan, and South Korea clustered semiconductor, smartphone, and EV production in integrated supply ecosystems. Regional CAGR is forecast at 7.88%, buoyed by domestic 5G base-station rollouts and state incentives for local EV brands. Growing regional wage costs and geopolitical uncertainty prompt multinationals to add second-source capacity in Vietnam and India, yet proximity advantages and established tooling networks continue to anchor large production runs within China. Governments add grants for indigenous connector R&D to climb the value chain and reduce import reliance.
North America Cable Connector Market
North America ranks second in revenue on the back of data-center construction that supports AI and machine-learning services. Hyperscale operators stipulate 800G optical links and 12 VHPWR power delivery, pushing local contract manufacturers to qualify new connector lines. The United States CHIPS and Science Act subsidizes on-shore tooling for high-speed interconnects, while Canada’s automotive clusters pivot toward EV assembly that consumes large numbers of sealed, high-current connectors. Mexico absorbs near-shored assembly volumes as OEMs hedge East-Asian exposure.
Europe Cable Connector Market
Europe posts steady expansion driven by automotive electrification and industrial automation investment. Germany’s machine-tool builders specify M12 and Push-Pull connectors that withstand 10 g vibration profiles, sustaining premium orders for ruggedized formats. The European Union’s strategic-autonomy policies channel grants toward connector manufacturing, boosting mid-size suppliers in Italy and Poland. United Kingdom data-center expansion and offshore wind installations lift demand for fiber-optic and subsea connectors, respectively, giving diverse avenues for cable connector market growth.

Regulatory Landscape
Regulation and standards for cable connectors increasingly center on harmonized interface specifications, environmental compliance, and product-level efficiency requirements. In the EU, Commission Regulation (EU) 2025/2052 (adopted October 13, 2025) introduced ecodesign requirements for USB Type-C cables, including limits related to energy losses and markings that indicate maximum power capability. This tightens compliance expectations for high-volume consumer and IT cable assemblies sold into Europe. European compliance rules are tightening requirements for consumer and IT cable assemblies.
Standards updates also influence qualification and redesign cycles across major connector families. EN IEC 62680-1-3:2026 formalizes technical specifications for USB Type-C cable and connector interfaces, while CENELEC work to implement IEC 61076-2:2025 as EN IEC 61076-2:2026 (availability noted for January 16, 2026) affects circular connector conformity pathways used in industrial automation and harsh-environment deployments. Separately, Ireland S.I. No. 110/2026, implementing EU delegated directives on lead exemptions, reflects ongoing RoHS-related re-evaluation pressure on solders, ceramics, and specific alloys used in electronic components, which can change long-term material selection and documentation for CE-marked products.
Value Chain Analysis
The cable connector value chain runs from upstream metals and polymers, including copper and copper alloys, precious-metal plating chemistries, and engineering plastics such as PBT/LCP, to precision tooling, molding, stamping, plating, and automated assembly. Downstream, testing and qualification feed into distribution through direct OEM supply and broadline distributors. For higher-performance segments, internal capability in precision mold tooling fabrication, high-speed plating capacity, and qualification testing cycles tends to drive throughput more than final assembly labor alone, especially for board-to-board SMT connectors where fine-pitch tolerances raise scrap and rework risk.
Downstream qualification and approved-vendor requirements in automotive, industrial, and aerospace can create long gating lead times, often described at 12 to 24 months. This increases switching costs and typically favors suppliers with established reliability labs and process control. Channel strategy remains split between high-mix distribution for industrial and maintenance demand and direct program supply for hyperscale data centers and vehicle platforms. In 2026, demand signaling from the distribution ecosystem highlighted tightness in connectors, with TTI reporting a March 2026 book-to-bill ratio of 1.28, underscoring the value of multi-tier sourcing, second-source qualification, and multi-region manufacturing footprints to reduce lead-time and trade or logistics disruptions.
Competitive Landscape
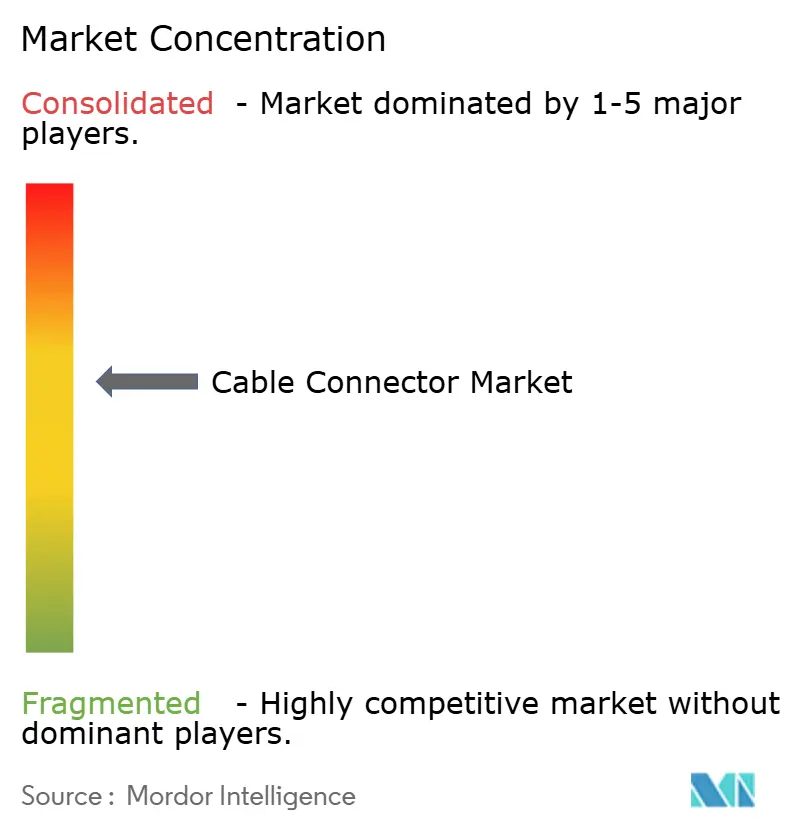
The cable connector market remains moderately fragmented because no single vendor serves every application across voltage, speed, and environmental categories. TE Connectivity, Amphenol, and Molex leverage global tooling networks, vertical integration, and thousands of active patents to defend design-win pipelines, yet their cumulative share still trails the 80% mark that would signal high concentration. Specialists such as Hirose or Samtec win sockets in ultra-fine-pitch and high-speed niches by coupling agile R&D with dedicated customer-engineering teams.
Competitive strategy tilts toward automation investment that trims labor cost volatility and improves first-pass yield in pitches below 0.4 mm. Leading firms deploy in-line X-ray inspection and closed-loop plating thickness control to hit zero-defect targets sought by automotive OEMs. Corporate acquisitions intensify; Amphenol’s 2025 buyout of Carlisle Interconnect widened its aerospace footprint and pulled harsh-environment know-how into its catalog.
Partnerships also surface as switch silicon, optics, and cooling architectures converge. Foxconn Interconnect Technology’s joint program with NVIDIA exemplifies GPU-specific power interconnect co-development that brings in cooling channels and sense pin logic. White-space opportunities remain in 1.6T optical connectors, 800 V EV interfaces, and hydrogen-ready power connectors, each demanding fresh material science and standards participation. Suppliers able to combine cross-disciplinary IP gather pricing and margin advantages that shelter them from commodity headwinds.
Cable Connector Industry Leaders
Amphenol Corporation
TE Connectivity Limited
Molex LLC
Aptiv PLC
Yazaki Corporation
- *Disclaimer: Major Players sorted in no particular order
Cable Connector Market Companies Covered in this Report
- TE Connectivity Ltd.
- Amphenol Corporation
- Molex LLC (Koch Industries)
- Aptiv PLC
- Yazaki Corporation
- Foxconn Interconnect Technology Ltd.
- Hirose Electric Co., Ltd.
- Japan Aviation Electronics Industry, Ltd.
- Rosenberger Hochfrequenztechnik GmbH & Co. KG
- Samtec, Inc.
- Luxshare Precision Industry Co., Ltd.
- J.S.T. Mfg. Co., Ltd.
- HARTING Technology Group
- Sumitomo Electric Industries, Ltd.
- Phoenix Contact GmbH & Co. KG
- Huber+Suhner AG
- Nexans S.A.
- Prysmian Group S.p.A.
- Fujitsu Limited
- Huawei Technologies Co., Ltd.

Market Opportunities and Future Outlook
Product roadmaps in the market are increasingly converging on signal integrity at very high data rates, thermal and power-density challenges, and ruggedization for harsh environments. This creates whitespace for suppliers that can co-design with platform owners early in the development cycle. Co-packaged architectures are a visible catalyst: Molex introduced Impress Co-Packaged Copper Solutions in February 2026, using a compression-based on-substrate approach aimed at 224 Gbps PAM-4 and beyond. TE Connectivity released 56G MezzaWave connectors and cable assemblies in June 2026, aligned to VITA 57.1/57.4 for high-speed embedded computing. Together, these launches support opportunities for connectors and cable assemblies positioned closer to ASICs, with higher lane speeds and improved EMI and mechanical stack-up performance.
Miniaturization and new end-market form factors also broaden needs in compact, high-reliability interconnects. I-PEX began mass production in March 2026 of CABLINE-UMF 0.4 mm pitch FPC connectors with shielding-focused features for high-data-rate transfer. Aptiv (Winchester Interconnect) launched the Modulus modular connector platform in March 2026 for LEO satellite and UAS programs incorporating Single Pair Ethernet. On the supply side, optical interconnect capacity programs support growth in fiber-adjacent connector content: Fujikura approved a policy in March 2026 to invest up to JPY 300 billion across Japan and the US to expand output capacity for optical fiber, connectors, and insulating materials for AI data centers, while Hakusan announced a JPY 5 billion second plant in June 2026 to produce ferrules. These actions point to opportunities for connector makers that combine advanced materials and shielding with scalable qualification, including AI data center interconnect, aerospace and defense density upgrades, and compact industrial and automotive architectures.
Recent Industry Developments in Cable Connector Market
- July 2026: Amphenol Industrial Operations expanded its APC Series circular connectors by adding new 18-10 insert arrangements for industrial, energy storage, and automation applications. The update broadens configuration coverage for ruggedized circular formats where field reliability and simplified integration support specification wins.
- February 2025: TE Connectivity announced a USD 150 million investment to expand high-voltage connector manufacturing in Mexico targeting 800 V EV systems. The investment supports regionalized supply for automotive electrification programs that require higher-current, sealed interconnects and long qualification cycles.
- December 2024: Molex unveiled a co-packaged optics connector platform rated for 51.2 Tbps switching. The launch aligned connector development with hyperscale bandwidth transitions, raising the bar for signal integrity and mechanical precision in near-ASIC interconnect solutions.


Cable Connector Market Report Scope and Research Methodology
Market Definition and Coverage
This market covers the revenues earned from cable connectors used to terminate, join, or interface cables so that power, signals, or data can move reliably between equipment, devices, and infrastructure across major end users.
Scope exclusions: We exclude raw cable and wire, bulk cabling assemblies sold as cable products, and installation labor that is billed as a service rather than sold as a connector product.
Segments Covered in This Report
- By Connector Type
- PCB Connectors
- Circular and Rectangular Connectors
- Fiber-Optic Connectors
- I/O and RF/Coaxial Connectors
- Power and High-Voltage EV Connectors
- By Mounting Configuration
- Board-to-Board
- Wire-to-Board
- Cable-to-Cable
- Panel/Feed-through
- By End-user Industry
- IT and Telecom
- Automotive and Transportation
- Consumer Electronics
- Industrial Automation
- Energy, Power and Sub-sea
- By Data-Rate Class
- Less than 10 Gbps Standard
- 10-25 Gbps High-Speed
- Greater than equal to 25 Gbps Ultra-High-Speed / PAM4
- By Material
- Copper-Alloy
- Aluminum and Lightweight Alloys
- Engineering Plastics and Composites
- Precious-Metal-Plated (Gold, Palladium)
- By Geography
- North America
- United States
- Canada
- Mexico
- South America
- Brazil
- Argentina
- Rest of South America
- Europe
- Germany
- United Kingdom
- France
- Italy
- Rest of Europe
- Asia-Pacific
- China
- Japan
- South Korea
- India
- Rest of Asia-Pacific
- Middle East
- Saudi Arabia
- United Arab Emirates
- Rest of Middle East
- Africa
- South Africa
- Rest of Africa
- North America
Data Sources, Market Sizing, and Validation
Desk Research
Desk research was used to build the basic demand map and to anchor the model to observable industry signals before any assumptions were made. We reviewed public materials such as USITC trade statistics, UN Comtrade, and national customs dashboards to understand import-export movement for relevant connector categories and to sense-check regional mix.
For fundamentals, we leaned on sources such as the US Census Bureau (electronics and manufacturing series), the Federal Communications Commission for network buildout indicators, International Energy Agency publications for electrification and grid investment context, and peer-reviewed IEEE papers for connector performance trends that influence replacement cycles and data-rate shifts. Company filings, investor presentations, product catalogs, and press releases were then used to validate which connector families and end uses were being emphasized, and how pricing tends to vary by specification. A paid subscription for company financials and intelligence, along with a patent database, were referenced to support the supply-side view and to check where R&D attention was increasing. These examples are not exhaustive, and many other public sources were also consulted for data collection, validation, and clarification.
Primary Interviews and Surveys
Primary work focused on validating scope, share splits, and the pricing logic that links connector specifications to revenues. We spoke with connector manufacturers, channel partners, and large buying organizations across IT and telecom, automotive, industrial equipment, and consumer electronics, then cross-checked input across APAC, EMEA, and the Americas to avoid over-stating regional demand drivers.
Distribution of primary research fieldwork respondents
| Company type | Respondent position | Region |
|---|---|---|
| Top tier: 28% | CXOs: 19% | APAC: 45% |
| Mid tier: 52% | Functional/Unit leaders: 34% | EMEA: 35% |
| Smaller Players: 20% | Managers: 47% | Americas: 20% |
Market-Sizing & Forecasting
Market sizing used a top-down build where electronics production, telecom and data center buildout indicators, and vehicle electrification signals are translated into a connector demand pool, which is then converted to value using typical connector content and price ranges. The totals were corroborated with selective bottom-up approximations, such as sampled ASP times volume for key connector families, distributor channel checks, and a roll-up of a limited set of supplier revenues to verify that the outcome stayed within realistic supply capacity.
Inputs that mattered most included the mix shift toward higher data-rate connectors (for example, 10-25 Gbps and ultra-high-speed classes), the split of mounting configurations (wire-to-board, board-to-board, cable-to-cable, and panel feed-through), and the pace of EV and charging infrastructure expansion that raises demand for power and high-voltage connectors. Replacement and maintenance cycles were also considered because harsh-environment and industrial connectors behave differently from consumer applications. For forecasting, scenario analysis was used around capex cycles in telecom and industrial automation, and the scenarios were then translated into an annual path using exponential smoothing on the more stable end-use series. Where bottom-up detail was missing in smaller countries, regional intensity factors from trade flows and manufacturing output were applied, and then re-checked through interviews.
Data Validation & Update Cycle
Outputs were checked against independent signals such as connector shipment direction implied by trade movement, end-market production trends, and visible changes in high-speed and high-voltage adoption. When a region or end-use showed a sharp step change, we revisited the assumptions, re-checked currency timing, and re-contacted select respondents to confirm whether the change was real or a data artifact.
Before sign-off, the model and key splits go through more than one analyst review so that calculation errors and inconsistent definitions are caught early. The report is refreshed annually, and interim updates are made when material events occur, such as major policy shifts, supply disruptions, or large demand surprises in telecom or EV buildout. Right before delivery, a final pass is completed to ensure the latest public indicators are reflected in the final numbers.
Mordor Intelligence's Cable Connector Market Estimate Compared With Other Published Estimates
Published numbers for cable connectors often vary because researchers do not always count the same connector families, end uses, and years, and that changes the revenue pool quickly. Differences also show up when one study leans more on shipment proxies, while another assumes a faster ASP ramp for high-speed and high-voltage products.
The main gap comes from whether the sizing includes only connector products or also pulls in adjacent cable and harness revenue, which can inflate totals when the end market is discussed broadly. Some estimates also use an older base year and then project forward with a single CAGR, while others apply aggressive adoption assumptions for ultra-high-speed data connectors and EV charging hardware without enough cross-checks. In our approach, Mordor Intelligence separates connector revenues by mounting configuration and data-rate class so that growth is tied to observable buildout signals rather than a broad electronics growth proxy.
Benchmark comparison
| Source | Market Size | Gaps in Research Methodology |
|---|---|---|
| Mordor Intelligence | USD 118.28 B (2026) | |
| Industry Research Desk A | USD 89.40 B (2024) | Uses an earlier base year and appears to apply a wider macro demand narrative, which can understate the 2026 value if high-speed and EV-related connector mix shifts are not fully carried through into ASP and content assumptions. |
| Industry Research Desk B | USD 91.24 B (2023) | Starts from a 2023 base and extends a long forecast window, and the stated value can differ if connector scope is blended with broader interconnect narratives or if currency timing and end-use weighting are not updated to the current cycle. |
Looking at the spread, the differences are largely explained by base-year choice and by how tightly connector-only revenues are separated from adjacent cable-related spending. By keeping assumptions linked to clear indicators like data-rate mix, EV power connector penetration, and end-market production, the final total stays traceable and can be re-checked as new public signals appear.


Key Questions Answered in the Report
How large is the cable connector market in 2026?
The cable connector market size stands at USD 118.28 billion in 2026 with a 7.21% CAGR outlook to 2031.
Which connector type grows fastest through 2031?
Power and high-voltage EV connectors record the quickest advance at an 8.52% CAGR as electric-vehicle adoption scales.
Why is Asia-Pacific dominant in cable connector output?
The region concentrates electronics and EV manufacturing and captures 42.05% market share, supported by integrated supply chains and 5G deployment momentum.
What is driving ultra-high-speed connector demand?
AI and machine-learning servers plus 800G network upgrades lift ?25 Gbps connector volumes at an 8.25% CAGR.
How do copper price swings impact connector suppliers?
Copper and gold volatility can shave up to 0.8 percentage points off forecast CAGR as material costs reach 25% of assembly expenses.
Which companies lead current market innovation?
TE Connectivity, Amphenol, Molex, Hirose, and Samtec steer technology through investments in high-voltage EV lines, co-packaged optics, and 224 G signal-integrity designs.
Page last updated on:


 Your data is secure and never sold or shared.


