IT Connector Market Size and Share
Market Overview
| Study Period | 2020 - 2031 |
|---|---|
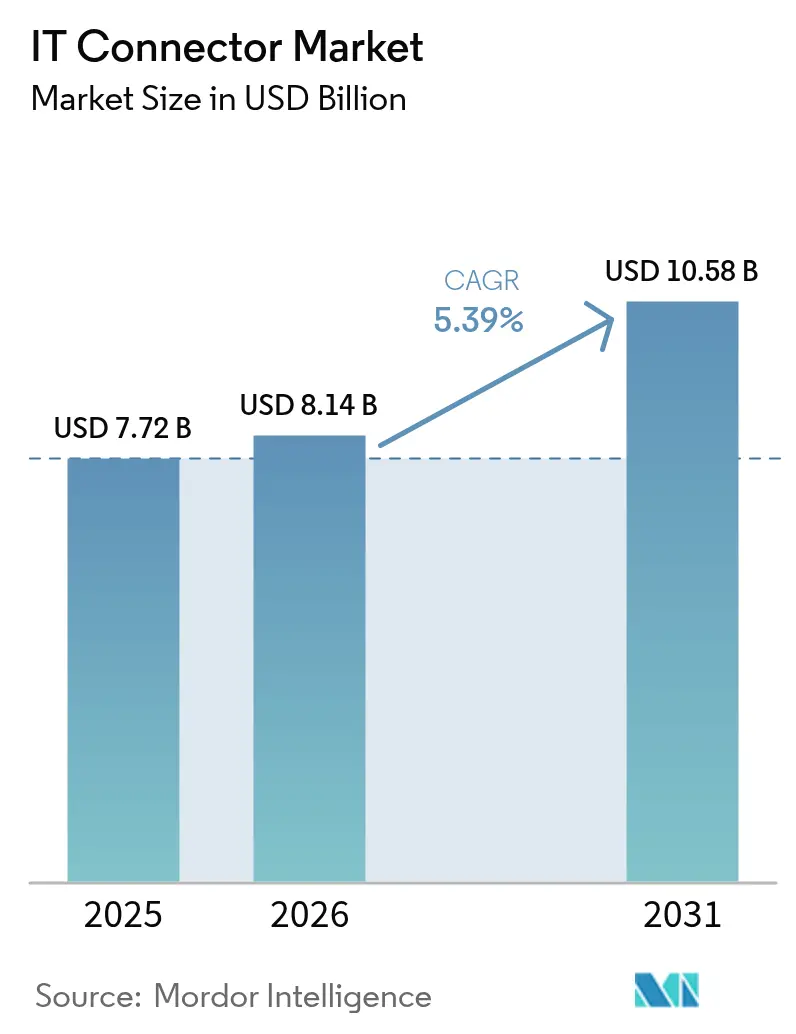
| Market Size (2026) | USD 8.14 Billion |
| Market Size (2031) | USD 10.58 Billion |
| Growth Rate (2026 - 2031) | 5.39% CAGR |
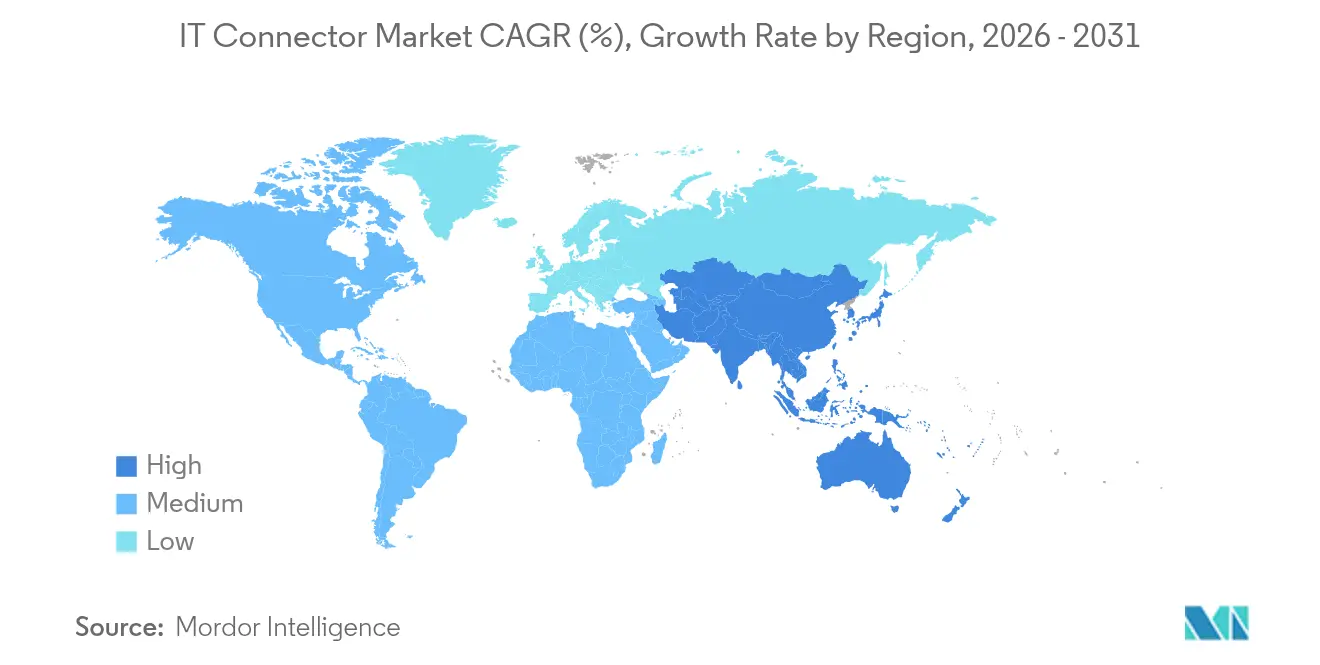
| Fastest Growing Market | Asia Pacific |
| Largest Market | Middle East and Africa |
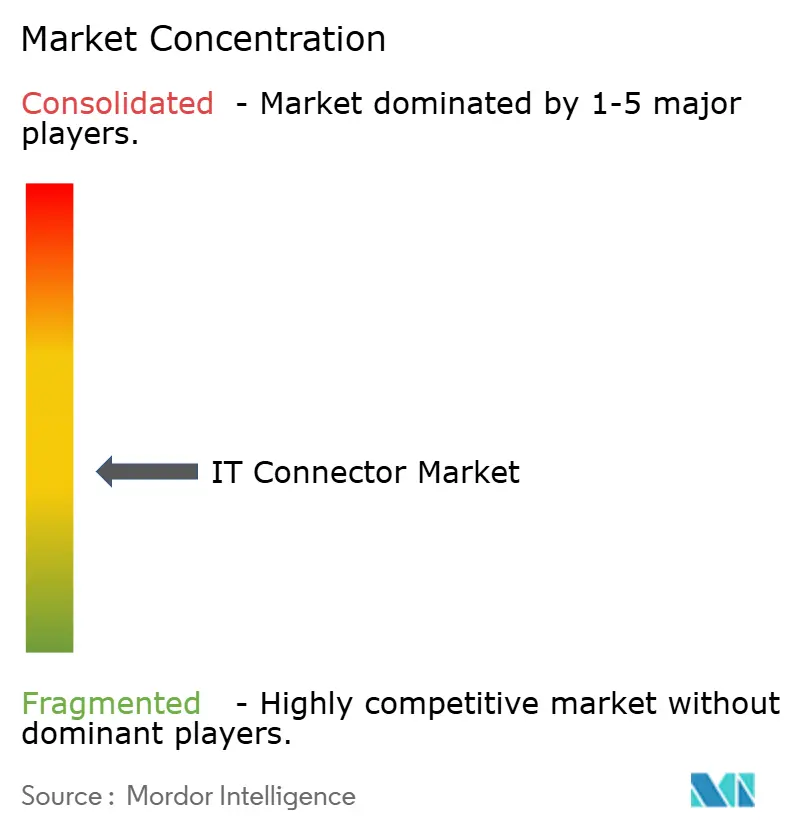
| Market Concentration | Medium |
Major Players *Disclaimer: Major Players sorted in no particular order Image © Mordor Intelligence. Reuse requires attribution under CC BY 4.0. | |
IT Connector Market Analysis by Mordor Intelligence
IT connector market size in 2026 is estimated at USD 8.14 billion, growing from 2025 value of USD 7.72 billion with 2031 projections showing USD 10.58 billion, growing at 5.39% CAGR over 2026-2031. Growth stems from the urgent need to move data at 224 Gbps-per-lane and beyond inside hyperscale data centers, the region-wide acceleration of 5G / 6G deployments, and the automotive transition to zonal EE architectures in electric vehicles. Co-packaged optics, more efficient RF and VSFF designs, and the availability of on-shore semiconductor capacity funded by the U.S. CHIPS Act round out the demand drivers. At the same time, connector suppliers are working through thermal-mechanical limits above 112 Gbps PAM4 and margin pressure created by a volatile copper price environment.
Key Report Takeaways
- By connector type, PCB connectors led with 44.60% of the IT connector market share in 2025; IO/High-Speed Backplane and Pluggable is projected to expand at a 5.55% CAGR through 2031.
- By mounting configuration, board-to-board held 35.40% revenue share in 2025, whereas wire-to-board is advancing at 6.05% CAGR to 2031.
- By data-rate class, ≤10 Gbps commanded a 47.20% share of the IT connector market size in 2025; ≥56 Gbps PAM4 is rising at a 6.85% CAGR over the forecast period.
- By end-user industry, IT and telecom accounted for 37.40% share in 2025, while automotive and e-mobility is the fastest-growing segment at 3.25% CAGR through 2031.
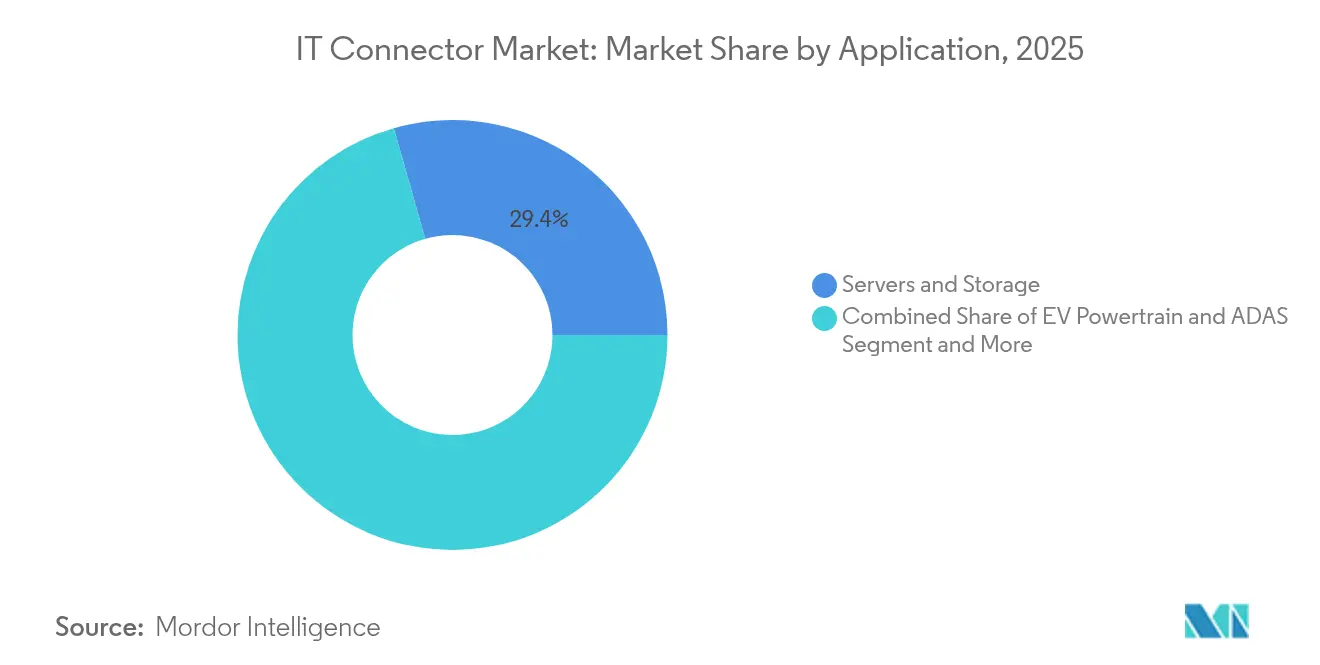
- By application, servers and storage occupied 29.40% of the IT connector market revenue in 2025. the 5G/6G base-station segment will compound 6.32% annually through 2031 as operators compress.
- By material, halogen-free compounds gain tractionStandard thermoplastics still capture 77.60% share thanks to established molding cycles and cost advantages. Yet low-halogen or halogen-free resins will rise 5.64% CAGR as REACH and RoHS tighten limits on halogens and brominated flame retardants.
- By geography, Asia Pacific captured 45.50% of the IT connector market share in 2025; the Middle East and Africa market is forecast to widen at 5.92% CAGR to 2031.
Note: Market size and forecast figures in this report are generated using Mordor Intelligence’s proprietary estimation framework, updated with the latest available data and insights as of 2026.
Global IT Connector Market Trends and Insights
Drivers Impact Analysis*
| Driver | (~) % Impact on CAGR Forecast | Geographic Relevance | Impact Timeline |
|---|---|---|---|
| Surging Demand for High-Speed (>25 Gbps) Interconnects in Hyperscale Data Centers | 1.2% | Global, with concentration in North America & Asia Pacific | Medium term (2-4 years) |
| Rapid 5G/6G Network Roll-outs Elevating RF & VSFF Connector Adoption in Asia | 0.9% | Asia Pacific, with spillover to North America | Short term (≤ 2 years) |
| Automotive Zonal EE Architectures Boosting High-Speed Board-to-Board Connectors in EVs | 0.7% | Global, with concentration in Europe & Asia Pacific | Medium term (2-4 years) |
| Growth of Co-Packaged Optics Accelerating IO Connector Innovation | 0.8% | North America & Asia Pacific | Long term (≥ 4 years) |
| Edge-AI & Industrial IoT Driving Rugged, Sealed Connectors in Factory Automation (EU Focus) | 0.6% | Europe, with spillover to North America | Medium term (2-4 years) |
| U.S. CHIPS Act–Backed On-Shore PCB Production Lifts Domestic Connector Demand | 0.5% | North America | Medium term (2-4 years) |
| Source: Mordor Intelligence | |||
Surging demand for high-speed interconnects in hyperscale data centers
Bandwidth-hungry AI clusters are transitioning beyond 224 Gbps per lane, forcing connector designers to mitigate insertion loss and thermal rise inside cramped server trays. Molex cites rapid uptake of optical transceivers for 224 Gbps PAM4 links, noting that heat removal is now as critical as signal integrity. Activities range from evaluating PAM-6 / PAM-8 modulation to deploying co-packaged copper and optics that shorten electrical channels. Hyperscalers plan to bring 120-130 new sites online every year, compressing build schedules to six weeks and favoring high-density connector systems that can be kitted and assembled rapidly.
Rapid 5G / 6G network roll-outs elevating RF connector adoption
Spectrum auctions in markets such as Vietnam for the 2.6 GHz and 3.5 GHz bands are fueling mid-band macro and small-cell deployments. Massive-MIMO radios are scaling from 4T4R to 32T32R, spurring the shift to compact VSFF interfaces that compress fiber counts. Connector vendors are responding with SN-class footprints that quadruple port density inside front-haul shelves, while carrier-neutral host operators expand distributed antenna systems valued at USD 8.7 billion by 2028.[1]5G Americas, “Neutral Host Opportunities for 5G & Beyond,” 5gamericas.org
Automotive zonal EE architectures boosting high-speed connectors
Redesigning vehicle wiring into zonal domains can reduce harness weight by up to 40%, raising demand for multi-lane board-to-board connectors able to shuttle high-speed data between zone controllers and central compute modules. Molex’s MX-DaSH consolidates signal, power, and data, simplifying line-side routing. The electrified powertrain introduces high-current nodes that push the global high-voltage connector market toward USD 15 billion by 2033 at 6.5% CAGR. These dynamics make zonal EV platforms the fastest-growing design win category for the IT connector market.
Growth of co-packaged optics accelerating IO connector innovation
Integrating optical engines with ASICs eliminates retimer stages, lowering power by 30% and shrinking link budgets. The Optical Internetworking Forum unveiled a high-density connector project in Q1 2025 to formalize mechanical envelopes for co-packaged solutions. Ultra-low-loss fibers and blind-mate optical ferrules are being co-developed, creating new addressable revenue for connector companies skilled in opto-electronic alignment.
Restraints Impact Analysis*
| Restraint | (~) % Impact on CAGR Forecast | Geographic Relevance | Impact Timeline |
|---|---|---|---|
| Copper and Rare-Metal Price Volatility Raising BOM Costs | -0.7% | Global | Short term (≤ 2 years) |
| Thermal-Mechanical Reliability Limits at ≥112 Gbps PAM4 | -0.5% | Global, with concentration in North America | Medium term (2-4 years) |
| Lengthy Automotive PPAP Cycles Slowing Connector Design-ins | -0.3% | Global | Medium term (2-4 years) |
| Regulatory Push for Halogen-Free Plastics Increasing Re-qualification Costs (EU) | -0.4% | Europe, with spillover to global supply chains | Medium term (2-4 years) |
| Source: Mordor Intelligence | |||
Copper and rare-metal price volatility raising BOM costs
Surging copper and palladium prices have triggered multiple component price notices, such as Panasonic’s January 2025 flex PCB increase.[2]Panasonic, “Electronic Materials News,” industrial.panasonic.com High-speed connectors use thick copper alloys and precious-metal platings, so even a 5% upswing can erode gross margins. Vendors are locking annual supply contracts, qualifying alternative platings, and redesigning contact beams to lower mass without compromising insertion cycles.
Thermal-mechanical reliability limits at high data rates
Exceeding 112 Gbps PAM4 stresses solder joints, lead frames, and housing plastics. Indium Corporation points to electromigration, tin whisker growth, and CTE mismatch as root causes of early field returns. Low-temperature solders and reinforced LCP housings offer partial mitigation, yet accelerated qualification now dominates the engineering roadmap for data-center interconnects.
*Our forecasts treat driver/restraint impacts as directional, not additive. The impact forecasts reflect baseline growth, mix effects, and variable interactions.
Segment Analysis
By Connector Type: IO/high-speed backplane outpacing legacy links
PCB connectors accounted for 44.60% of the IT connector market size in 2025, reflecting their ubiquity across motherboards, storage planes, and industrial controllers. Robust pin integrity, proven mating cycles, and broad component ecosystems keep this category entrenched in volume applications. The segment still benefits from the CHIPS Act-driven reshoring of PCB assembly, which lifts domestic demand for fine-pitch mezzanine formats.
The IO/high-speed backplane-and-pluggable group is forecast to grow at 5.55% CAGR, propelled by data center upgrades to QSFP-DD 800 and OSFP Xtreme cages capable of 112 Gbps per channel. RF/VSFF connectors benefit from 5G small-cell densification, while circular and rectangular housings remain essential for harsh-duty industrial controls. Microminiature options are seeing new use cases in robotic surgery and CubeSats that reward every millimeter saved.


By Mounting Configuration: wire-to-board gaining momentum
Board-to-board held a 35.40% share in 2025 and remains the workhorse for modular sub-assemblies. Stacked mezzanine and card-edge variants help OEMs meet tight Z-height restrictions inside laptops and switch blades. However, wire-to-board is advancing at 6.05% CAGR as designers favor harnesses that simplify maintenance in EV battery packs and household appliances.
Wire-to-wire assemblies continue to service motor drives and HVAC compressors where board real estate is limited. The miniaturization trend now extends across all mounting styles; Molex’s rugged miniaturized series offers 20-55% footprint reduction while retaining IP67 sealing, directly addressing robotics and outdoor telecom enclosures.
By Data-Rate Class: PAM4 technologies reshape the high-end
The ≤10 Gbps category held a dominant 47.20% share of the IT connector market size during 2025 because many industrial sensors, infotainment head units, and embedded PCs do not need bleeding-edge bandwidth. The cost-performance sweet spot of these connectors keeps them popular when link budgets favor longer cable runs or multiple drops.
The ≥56 Gbps PAM4 bracket will climb 6.85% CAGR to 2031 as AI inference, NVMe-oF storage fabrics, and disaggregated memory pools migrate to 224 Gbps lanes. OIF’s high-density proposal signals ecosystem alignment around thicker copper-sheet cages and low-skew pair routing that support upgrade paths beyond 800 Gbps per port.

By End-user Industry: automotive and e-mobility accelerating
IT & telecom retained 37.40% revenue in 2025, driven by cloud service expansions and continuous campus-backbone refurbishment. Hyperscalers’ preference for ODM hardware translates into high-volume demand for cage, mezzanine, and PAM4 twin-ax assemblies.
Automotive and e-mobility, though smaller, is set to grow 3.25% CAGR. SAE-level 2+ autonomy requires high-speed links between cameras, radar, and centralized ADAS processors, complementing the EV push for high-current battery connectors. Industrial automation and medical devices are also raising their share as edge AI uses rugged IP-rated housings that preserve signal integrity despite vibration and chemical exposure.
By Application: 5G/6G base-stations spearhead growth trajectory
Servers and storage occupied 29.40% of the IT connector market revenue in 2025. Tier-three colocation facilities, regional edge nodes, and AI super-clusters all rely on high-speed cages and orthogonal backplanes to balance cost with upgradability.
The 5G/6G base-station segment will compound 6.32% annually through 2031 as operators compress radio footprints and increase antenna counts. SN and MDC duplex fiber connectors, plus IPx coax links, are winning in remote radio heads tailored for mid-band coverage. EV powertrain / ADAS and factory robots follow closely, with collaborative robot arms debuting built-in connector modularity for hot-swap servo drive.
By Material: halogen-free compounds gain traction
Standard thermoplastics still capture 77.60% share thanks to established molding cycles and cost advantages. Yet low-halogen or halogen-free resins will rise 5.64% CAGR as REACH and RoHS tighten limits on halogens and brominated flame retardants. TE Connectivity and BizLink have each confirmed active conversion programs for eco-friendly jacketing.
Suppliers that expedite material qualification, including UL 94 V-0 approvals, position themselves for design-in wins on EU automotive platforms and consumer wearables that market sustainability credentials.
Geography Analysis
Asia Pacific dominated with 45.50% market revenue in 2025, led by China’s vertically integrated electronics base and India’s fast-growing telecom backbone. Mainland connector producers benefit from provincial incentives aimed at reliability upgrades, with the domestic connector sector forecast to add RMB 12.6 billion year-on-year during 2024. Japan and South Korea contribute through the early adoption of co-packaged optics inside advanced foundry lines.
North America ranks second. The CHIPS and Science Act has already channeled USD 6.6 billion to TSMC Arizona and USD 8.5 billion to Intel, underpinning a localized ecosystem for advanced substrates and connector cages compliant with 224 Gbps PAM4 thermal requirements. Aerospace and defense programs also pull through rugged circular MIL-spec variants that command premium margins.
Europe plays to its strengths in automotive, Industry 4.0, and medical. The push for halogen-free plastics has turned many OEMs into early adopters of eco-class housings. Meanwhile, the Middle East and Africa is set for 5.92% CAGR as hyperscalers install regional cloud zones and governments award smart-city fiber concessions, particularly in Saudi Arabia and the UAE. South America shows steady but lower expansion, weighted toward Brazilian telecom and Argentine industrial automation projects.

Competitive Landscape
TE Connectivity, Amphenol, and Molex anchor the leadership tier. TE Connectivity derived USD 5.7 billion from the Americas, USD 4.8 billion from EMEA, and USD 5.8 billion from APAC in FY 2024, reflecting a balanced geographic footprint.[4]TE Connectivity, “TE Connectivity 2024 Annual Report,” te.com Amphenol’s 27% stock gain in the past 12 months builds on acquisitions such as CommScope’s Outdoor Wireless Networks, which is expected to add USD 1.3 billion to 2025 sales.
Mid-tier firms are differentiating through domain focus: ZJK Industrial introduced liquid-cooled quick couplings for GPU servers at COMPUTEX 2025. Niche medical specialists such as Sumitomo Electric Lightwave earned 4.5/5 in the 2025 Lightwave+BTR Innovation Reviews for field-splicable optical connectors.
Competitive intensity is rising around system-level know-how. Customers increasingly request full-stack solutions: firmware, thermal models, and compliance test plans bundled with the physical connector. This service overlay rewards companies with cross-disciplinary engineering teams and advanced simulation toolchains. Smaller entrants concentrate on ultraminiature or eco-friendly niches, positioning themselves as acquisition targets for strategics looking to plug technology gaps.
IT Connector Industry Leaders
3M Company
Molex Inc. (Koch)
TE Connectivity Limited
Amphenol Corporation
Samtec Inc.
- *Disclaimer: Major Players sorted in no particular order

Recent Industry Developments
- May 2025: Amphenol showcased ExaMAX and OverPass interconnects for 56 G-224 G PAM4 AI servers at COMPUTEX TAIPEI 2025.
- May 2025: ZJK Industrial unveiled liquid-cooled quick connectors compatible with NVIDIA MGX platforms.
- April 2025: Sumitomo Electric Lightwave’s Lynx-CustomFit splice-on connectors scored 4.5 in the 2025 Lightwave+BTR Innovation Reviews.
- April 2025: IBASE Technology launched the EC3100 rugged edge-AI system powered by NVIDIA Orin modules for industrial AIoT.


Research Methodology Framework and Report Scope
Market Definitions and Key Coverage
Our study defines the IT connector market as all newly manufactured electro-mechanical interfaces that route data, signal, or low-to-mid-voltage power within servers, storage, switches, base-stations, and related IT infrastructure. Board-to-board, wire-to-board, high-speed I/O, RF, and micro-connectors are included under this scope, so long as they are destined for information-technology equipment rather than broad industrial use. According to Mordor Intelligence, the market was valued at USD 7.72 billion in 2025 and is forecast to reach about USD 10.07 billion by 2030.
Scope exclusion: cable assemblies, passive copper or optical cords longer than one meter, and automotive or appliance connectors lie outside our numbers.
Segmentation Overview
- By Connector Type
- PCB Connectors
- IDC Connectors
- IO/High-Speed Backplane and Pluggable
- Circular and Rectangular
- RF/VSFF (SN, CS, MMC)
- Microminiature/Nano Connectors
- By Mounting Configuration
- Board-to-Board
- Wire-to-Board
- Wire-to-Wire/Cable Assemblies
- By Data-Rate Class
- ≤10 Gbps
- 10-25 Gbps
- 25-56 Gbps
- ≥56 Gbps/PAM4 112 G
- By End-user Industry
- IT and Telecom (incl. Data Centers)
- Consumer Electronics and Computing
- Automotive and e-Mobility
- Industrial Automation/IIoT
- Healthcare and Medical Devices
- By Application
- Servers and Storage
- 5G/6G Base-Stations
- EV Powertrain and ADAS
- Factory Robotics and PLCs
- By Material
- Standard Thermoplastics
- Halogen-free/Eco-friendly Compounds
- Geography
- North America
- United States
- Canada
- Mexico
- Europe
- Germany
- United Kingdom
- France
- Italy
- Spain
- Russia
- Rest of Europe
- Asia-Pacific
- China
- Japan
- South Korea
- India
- ASEAN
- Rest of Asia-Pacific
- South America
- Brazil
- Argentina
- Rest of South America
- Middle East and Africa
- Saudi Arabia
- United Arab Emirates
- Turkey
- South Africa
- Rest of Middle East and Africa
- North America
Detailed Research Methodology and Data Validation
Primary Research
Mordor analysts interview connector product managers, EMS procurement heads, and data-center architects across North America, Europe, and Asia-Pacific. These discussions refine penetration assumptions for emerging 56 Gbps PAM4 interfaces, typical board counts per rack, and region-specific price curves, which are then cross-checked through short online surveys with distribution partners.
Desk Research
We first map the size of the installed IT hardware base using open datasets from bodies such as the International Trade Center, Eurostat Comext, the U.S. International Trade Commission, and China Customs, which report connector-relevant HS codes. Industry-specific insights are gathered from associations like the Optical Internetworking Forum and the IEEE 802.3 working group, while company filings, 10-Ks, and investor presentations provide shipment mixes and average selling prices. Select paid resources, D&B Hoovers for supplier revenue splits and Dow Jones Factiva for real-time deal tracking, strengthen revenue attribution across geographies. This list is illustrative; many additional secondary sources are referenced during validation.
Market-Sizing & Forecasting
A top-down build begins with global production and trade statistics for connector HS codes, reconstructed to the IT-only slice through end-use ratios supplied by interviewees. Select bottom-up checks, sampled supplier revenues and rack-level connector counts multiplied by blended ASPs, help us align totals. Key model drivers include hyperscale data-center rack additions, 5G macro-site roll-outs, average port speeds, ASP erosion rates, and quarterly PCB output in Asia. Forecasts rely on multivariate regression combined with scenario analysis; variables with low historical stability receive wider bands that are narrowed after expert review. Gap areas in the bottom-up roll-up are filled using weighted regional averages.
Data Validation & Update Cycle
Outputs face three-step analyst review, anomaly screening against lead-indicator series, and senior sign-off. Models refresh annually; material events such as sudden hyperscale capex revisions trigger interim updates before clients receive the report.
Why Mordor's IT Connector Baseline Commands Reliability
Published estimates often diverge because firms pick different device sets, price points, and refresh cadences before applying currency conversions.
Key gap drivers include whether consumer and industrial connectors are folded into totals, how aggressively ASP compression is modeled, and how frequently primary inputs are refreshed. Mordor's definition locks in an IT-only scope, applies quarterly price tracking, and is rebuilt every twelve months, whereas other publishers aggregate the entire connector universe or roll forward older base years.
Benchmark comparison
| Market Size | Anonymized source | Primary gap driver |
|---|---|---|
| USD 7.72 B (2025) | Mordor Intelligence | - |
| USD 104.12 B (2025) | Global Consultancy A | Includes automotive, consumer, and industrial connectors; relies mainly on five-year-old trade data |
| USD 91.31 B (2025) | Industry Journal B | Uses blended global ASPs without isolating IT grades; refresh cadence biennial |
In sum, by limiting scope to true IT applications, refreshing inputs each year, and grounding forecasts in live price-volume dialogues, Mordor Intelligence delivers a balanced, transparent baseline that decision-makers can reproduce and trust.


Key Questions Answered in the Report
What is the current size of the IT connector market?
The IT connector market stands at USD 8.14 billion in 2026 and is projected to reach USD 10.58 billion by 2031.
Which region commands the largest demand for IT connectors?
Asia Pacific leads with 45.50% market revenue, supported by expansive electronics manufacturing and rapid 5G roll-outs.
Which connector type is growing the fastest?
IO / high-speed backplane and pluggable connectors are forecast to grow at a 5.55% CAGR through 2031, buoyed by hyperscale data-center bandwidth upgrades.
How will 5G and 6G deployments affect connector demand?
Expanded mid-band spectrum use and massive-MIMO radio installations are lifting demand for RF and VSFF interfaces that pack higher density into base-station and fronthaul gear.
Why are automakers shifting toward zonal EE architectures?
Zonal layouts cut wiring weight, lower material cost, and support centralized compute, thereby increasing the need for multi-lane board-to-board connectors able to carry high-speed data and power inside electric vehicles.
What environmental regulations are influencing material choices?
EU RoHS and REACH directives are pushing connector makers toward halogen-free compounds, a material class projected to advance at a 5.64% CAGR between 2026 and 2031.
Page last updated on:


