
ESG Analytics and Benchmarking Platform Market Size and Share
Market Overview
| Study Period | 2020 - 2031 |
|---|---|
| Market Size (2026) | USD 4.80 Billion |
| Market Size (2031) | USD 10.51 Billion |
| Growth Rate (2026 - 2031) | 16.97 % |
| Fastest Growing Market | Asia-Pacific |
| Largest Market | Europe |
| Market Concentration | Low |
Major Players *Disclaimer: Major Players sorted in no particular order Image © Mordor Intelligence. Reuse requires attribution under CC BY 4.0. | |
ESG Analytics and Benchmarking Platform Market Analysis by Mordor Intelligence
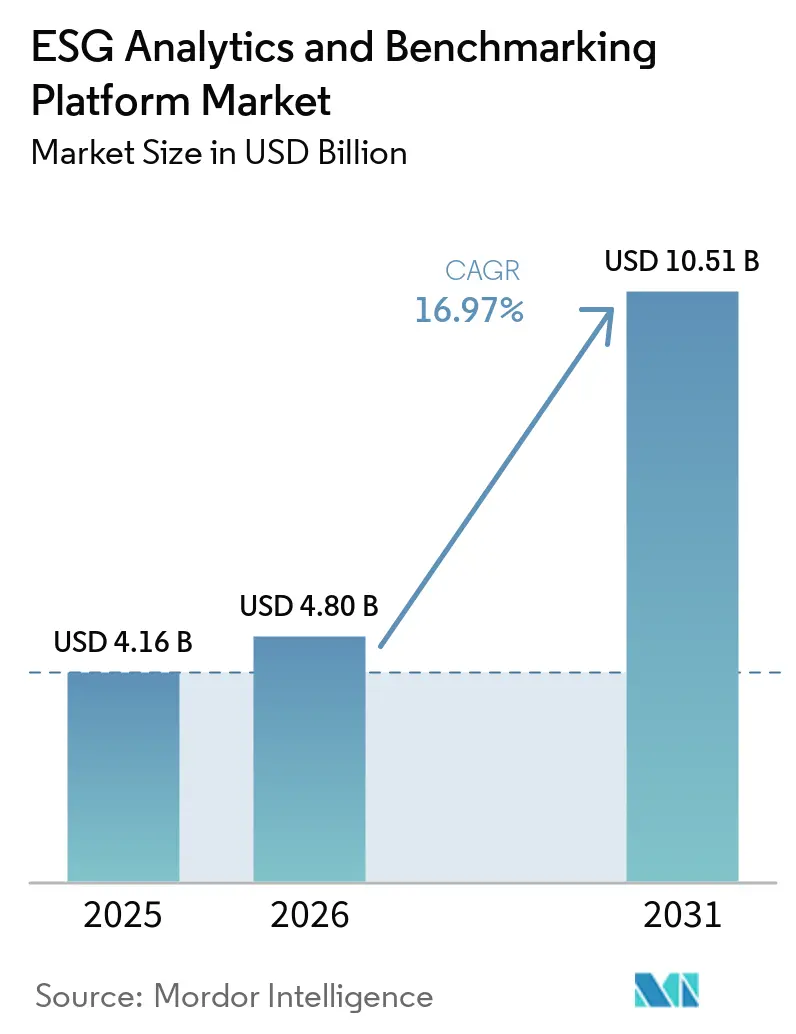
The ESG analytics and benchmarking platform market size is projected to be USD 4.16 billion in 2025, USD 4.80 billion in 2026, and reach USD 10.51 billion by 2031, growing at a CAGR of 16.97% from 2026 to 2031. Growth is being shaped by a clear shift from voluntary sustainability reporting to reporting that needs audit support, system control, and repeatable data workflows. AI-based normalization is also becoming more important because companies need to reconcile fragmented data across subsidiaries, suppliers, and reporting frameworks without rebuilding entire systems. Investor expectations are moving in the same direction, with greater demand for benchmark-comparable raw data rather than only top-level ESG scores. Supply-chain screening is adding another layer of demand, as large enterprises extend sustainability data requirements to suppliers that were not previously active buyers of these tools. Even with persistent data quality gaps and methodological differences, the ESG analytics and benchmarking platform market is moving from discretionary software spending to an embedded operating requirement.
Key Report Takeaways
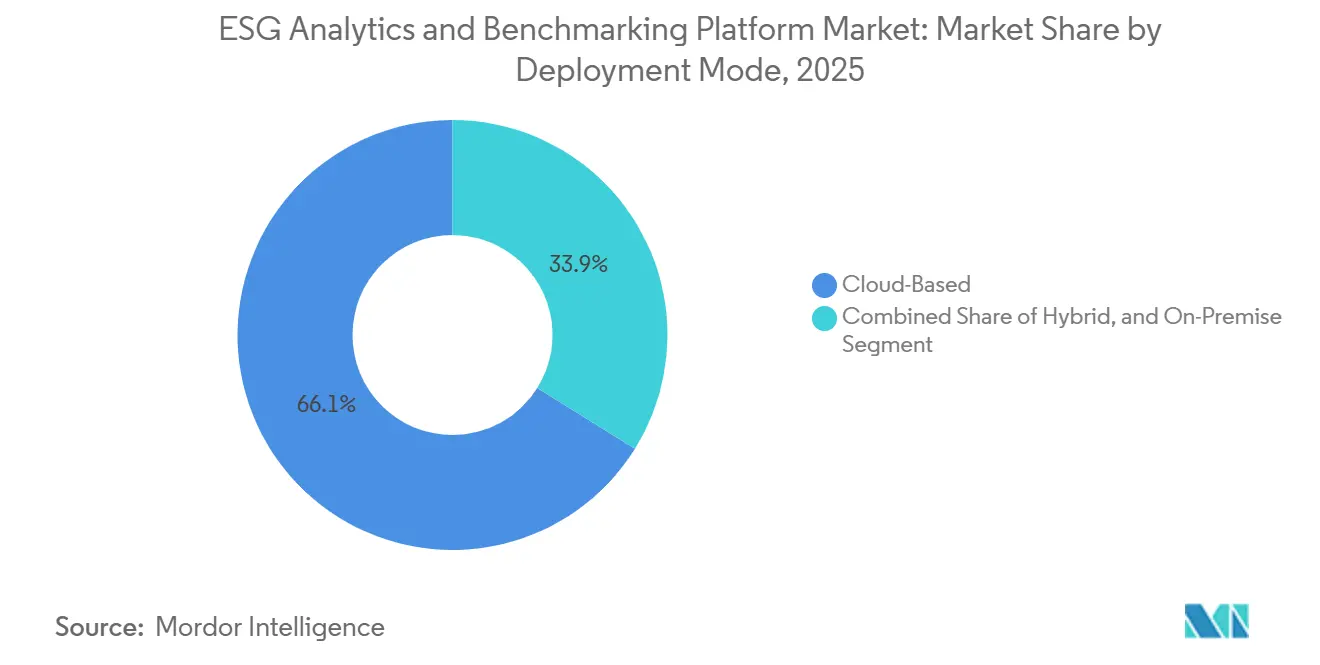
- By deployment mode, cloud-based deployment accounted for 66.12% of the ESG analytics and benchmarking platform market share in 2025, while hybrid deployment is projected to expand at a 17.25% CAGR through 2031.
- By offering, software platforms accounted for 69.45% of the ESG analytics and benchmarking platform market in 2025, while services are expected to grow at a 17.05% CAGR through 2031.
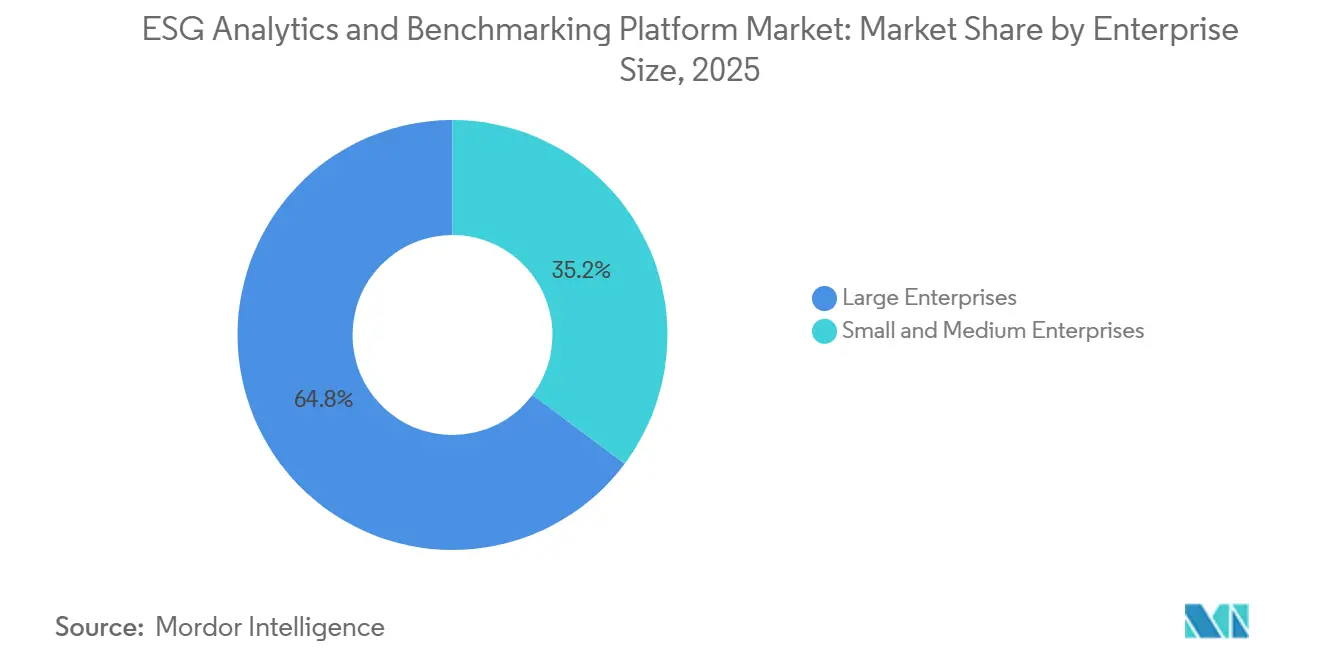
- By enterprise size, large enterprises accounted for 64.78% in 2025, while small and medium enterprises are projected to record the highest CAGR of 17.12% through 2031.
- By end-use industry, BFSI led with 27.41% share in 2025, while retail and e-commerce is projected to expand at 17.34% CAGR through 2031.
- By geography, Europe commanded 34.56% share in 2025, while Asia-Pacific is projected to grow at 17.45% CAGR through 2031.
Note: Market size and forecast figures in this report are generated using Mordor Intelligence’s proprietary estimation framework, updated with the latest available data and insights as of January 2026.
Market Trends and Insights
Drivers Impact Analysis of ESG Analytics and Benchmarking Platform Market*
| Driver | (~) % Impact on CAGR Forecast | Geographic Relevance | Impact Timeline |
|---|---|---|---|
| Rising Demand for Auditable ESG Disclosures | +4.5% | Global, with stronger near-term relevance in Europe and the UK | Short term (≤ 2 years) |
| AI-Enabled Normalization of Fragmented ESG Data | +3.8% | Global, with earlier traction in North America and Europe | Short term (≤ 2 years) |
| Investor Pressure for Comparable ESG Scores | +3.0% | Global, with stronger relevance in EMEA and North America | Medium term (2-4 years) |
| Procurement-Led Supplier ESG Screening | +2.1% | Global, with spillover into Asia-Pacific and South America | Medium term (2-4 years) |
| Double Materiality Adoption in Reporting Workflows | +1.8% | Europe, with spillover into Asia-Pacific and the Middle East | Medium term (2-4 years) |
| Integration With Enterprise Risk and Finance Systems | +1.5% | Global | Long term (≥ 4 years) |
| Source: Mordor Intelligence | |||
Rising Demand for Auditable ESG Disclosures
Mandatory reporting is changing ESG software from a disclosure support tool into an operating system for controlled reporting. Companies now need workflows that can support recurring filing cycles, internal review, and external assurance without relying on manual spreadsheet consolidation. That shift is important for the ESG analytics and benchmarking platform market because regulatory pressure now affects not only direct reporters but also multinational groups and supplier networks tied to in-scope entities. The resulting demand is strongest where reporting rules are more mature, but the same buying logic is spreading across global operations that want a single, governed data layer rather than local workarounds. This is also raising the value of platforms that can handle dual materiality, version control, and framework mapping in a single environment. As disclosure moves closer to financial reporting, the buying conversation is shifting from optional ESG tooling to an auditable data infrastructure.
AI-Enabled Normalization of Fragmented ESG Data
AI is becoming most useful where companies need to clean, structure, and reconcile inconsistent sustainability data across systems and entities. In the ESG analytics and benchmarking platform market, that matters because fragmented inputs still limit benchmark quality, especially when enterprises need cross-border or multi-business-unit comparisons. IBM expanded this normalization layer in 2026 through Envizi product updates that supported emissions calculations in Excel and new framework configurations tied to revised reporting needs. Those moves show how vendors are trying to reduce the operational burden of updates while keeping ESG calculations closer to core business workflows. They also show why AI and embedded calculation tools are pushing competition away from simple data capture and toward interpretation, benchmarking, and scenario support. As these capabilities mature, the time and cost required to improve Scope 3 coverage are declining.[1]
Investor Pressure for Comparable ESG Scores
Institutional investors are showing less willingness to rely on black-box ratings alone and are spending more on direct data analysis. A 2025 survey found that 48% of institutional investors were building their own benchmarks or in-house ESG scores, and 54% were simultaneously comparing multiple sustainability data sources. The same survey also showed that 87% of respondents maintained their ESG objectives in 2025, while 48% planned to increase their ESG data acquisition and analysis budgets. That is important for the ESG analytics and benchmarking platform market because it rewards vendors that can provide attributable raw data, configurable benchmarks, and transparent methodology records. PRI reporting participation also remained strong in 2025, with more than 4,000 asset owners and institutional investors in the reporting cohort. The commercial effect is that platforms with stronger audit trails and greater flexibility in benchmark design are attracting more attention from sophisticated buy-side users.[2]
Procurement-Led Supplier ESG Screening
Procurement teams are turning ESG data collection into a continuing supplier management task rather than a once-a-year review. That shift matters for the ESG analytics and benchmarking platform market because demand is expanding through buyer-supplier relationships, not only through direct legal reporting obligations. Large companies increasingly need supplier-level data on emissions, labor, and environmental impacts to feed both internal monitoring and formal disclosures. This is one reason small suppliers are becoming a faster-growing user cohort even when headline reporting rules do not directly cover them. It also changes the software's purpose, as the platform becomes part of purchasing risk control and contract compliance. The result is a broader addressable base for vendors that can handle supplier onboarding, data validation, and cross-company data exchange.
Restraints Impact Analysis of ESG Analytics and Benchmarking Platform Market*
| Restraint | (~) % Impact on CAGR Forecast | Geographic Relevance | Impact Timeline |
|---|---|---|---|
| ESG Data Quality Gaps Across Private Suppliers | -1.5% | Global, most visible in Asia-Pacific and South America | Medium term (2-4 years) |
| Methodology Drift Across Rating and Benchmarking Models | -1.2% | Global | Long term (≥ 4 years) |
| High Implementation Burden for Mid-Market Firms | -0.9% | Europe and North America | Medium term (2-4 years) |
| Regulatory Fragmentation Across Jurisdictions | -0.8% | Global, especially for cross-border multinationals | Long term (≥ 4 years) |
| Source: Mordor Intelligence | |||
ESG Data Quality Gaps Across Private Suppliers
The biggest operating weakness in the ESG analytics and benchmarking platform market is still the quality of upstream supplier data. An OECD analysis published in 2025 found that only 7% of ESG metrics across major products directly addressed supply-chain risk management, while 68% of performance metrics remained input-based and qualitative.[3] A December 2025 Sage study added that only 32% of SMEs had sustainability reporting infrastructure in place, and 62% identified complexity as the main barrier to formal reporting. These conditions matter because small suppliers account for a large share of enterprise value chains, yet many still lack systems capable of producing auditable ESG data. That forces platform vendors to rely more heavily on estimation models, supplier engagement modules, and data quality controls, which raises product complexity and service effort. Until upstream reporting maturity improves, benchmarking depth will remain uneven across many customer environments.
Methodology Drift Across Rating and Benchmarking Models
Methodology differences across rating systems continue to weaken confidence in benchmark comparability. The OECD found that measurement divergence accounted for 56% of inter-rater disagreement, while scope divergence accounted for another 38%. The same study showed that one product used 28 times more governance metrics than another for the same topic, and corporate GHG emissions metrics ranged from 1 to 47 across the products reviewed. That creates a problem for the ESG analytics and benchmarking platform market, as customers often compare multiple data vendors before making portfolio- or board-level decisions. When results differ sharply, assurance work rises, and management confidence falls. Vendors that can explain methodology, preserve lineage, and reproduce outputs consistently are therefore in a stronger position than those that compete mainly on score coverage.
*Our forecasts treat driver/restraint impacts as directional, not additive. The impact forecasts reflect baseline growth, mix effects, and variable interactions.
ESG Analytics and Benchmarking Platform Market Segment Analysis
By Deployment Mode:
Cloud Architecture Dominates While Hybrid Gains on Data-Residency NeedsCloud-based deployment accounted for 66.12% of the ESG analytics and benchmarking platform market in 2025. That lead reflects the advantage of delivery models that can absorb regulatory updates through ongoing product releases rather than through one-time internal IT changes. Companies are using cloud environments to keep disclosure logic, benchmark settings, and emissions calculations aligned with changing reporting frameworks. This has made the cloud the default option for buyers who want faster implementation and easier update cycles across the ESG analytics and benchmarking platform market.
Hybrid deployment is projected to expand at 17.25% CAGR from 2026 to 2031. This growth reflects the reality that sensitive workforce, compensation, and social data cannot always move into a single public cloud environment. Multinational companies often need local handling for restricted data while still using centralized benchmarking and disclosure controls. That balance is expected to keep hybrid as the fastest-growing deployment pattern in the ESG analytics and benchmarking platform market.

By Offering:
Software Platforms Lead While Services Expand With Implementation ComplexitySoftware platforms accounted for 69.45% of the ESG analytics and benchmarking platform market in 2025. Enterprises favored configurable platforms that could bring together ESG data management, disclosure workflows, and benchmarking outputs in a single, governed environment. This preference strengthened as reporting expectations moved closer to finance and compliance controls. Audit trails, workflow approvals, and user-level access controls therefore support the leading position of software in the ESG analytics and benchmarking platform market.
Services are projected to grow at 17.05% CAGR from 2026 to 2031. This expansion reflects the complexity of implementing ESG systems across ERP, procurement, HR, supplier, and facility data sources simultaneously. Many companies still need support to map internal data to frameworks such as CSRD, GRI, SASB, CDP, and ISSB. Services are also gaining because many organizations still lack enough in-house reporting depth to manage full deployment and framework translation on their own.
By Enterprise Size:
Large Enterprises Supply Volume While SMEs Rise Through Buyer PressureLarge enterprises held 64.78% of the ESG analytics and benchmarking platform market share in 2025. Their lead came from larger contract values, more complex multi-entity reporting needs, and earlier exposure to formal disclosure obligations. These organizations often run interconnected workflows for internal performance analysis and assurance-ready external reporting. That structure has kept large enterprises at the center of current spending in the ESG analytics and benchmarking platform market.
Small and medium enterprises are projected to grow at 17.12% CAGR from 2026 to 2031. Their growth is being driven less by direct regulation and more by procurement requirements flowing from larger customers. Many SMEs are being asked to provide structured sustainability and emissions data so enterprise buyers can complete broader value-chain reporting. This is widening the demand for lighter, more modular products in the ESG analytics and benchmarking platform market.
By End-Use Industry:
BFSI Anchors Current Demand While Retail and E-Commerce Expands FastBFSI held the largest end-use share at 27.41% of the ESG analytics and benchmarking platform market in 2025. Financial institutions face more detailed ESG analytics requirements because they must monitor risk across their own operations, counterparties, and portfolios. HSBC Continental Europe’s 2025 annual report highlighted the European Banking Authority’s final guidelines on ESG risk management, which became applicable from January 11, 2026. That is helping BFSI remain the anchor demand segment in the ESG analytics and benchmarking platform market.
Retail and e-commerce are projected to grow at 17.34% CAGR from 2026 to 2031. Supply-chain accounting, product disclosure requirements, and deeper sourcing oversight across broader supplier networks are driving this segment. Target’s 2025 Sustainability and Governance Report disclosed a 5.6% reduction in Scope 3 emissions relative to its 2017 baseline, achieved through supplier collaboration and logistics optimization. That operating model is increasing demand for platforms that can combine supplier inputs, internal controls, and benchmark reporting within a single workflow.[4]
Geography Analysis
Europe ESG Analytics and Benchmarking Platform Market
Europe held 34.56% of the ESG analytics and benchmarking platform market share in 2025. The region led because it had the strongest mix of enforceable disclosure rules, buyer expectations, and reporting discipline across large enterprises. That environment supported demand for platforms that could manage recurring reporting cycles, assurance preparation, and benchmark consistency. The regional market also benefits from supply-chain effects because large in-scope companies pass structured ESG data requirements to a much wider supplier base. IHK München noted in 2026 that many firms removed from direct CSRD scope would still face indirect reporting demands through customer relationships.
The Americas ESG Analytics and Benchmarking Platform Market
North America also accounted for a meaningful share of the ESG analytics and benchmarking platform market in 2025. Enterprise climate reporting needs, investor scrutiny, and the extraterritorial effect of European disclosure requirements on global companies have driven demand in the region. U.S.-based multinationals with operations, listings, or supplier links in Europe have had to strengthen their reporting systems, even where local rules were less uniform. This has supported platform adoption among companies that need to work across multiple reporting regimes simultaneously. South America remained at an earlier stage, with Brazil leading demand among large listed companies, while other South American markets stayed in a more gradual adoption phase.
APAC and MEA ESG Analytics and Benchmarking Platform Market
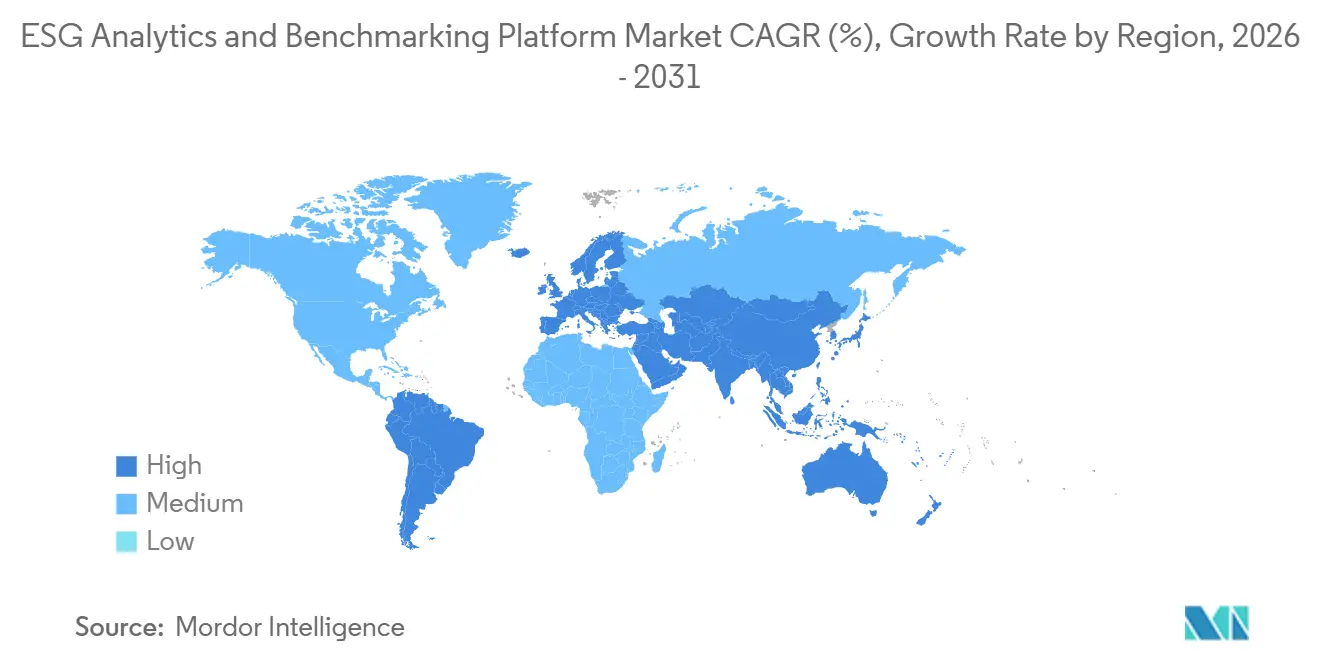
Asia-Pacific is projected to expand at a 17.45% CAGR from 2026 to 2031, making it the fastest-growing regional segment in the ESG analytics and benchmarking platform market. The region’s momentum reflects a broader rise in sustainability integration across business operations rather than reliance on a single regulatory trigger. The Conference Board reported in 2026 that Asia-Pacific executives placed greater emphasis on corporate sustainability than global peers, and that 50% or more of businesses in the region were expected to have fully integrated sustainability operations by 2026, up from 36% in 2025. The Middle East and Africa are also growing from a smaller base, supported by national sustainability agendas, investor screening requirements, and buyer-led supply-chain reporting requests for export-facing companies.
Competitive Landscape
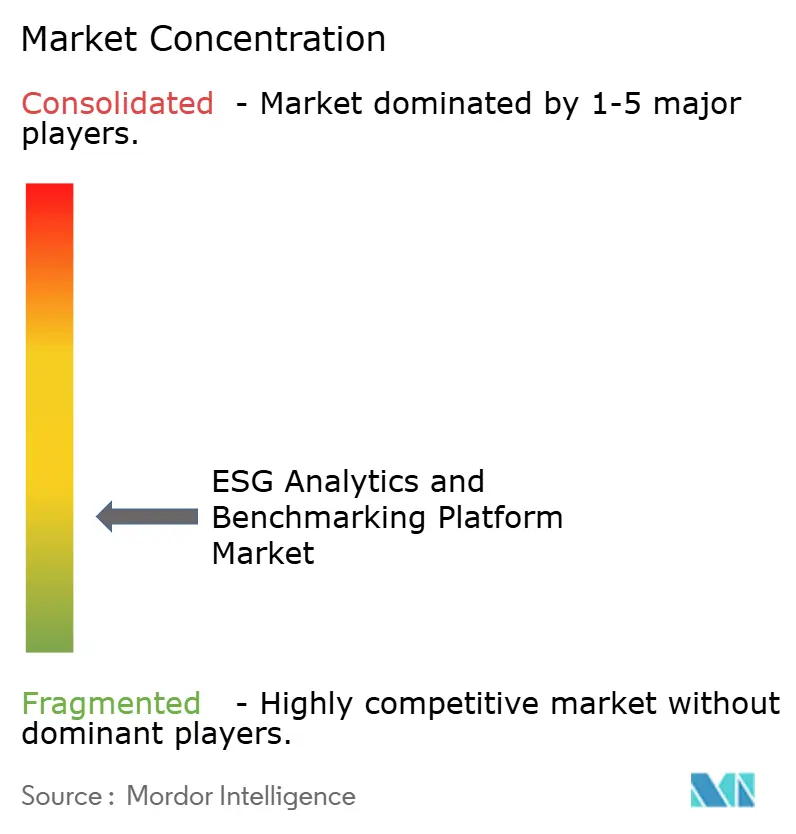
The ESG analytics and benchmarking platform market is showing a fascinating split in competitive dynamics. On one side, the big enterprise software players like Microsoft, IBM, SAP, and Salesforce are leveraging their integration into ERP, CRM, and data management ecosystems to lock in customers. That depth of connection makes their ESG modules sticky once embedded into workflows. On the other hand, specialized providers such as Persefoni AI, Novisto, EcoVadis, and Diligent are carving out space by offering greater granularity, regulatory alignment, and supplier intelligence.
A notable strategic shift through 2025 and 2026 has been the pivot from disclosure-first tools to analytics-first platforms. IBM’s Envizi updates, for example, moved closer to operational workflows by adding Excel-based emissions calculations and framework configurations aligned to evolving reporting needs. Vendors are also investing heavily in agentic AI, natural-language analysis, and unified data layers to accelerate insight generation from controlled datasets. Partnerships between supply-chain data specialists and disclosure platforms are further strengthening Scope 3 coverage, which is a critical pain point for enterprises.
The market’s white space lies in SME-focused products, supplier data exchange networks, and AI agents capable of handling double materiality assessments at enterprise speed. Meanwhile, vendors relying on older EHS-style architectures are increasingly exposed, as their weaker ingestion, interoperability, and iteration cycles struggle to keep pace. In this environment, platforms that emphasize auditability, benchmark transparency, and seamless integration into enterprise systems are best positioned to capture demand.
ESG Analytics and Benchmarking Platform Industry Leaders
-
Microsoft Corporation
-
SAP SE
-
IBM Corporation
-
Salesforce, Inc.
-
Workiva Inc.
- *Disclaimer: Major Players sorted in no particular order
ESG Analytics and Benchmarking Platform Market Companies Covered in this Report
- Microsoft Corporation
- IBM Corporation
- SAP SE
- Salesforce, Inc.
- Wolters Kluwer N.V.
- Workiva Inc.
- Sphera Solutions, Inc.
- Enablon SAS
- Intelex Technologies ULC
- Diligent Corporation
- Cority Software Inc.
- Nasdaq, Inc.
- EcoVadis SAS
- Ulula Inc.
- Novisto Inc.
- SP Global Inc.
- Moody’s Corporation
- LSEG Data and Analytics,
- Gensuite LLC
- Persefoni AI, Inc.
Recent Industry Developments in ESG Analytics and Benchmarking Platform Market
- May 2026: IFS launched IFS Zero, an agentic Emissions Operating System purpose-built for asset-intensive industries, enabling organizations to measure, disclose, and optimize Scope 1, 2, and 3 carbon emissions through a single unified calculation platform built alongside IFS's Sustainability Management module. The launch directly addresses Industrial Manufacturing, Energy and Utilities, and Oil and Gas sectors facing CSRD and GHG Protocol reporting requirements.
- May 2026: Persefoni AI unveiled the Persefoni Analytics Agent, an agentic AI tool enabling sustainability, finance, and compliance teams to ask questions about emissions data using natural language, generate cross-business-unit visualizations, and produce audit-ready carbon footprint comparisons without leaving the Persefoni platform. Persefoni has supported more than 9,000 organizations globally and raised USD 179 million from institutional investors to date.
- May 2026: Persefoni AI unveiled the Persefoni Analytics Agent, an agentic AI tool enabling sustainability, finance, and compliance teams to ask questions about emissions data using natural language, generate cross-business-unit visualizations, and produce audit-ready carbon footprint comparisons without leaving the Persefoni platform. Persefoni has supported more than 9,000 organizations globally and raised USD 179 million from institutional investors to date.
- April 2026: IBM launched the Envizi Emissions API, part of the IBM Envizi ESG Suite, with access to over 140,000 emissions factor datasets, enabling enterprises and software vendors to embed GHG Protocol-aligned GHG emissions calculations into existing workflows without maintaining internal factor libraries.
Global ESG Analytics and Benchmarking Platform Market Report Scope
The ESG Analytics and Benchmarking Platform market refers to software platforms and services that enable organizations to measure, monitor, and benchmark their environmental, social, and governance (ESG) performance. These solutions provide functionalities such as carbon and emissions accounting, sustainability reporting and disclosure, supply chain ESG and supplier sustainability management, and advanced analytics for forecasting and scenario modeling. By embedding ESG intelligence into enterprise workflows, these platforms help organizations comply with regulatory frameworks, improve transparency, enhance stakeholder trust, and align operations with sustainability and ethical governance standards.
The ESG Analytics and Benchmarking Platform market report is segmented by Deployment Mode (Cloud-Based, On-Premises, and Hybrid), Offering (Software Platforms, and Services), Enterprise Size (Large Enterprises, and Small and Medium-Sized Enterprises), End-Use Industry (IT and Telecom, BFSI, Industrial Manufacturing, Energy and Utilities, Oil and Gas, Retail and E-Commerce, Food and Beverage Manufacturing, Construction and Infrastructure, Government and Public Sector, and Other End-User Industries), and Geography (North America, South America, Europe, Asia-Pacific, Middle East, and Africa). The Market Forecasts are Provided in Terms of Value (USD).
Segmentation Overview
| Cloud-Based |
| On-Premises |
| Hybrid |
| Software Platforms |
| Services |
| Large Enterprises |
| Small and Medium Enterprises |
| IT and Telecom |
| BFSI |
| Industrial Manufacturing |
| Energy and Utilities |
| Oil and Gas |
| Retail and E-Commerce |
| Food and Beverage Manufacturing |
| Construction and Infrastructure |
| Government and Public Sector |
| Other End-User Industries |
| North America | United States | |
| Canada | ||
| Mexico | ||
| South America | Brazil | |
| Argentina | ||
| Rest of South America | ||
| Europe | Germany | |
| United Kingdom | ||
| France | ||
| Italy | ||
| Spain | ||
| Russia | ||
| Rest of Europe | ||
| Asia-Pacific | China | |
| India | ||
| Japan | ||
| South Korea | ||
| Australia | ||
| Rest of Asia-Pacific | ||
| Middle East and Africa | Middle East | Saudi Arabia |
| United Arab Emirates | ||
| Rest of Middle East | ||
| Africa | South Africa | |
| Nigeria | ||
| Rest of Africa | ||
| By Deployment Mode | Cloud-Based | ||
| On-Premises | |||
| Hybrid | |||
| By Offering | Software Platforms | ||
| Services | |||
| By Enterprise Size | Large Enterprises | ||
| Small and Medium Enterprises | |||
| By End-Use Industry | IT and Telecom | ||
| BFSI | |||
| Industrial Manufacturing | |||
| Energy and Utilities | |||
| Oil and Gas | |||
| Retail and E-Commerce | |||
| Food and Beverage Manufacturing | |||
| Construction and Infrastructure | |||
| Government and Public Sector | |||
| Other End-User Industries | |||
| By Geography | North America | United States | |
| Canada | |||
| Mexico | |||
| South America | Brazil | ||
| Argentina | |||
| Rest of South America | |||
| Europe | Germany | ||
| United Kingdom | |||
| France | |||
| Italy | |||
| Spain | |||
| Russia | |||
| Rest of Europe | |||
| Asia-Pacific | China | ||
| India | |||
| Japan | |||
| South Korea | |||
| Australia | |||
| Rest of Asia-Pacific | |||
| Middle East and Africa | Middle East | Saudi Arabia | |
| United Arab Emirates | |||
| Rest of Middle East | |||
| Africa | South Africa | ||
| Nigeria | |||
| Rest of Africa | |||
Key Questions Answered in the Report
What is the size outlook for the ESG analytics and benchmarking platform market?
The ESG analytics and benchmarking platform market is projected at USD 4.16 billion in 2025, USD 4.80 billion in 2026, and USD 10.51 billion by 2031, with a 16.97% CAGR over 2026-2031.
Which region leads current demand for ESG analytics and benchmarking platforms?
Europe led in 2025 with 34.56% share, supported by stronger reporting discipline, assurance readiness, and supplier data requirements.
Which end-use sector creates the largest current revenue pool?
BFSI held the largest share at 27.41% in 2025 because banks and financial institutions need more granular ESG risk, counterparty, and portfolio analytics.
Which customer group is expanding fastest?
SMEs are projected to grow at 17.12% CAGR through 2031, mainly because larger buyers are pushing ESG data requests into supplier networks.
Why is hybrid deployment gaining traction?
Hybrid deployment is forecast to grow at 17.25% CAGR because companies need central analytics while keeping restricted workforce and social data closer to local systems.
What is shaping competition among platform vendors in 2026?
Competition is shifting toward AI-enabled normalization, auditability, benchmark transparency, and interoperability with ERP, procurement, and data platforms rather than simple disclosure support alone.