Embedded Analytics Market Size and Share
Market Overview
| Study Period | 2020 - 2031 |
|---|---|
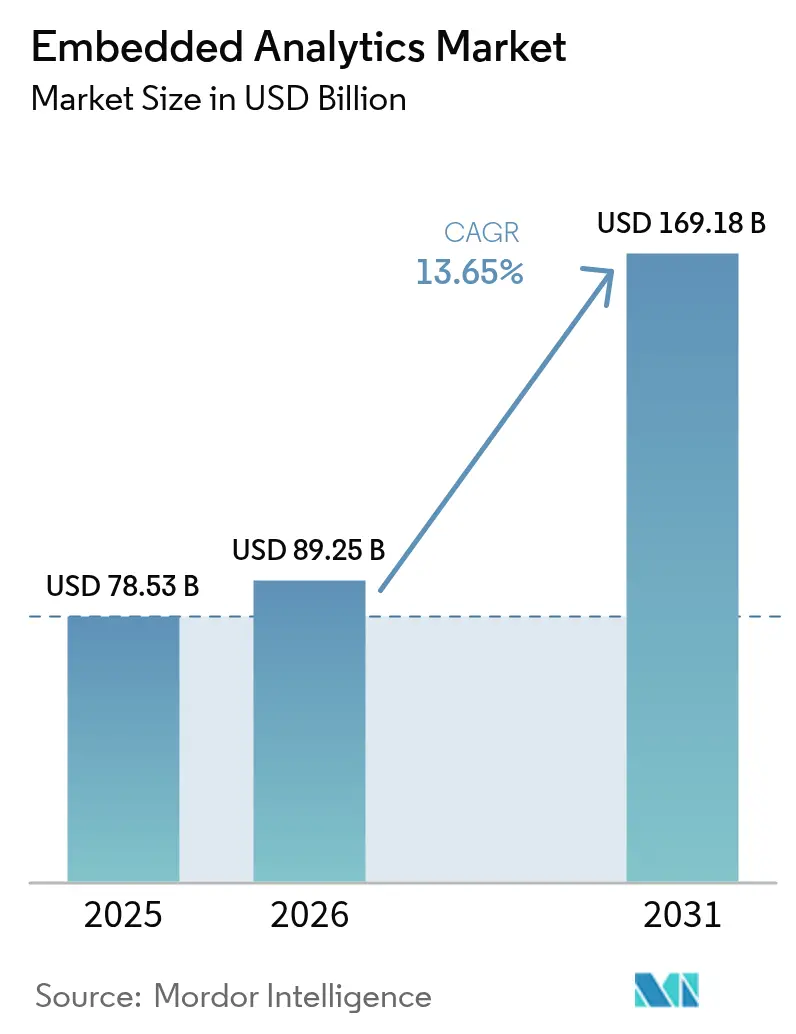
| Market Size (2026) | USD 89.25 Billion |
| Market Size (2031) | USD 169.18 Billion |
| Growth Rate (2026 - 2031) | 13.65% CAGR |
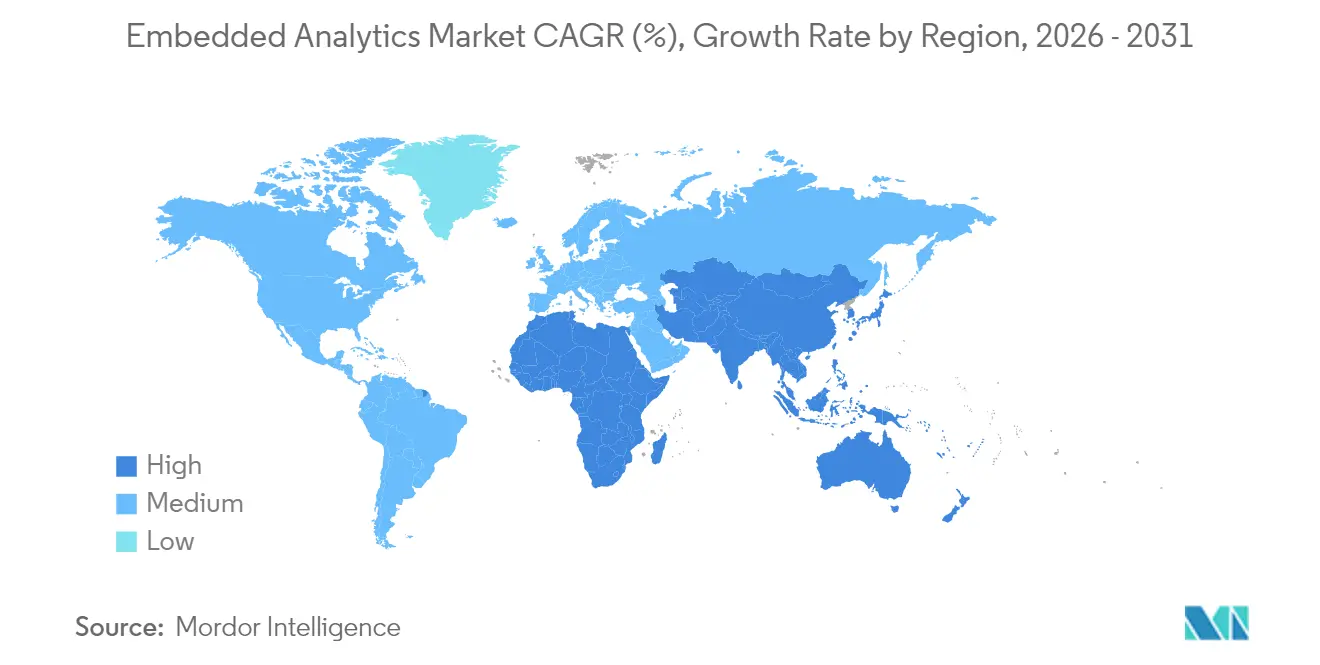
| Fastest Growing Market | Asia Pacific |
| Largest Market | North America |
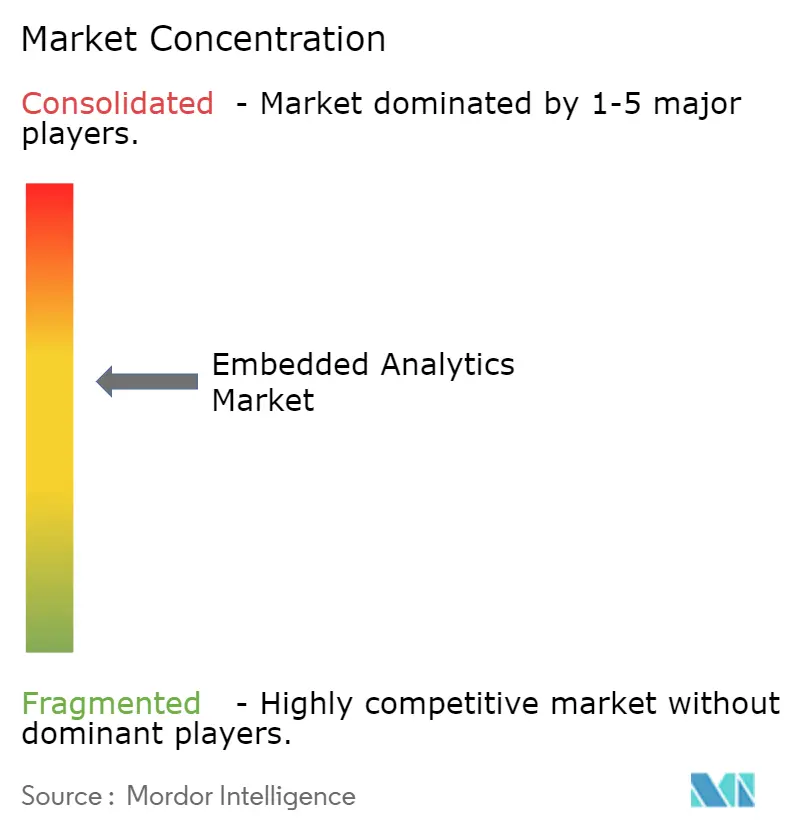
| Market Concentration | Medium |
Major Players*Disclaimer: Major Players sorted in no particular order Image © Mordor Intelligence. Reuse requires attribution under CC BY 4.0. | |
Embedded Analytics Market Analysis by Mordor Intelligence
The embedded analytics market size is expected to grow from USD 78.53 billion in 2025 to USD 89.25 billion in 2026 and is forecast to reach USD 169.18 billion by 2031 at 13.65% CAGR over 2026-2031. Demand is surging as organizations embed real-time insight into everyday workflows, replacing stand-alone BI tools that force users to switch context. Software remains the chief revenue driver, yet advisory and integration services are expanding rapidly as deployments grow more complex. Cloud deployment leads adoption, but hybrid models are spreading in regulated industries that must balance data-sovereignty with the scalability of SaaS. North America holds the largest revenue base, while Asia-Pacific is the fastest-growing region thanks to sustained investment in digital infrastructure, mobile channels, and edge-ready networks. Competitive pressure is mounting as large enterprise software vendors and agile specialists race to add prescriptive and AI-assisted features that recommend actions rather than merely describe events.
Key Report Takeaways
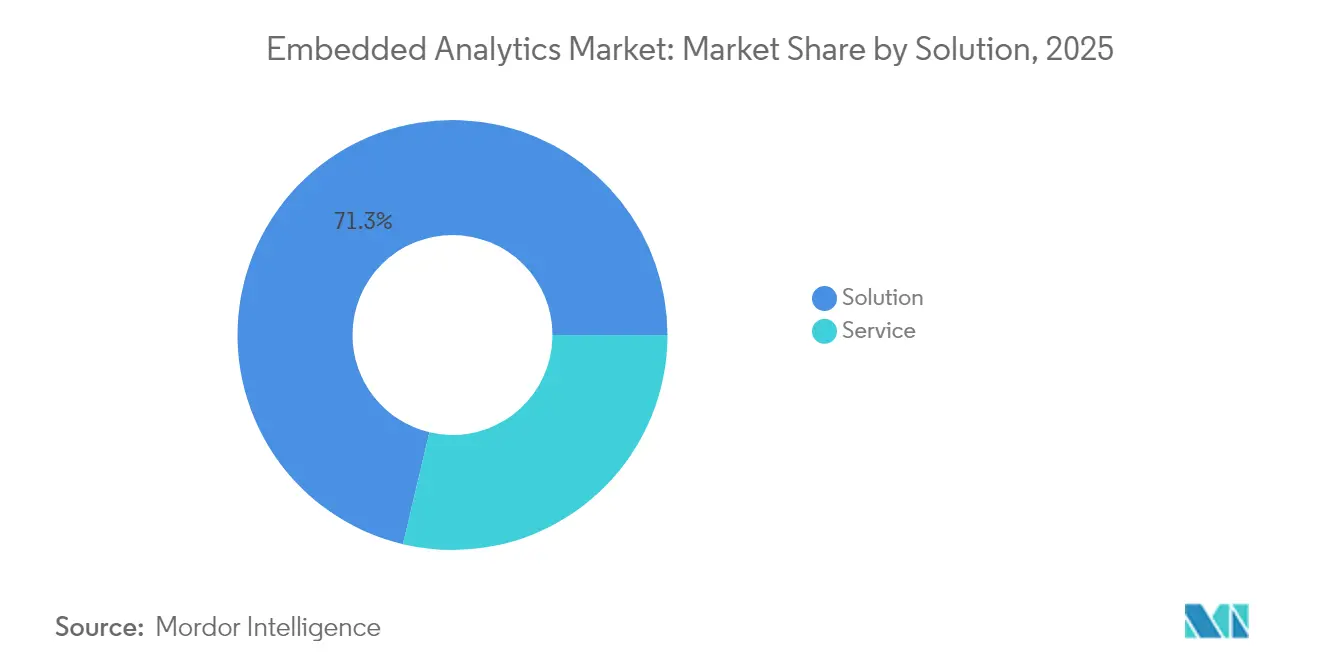
- By solution, software led with 71.30% revenue share in 2025, while services are projected to expand at a 15.95% CAGR to 2031.
- By size of organization, large enterprises held 63.20% of the embedded analytics market share in 2025; SMEs record the highest projected CAGR at 14.75% through 2031.
- By deployment, cloud captured 59.10% share of the embedded analytics market size in 2025 and is set to grow at 15.35% CAGR through 2031.
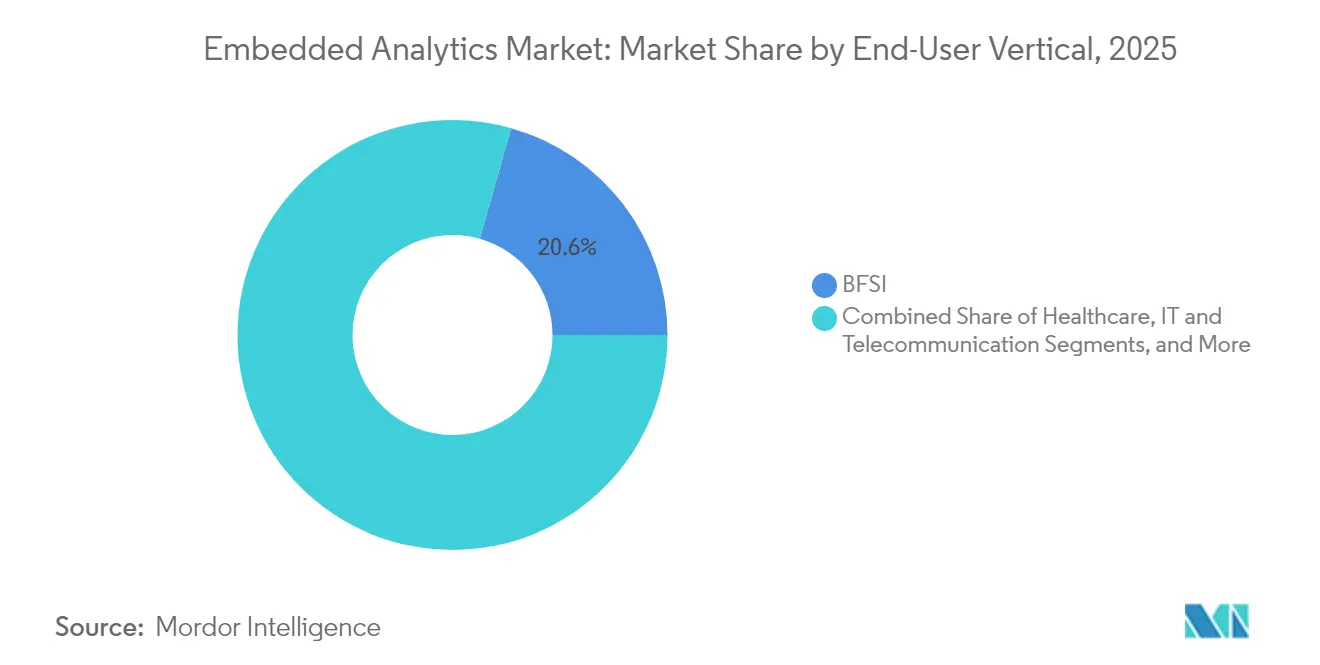
- By end-user vertical, BFSI accounted for 20.60% of the embedded analytics market size in 2025; healthcare is advancing at a 15.25% CAGR through 2031.
- By integration mode, on-dashboard/embedded charts led with 44.20% share in 2025, whereas in-application workflows are forecast to rise at a 17.05% CAGR to 2031.
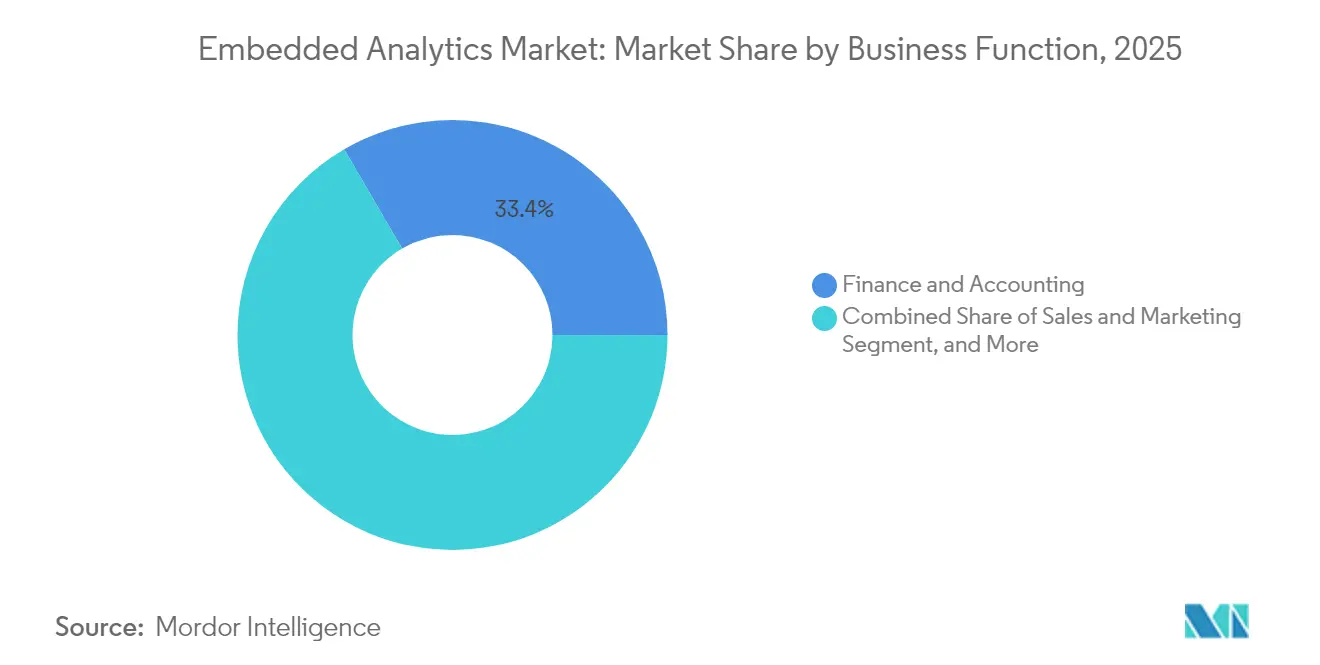
- By business function, finance and accounting commanded 33.40% share in 2025; sales and marketing is growing fastest at 17.60% CAGR through 2031.
- By analytics type, descriptive analytics held 47.30% share in 2025; prescriptive analytics is projected to expand at a 19.55% CAGR to 2031.
- By geography, North America dominated with 36.50% share in 2025, while Asia-Pacific posts the quickest growth at 15.05% CAGR to 2031.
Note: Market size and forecast figures in this report are generated using Mordor Intelligence’s proprietary estimation framework, updated with the latest available data and insights as of 2026.
Market Trends and Insights
Drivers Impact Analysis of Embedded Analytics Market*
| Driver | (~) % Impact on CAGR Forecast | Geographic Relevance | Impact Timeline |
|---|---|---|---|
| Growing convergence of headless BI frameworks with low-code platforms | +2.1% | North America; spillover to Western Europe | Medium term (2-4 years) |
| Demand for near-real-time insight in mid-market manufacturing hubs | +1.8% | Germany, Japan, Southeast Asia | Short term (≤ 2 years) |
| FinTech push for embedded AI-driven dashboards inside mobile apps | +1.5% | ASEAN, North America, Western Europe | Medium term (2-4 years) |
| Healthcare shift to value-based reimbursement demanding bedside analytics | +1.2% | U.S., U.K.; expanding across the EU | Medium term (2-4 years) |
| Energy-utility grid modernization needing in-workflow analytics | +0.9% | Nordics, Germany, Japan | Long term (≥ 4 years) |
| Increasing demand for real-time data-driven decision-making | +1.3% | Global - Asia Pacific | Short term (≤ 2 years) |
| Source: Mordor Intelligence | |||
Growing Convergence of Headless BI Frameworks with Low-Code Platforms
Headless BI paired with low-code tooling lets development teams decouple the data layer from the presentation layer, accelerating custom analytics builds. In 2025, 37% of executives in North America seek BI tooling that supports bespoke data apps. RamSoft completed a production-grade rollout in two weeks through Cube’s headless architecture, trimming months from earlier timelines.[1]Cube Dev Team, “How RamSoft Built Its Users Native Embedded Analytics in Two Weeks,” Cube Dev, cube.dev These solutions remove context-switching, delivering productivity lifts of 20-40% as users stay within operational screens while consuming insight.
Demand for Near-Real-Time Insight in Mid-Market Manufacturing Hubs
Factory operators embed analytics into MES and SCADA systems to flag anomalies as they emerge. Manufacturing-sector revenue tied to the embedded analytics market is set to climb from USD 41.1 billion in 2020 to USD 77.3 billion in 2025. Predictive maintenance alone cuts equipment downtime by 30-50%. German and Japanese plants fold these capabilities into Industrie 4.0 roadmaps to steady operations amid volatile input costs and logistics disruptions.
FinTech Push for Embedded AI-Driven Dashboards inside Mobile Apps
Payments firms and super-apps across ASEAN weave AI-powered dashboards into consumer journeys to personalise lending, insurance, and savings propositions. Embedded finance in the region hit USD 185 billion in 2024 and is expected to top USD 228 billion by 2028. Payments processors turn to such analytics to defend margins and position value-added services as differentiators, while B2B platforms use the same techniques to unlock legacy data and sharpen working-capital decisions.
Energy-Utility Grid Modernization Needing In-Workflow Analytics
Nordic utilities pursue high-resolution monitoring to balance variable renewables and aging grid assets. Eight core use cases-including smart energy management and predictive asset maintenance-rely on embedded analytics for low-latency insight. Generative AI layers now automate incident triage and customer communications, allowing resource‐constrained teams to manage rising grid complexity without sweeping platform overhauls.
Restraints Impact Analysis of Embedded Analytics Market*
| Restraint | (~) % Impact on CAGR Forecast | Geographic Relevance | Impact Timeline |
|---|---|---|---|
| Data-residency rules limiting in-app cloud embedding | -1.7% | EU, GCC; increasingly global | Medium term (2-4 years) |
| Fragmented open-source licensing increasing hidden TCO in SMEs | -1.3% | Global | Short term (≤ 2 years) |
| Scarcity of domain-contextual BI talent hindering vertical adoption in Africa | -0.8% | Africa; spillover to other emerging markets | Long term (≥ 4 years) |
| High technical debt inside legacy core-banking systems | -1.1% | Global, concentrated in established financial markets | Medium term (2-4 years) |
| Source: Mordor Intelligence | |||
Data-Residency Rules Limiting In-App Cloud Embedding
Stringent sovereignty mandates force multinationals to keep sensitive data-and often processing-within specific borders, complicating global analytic rollouts.[2]European Commission, “General Data Protection Regulation (GDPR) Text,” EUR-Lex, eur-lex.europa.eu Hybrid architectures now account for roughly 40% of deployments, blending on-premise nodes for regulated workloads with cloud resources for less sensitive analyses. Complexity and cost slow time-to-value, particularly in finance and healthcare where compliance burdens are highest.
Fragmented Open-Source Licensing Increasing Hidden TCO in SMEs
SMEs often choose open-source engines to save licensing fees, yet inconsistent licenses, dependency sprawl, and patch-management overhead can push total cost beyond initial expectations.[3]Karthikeyan P. et al., “A Study to Analyze Cost-Effective Adoption of Business Analytics in MSMEs,” Journal of Emerging Technologies and Innovative Research, jetir.org Academic work on MSME adoption highlights skill shortages and culture gaps that magnify these costs. Nonetheless, vendor-backed distributions with transparent pricing and managed services are emerging, helping SMEs sustain the 15.1% CAGR forecast for this segment.
*Our forecasts treat driver/restraint impacts as directional, not additive. The impact forecasts reflect baseline growth, mix effects, and variable interactions.
Embedded Analytics Market Segment Analysis
By Solution:
Software Dominates While Services AccelerateThe software segment generated USD 55.99 billion in 2025, equal to 71.30% of total revenue, underscoring its role as the core engine powering visualisation, modelling, and AI inference. Growth stems from richer libraries and APIs that now support prescriptive logic and automated decisioning inside host applications. Services, however, race ahead at a 15.95% CAGR as enterprises seek integration expertise, schema design, and change-management support. Complex rollouts involving role-based security, multi-tenant data models, and user-experience tuning are turning professional services into a strategic spend category.
Organizations pursuing multi-cloud or hybrid analytics architectures require deep knowledge of connectivity, data-lineage governance, and CI/CD pipelines for analytics assets. Advisory partners thus move upstream into architectural blueprints, while managed-service providers offer day-two operations that update semantic layers, tune queries, and continuously train ML models. This service ecosystem is expected to widen as low-code tooling expands the reach of the embedded analytics market into business-unit teams unfamiliar with traditional BI stacks.


By Size of Organization:
Enterprise-Grade Solutions Evolve as SME Adoption AcceleratesLarge enterprises controlled USD 49.63 billion-63.20% of the embedded analytics market-in 2025, deploying federated data fabrics that push governed metrics to thousands of internal users. These firms build multi-tenant models to serve business lines while preserving cross-domain security and audit trails. Their priority is consistency of KPI definitions across global footprints.
SMEs, though smaller in spending, are the fastest risers at 14.75% CAGR. Cloud-native platforms with usage-based pricing allow these firms to acquire capabilities once reserved for Fortune 500 budgets. Knowledge-integration research shows that SMEs convert analytical insight into product innovation and operational agility when cultural and process enablers are in place. As low-code composability lowers barriers further, SMEs are expected to widen experimentation without the capex burden previously attached to enterprise BI suites.
By Deployment:
Cloud Dominance Accelerates with Hybrid Models EmergingCloud deployments generated USD 46.41 billion in 2025-59.10% of revenue-and will climb at 15.35% CAGR as SaaS vendors enrich their offerings with native analytics. Lower up-front cost, elastic scaling, and continuous feature releases make cloud the default for digital-native firms and mid-market adopters. On-premise remains essential for highly regulated workloads, accounting for USD 32.12 billion or 40.90% of spend. These environments provide data locality and bespoke customization that public clouds cannot always match.
Hybrid architecture is now a mainstream design pattern, blending local data-processing nodes with cloud-based visualisation layers. This approach satisfies sovereignty rules while still allowing cross-domain consolidation of non-sensitive data. As a result, the embedded analytics market size tied to hybrid patterns is projected to outpace purely on-premise growth, supporting phased migration strategies and just-in-time burst capacity.
By End-User Vertical:
BFSI Leads While Healthcare Experiences Fastest GrowthBFSI applications represented USD 16.18 billion or 20.60% of 2025 revenue, exploiting embedded analytics for fraud detection, real-time risk scoring, and hyper-personalised product offers. Banks weave insight into mobile and web channels to enhance customer lifetime value and comply with regulatory reporting.
Healthcare’s 15.25% CAGR makes it the swiftest-moving vertical. Providers embed analytics into electronic health-record screens, bedside monitors, and payer-audit systems to correlate clinical outcomes with reimbursement metrics. Examples such as ThoughtSpot-powered compliance modules illustrate how interactive search and AI suggestions shorten claim cycles and cut leakage. Manufacturing, retail, and energy each pursue their own domain-specific use cases-from predictive maintenance to demand forecasting-expanding the overall embedded analytics industry footprint.
By Integration Mode:
Dashboard Leadership Shifts Toward In-Application WorkflowsOn-dashboard and embedded chart deployments held 44.20% of the embedded analytics market share in 2025, equal to USD 34.72 billion in 2025, underscoring the continuing appeal of familiar, tableau-style visualizations that sit beside core tasks. Demand for self-service drill-down, exportable widgets, and light customization keeps this mode relevant, especially in back-office finance and HR suites where users already rely on board-level KPI snapshots.
In-application and workflow-level integrations are, however, expanding at a 17.05% CAGR through 2031 because teams want guidance exactly where transactions occur rather than on parallel reporting pages. Software-development-kit embeds deliver native fonts, role-based security, and single sign-on, eliminating iframe-related latency and privacy gaps. Vendors also bundle pre-trained AI models that watch interaction patterns and surface nudges-such as reorder suggestions or fraud warnings-at millisecond speed. Portal and web-embedding approaches still serve partner and customer ecosystems that need cross-application visibility, but their growth lags as enterprises re-platform toward context-aware micro front-ends that blur the line between operational and analytical clicks.
By Business Function:
Finance Foundations Broaden as Sales and Marketing Gains MomentumFinance and accounting generated USD 26.24 billion in 2025, forming the largest slice of the embedded analytics market size thanks to real-time cash-flow monitoring, continuous close, and rule-based anomaly detection that shortens audit cycles. Controllers adopt embedded variance dashboards that surface GL outliers in seconds, while treasury teams stream FX exposures into risk heatmaps that update with each trade confirmation. Predictive cash-collection scoring further automates dunning strategies, reducing day-sales-outstanding without sacrificing customer satisfaction.
Sales and marketing deployments are accelerating at an 17.60% CAGR as frontline staff demand pipeline intelligence inside CRM and campaign platforms rather than in separate BI portals. AI-driven propensity scoring suggests upsell candidates, while marketing leaders receive instant feedback on creative tests, allowing budget shifts mid-flight. Customer-service groups also embed sentiment analytics in ticket screens, feeding churn-prevention models that trigger targeted win-back offers. Operations and supply-chain users follow close behind, overlaying shipment ETAs, inventory buffers, and supplier risk scores directly onto order-management consoles to heighten resilience.
By Analytics Type:
Descriptive Core Persists While Prescriptive Takes the LeadDescriptive analytics remained the foundation in 2025, accounting for USD 37.13 billion as firms still need clear retrospectives on what happened and why. Dashboards summarizing historical KPIs, regulatory filings, and SLA adherence continue to satisfy statutory and stewardship duties. Diagnostic routines extend this base by tracing root-cause factors such as channel mix or production bottlenecks, supplying the narrative that executives and auditors expect.
Prescriptive analytics, expanding at a 19.55% CAGR, transforms insight into recommended actions through optimisation solvers and scenario engines that weigh constraints like budget, capacity, and risk tolerance. Retailers now embed markdown algorithms inside point-of-sale modules to balance margin and sell-through in real time, while logistics firms calculate least-cost routing on the fly as fuel prices swing. Predictive models serve as the bridge-forecasting demand, risk, or attrition probabilities-before prescriptive layers select the best response. Together these tiers create an analytics continuum in which organisations progress from “what happened” to “what should we do next,” all without forcing users to leave their primary workspace.
Geography Analysis
North America Embedded Analytics Market
North America generated USD 28.66 billion in 2025, or 36.50% of global revenue, reflecting mature digital infrastructure, deep cloud penetration, and a workforce versed in data-driven processes. Financial services, healthcare, and technology firms lead demand, with headless BI and low-code convergence accelerating product rollouts across the embedded analytics market. Early enterprise adopters continue to upgrade from descriptive dashboards to AI-augmented prescriptive modules.
Germany, United Kingdom and France Embedded Analytics Market
Europe exhibits steady growth anchored by strong privacy regulation that shapes deployment choices. Germany, the U.K., and France spearhead investment as manufacturers integrate Industry 4.0 frameworks and financial platforms extend embedded finance models inside non-bank apps. Vendors differentiate through granular consent management, encryption, and local hosting options that align with GDPR and sovereign-cloud mandates.
APAC Embedded Analytics Market
Asia-Pacific is the fastest-expanding region at 15.05% CAGR, powered by mobile-first consumer behaviour and ambitious government transformation agendas. Japan leads automation plans, with 89% of CFOs targeting deeper embedded analytics by 2025. India and Southeast Asian economies accelerate adoption via low-cost cloud infrastructure and fintech innovation. These dynamics broaden the embedded analytics market size in the region, giving rise to local platform providers and creating new partnerships for multinational vendors.

Regulatory Landscape
Embedded analytics deployments are increasingly shaped by overlapping AI and data-protection regimes, since insight is delivered inside operational workflows that often use automated or AI-assisted decisioning. In the European Union, the EU AI Act introduces requirements tied to risk level and transparency, including enforceable transparency obligations for general-purpose AI (GPAI) model outputs (Article 50) alongside prohibitions for unacceptable-risk practices (Article 5). Data protection remains a core compliance design anchor in regulated industries, with GDPR-aligned controls influencing where embedded analytics can run and how user-facing explanations, consent, and auditing are implemented.
In 2026, EU institutions and regulators also issued clarifications and timeline adjustments that affect embedded analytics vendors and adopters. The EDPB issued Guidelines 02/2026 on anonymisation (July 2026), reflecting the need to reassess anonymisation techniques for AI-driven processing and analytics contexts. Separately, the EDPB and EDPS issued Joint Opinion 2/2026 (February 2026) supporting the European Commission Digital Omnibus proposal to simplify compliance across digital legislation, alongside adjusted timelines for certain AI Act conformity obligations for high-risk categories. Outside the EU, the NIST AI Risk Management Framework (AI RMF) offers a widely adopted voluntary structure (Govern, Map, Measure, Manage) that many global enterprises use for embedded AI and analytics features, especially when embedded analytics surfaces support critical infrastructure use cases.
Value Chain Analysis
The embedded analytics value chain begins with data generation and capture across operational systems (ERP, CRM, HCM, MES/SCADA, and industry data feeds), then moves into integration and modeling through connectors, semantic layers, and governance. From there, embedded delivery into host applications is enabled via SDKs, APIs, and UI components. Platform vendors and specialists supply query engines, visualization layers, natural-language and AI-assisted features, and administration tooling for multi-tenant environments, while cloud providers and data platforms provide the compute, storage, and identity services used across many deployments. Professional services and systems integrators contribute materially to architecture design, tenant isolation, role-based access controls, and lifecycle operations, particularly in hybrid setups used to meet data-residency constraints.
Standards and interoperability efforts also shape upstream design choices and downstream portability for embedded analytics components. In March 2025, OASIS Open launched the Data Provenance Standards Technical Committee, with founding sponsors including Cisco, IBM, Intel, Microsoft, and Red Hat, to support clearer lineage and provenance practices that can improve trust and auditability of embedded insights. In 2025, the EDM Council signed an agreement to acquire the Object Management Group (OMG) and completed the acquisition later in the year, consolidating standards communities and artifacts that intersect with data management and systems interoperability, which can influence how embedded analytics products align to shared models and governance expectations. On the delivery side, many implementations reduce latency by integrating directly with source applications at query time, rather than relying solely on batch ETL, increasing the importance of performant connectors, secure token propagation, and row-level security across tenants.
Competitive Landscape
Competition spans broad-stack vendors, specialist platform providers, and emerging start-ups. Microsoft, SAP, Oracle, and Google deepen product suites with AI query, natural-language generation, and vertically pre-configured logic. Their scale assures performance, but agile vendors such as ThoughtSpot, Domo, and Reveal BI win on speed of deployment, flexible licensing, and domain-optimised SDKs. Microsoft’s 2025 upgrade added natural-language Q&A and automated insight discovery, simplifying integration into third-party apps and expanding appeal among mid-market ISVs.
Specialists target white-space niches like edge analytics for IoT and prescriptive engines tuned to domain constraints. Number Analytics launched a manufacturing-focused module delivering sub-second anomaly detection. CelerData unveiled a high-concurrency engine that handles tens of thousands of simultaneous queries inside customer-facing apps without resorting to complex sharding. Generative AI integration represents the next battleground: several providers now expose conversational agents that translate user prompts into SQL, visualisations, or recommended actions.[4]CelerData, “What Is Embedded Analytics and How Does It Work,” CelerData, celerdata.com
Strategic alliances also shape the field. ISVs increasingly pre-package analytics components rather than building proprietary stacks, compressing time-to-market. As market fragmentation persists-no vendor holds a dominant double-digit global share-partners that offer embedded analytics engines as white-label components gain traction among SaaS firms pursuing stickier user experiences.
Embedded Analytics Industry Leaders
Oracle Corporation
MicroStrategy Incorporated
SAP SE
Microsoft Corporation
IBM Corporation
- *Disclaimer: Major Players sorted in no particular order
Embedded Analytics Market Companies Covered in this Report
- Microsoft Corp.
- SAP SE
- IBM Corp.
- Oracle Corp.
- Salesforce (Tableau)
- SAS Institute Inc.
- TIBCO Software Inc.
- QlikTech International AB
- MicroStrategy Inc.
- Sisense Inc.
- Infor (Birst)
- Google Cloud (Looker)
- ThoughtSpot Inc.
- Domo Inc.
- Zoho Analytics
- GoodData Corp.
- Yellowfin BI
- Sigma Computing
- Exago Inc.

Market Opportunities and Future Outlook
One opportunity is the shift from embedded dashboards toward conversational and agentic interfaces inside operational applications, reducing reliance on specialized BI users and improving in-context decisioning. Google Cloud made the Looker Embedded Conversational Analytics API generally available in April 2026, enabling multi-turn natural-language interactions powered by Gemini within third-party applications. This creates whitespace for ISVs to package analytics as a core product capability rather than as a separate reporting module. As vendors add conversational layers, demand grows for governed semantic models that translate business terms into consistent metrics across tenants, which also aligns with regulated-industry requirements for traceability and control.
A second opportunity centers on regulated and sovereignty-sensitive deployments that combine cloud elasticity with local controls, particularly in BFSI and healthcare where embedded analytics is used for risk, compliance, and revenue integrity workflows. The market context in this report shows on-premise still accounts for a substantial share of spending (40.90% in 2025) even as cloud leads, indicating room for hybrid architectures, policy-based access, and auditable in-application workflows that address data-residency constraints. Implementations that standardize authentication and tenant-context propagation, commonly using OIDC and JWT-based approaches, also support product-led expansion by making it easier to embed analytics across multiple application surfaces without degrading performance or security posture.
Recent Industry Developments in Embedded Analytics Market
- July 2026: Actian announced the acquisition of Jaspersoft, adding embedded analytics and reporting capabilities to Actian's data management portfolio. The deal strengthens Actian's ability to offer application-embedded reporting alongside data integration and governance tooling, supporting vendors that want to ship analytics as part of their software products.
- June 2026: Microsoft announced the general availability of Fabric IQ, a shared context layer for AI agents and real-time experiences across Microsoft Fabric surfaces including Power BI. By standardizing context for agentic interactions, Fabric IQ supports more consistent embedded analytics experiences across applications that rely on common governance and semantic understanding.
- June 2024: MicroStrategy released MicroStrategy ONE, positioned to let enterprises layer AI-driven data insights directly into web and mobile applications using a no-code approach. The release reinforced competitive emphasis on embedded delivery and AI-assisted experiences, helping product teams deploy analytics without forcing end users into separate BI tools.


Embedded Analytics Market Report Scope and Research Methodology
Market Definition and Coverage
The embedded analytics market covers analytics and reporting capabilities built into a host business application, so end users can view dashboards, run reports, and analyze data without leaving the primary workflow.
Scope exclusions: We exclude standalone analytics tools that are not embedded into another software product, along with generic IT hardware spending that is not directly tied to embedded analytics value.
Segments Covered in This Report
- By Solution
- Software
- Service
- By Size of Organization
- Small and Medium Enterprises
- Large Enterprises
- By Deployment
- Cloud
- On-Premise
- By End-User Vertical
- BFSI
- IT and Telecommunication
- Healthcare
- Retail and E-Commerce
- Manufacturing
- Energy and Utilities
- Transportation and Logistics
- By Integration Mode
- On-Dashboard/Embedded Charts
- In-Application/Workflow
- On-Portal and Web Embedding
- By Business Function
- Finance and Accounting
- Sales and Marketing
- Operations and Supply Chain
- Human Resources
- By Analytics Type
- Descriptive Analytics
- Diagnostic Analytics
- Predictive Analytics
- Prescriptive Analytics
- By Geography
- North America
- United States
- Canada
- Mexico
- South America
- Brazil
- Argentina
- Chile
- Peru
- Rest of South America
- Europe
- Germany
- United Kingdom
- France
- Italy
- Spain
- Rest of Europe
- Asia-Pacific
- China
- Japan
- South Korea
- India
- Australia
- New Zealand
- Rest of Asia-Pacific
- Middle East
- United Arab Emirates
- Saudi Arabia
- Turkey
- Rest of Middle East
- Africa
- South Africa
- Rest of Africa
- North America
Data Sources, Market Sizing, and Validation
Desk Research
Desk work starts with lining up what "embedded" means in day-to-day buying, then building a clean view of demand signals across industries. We use public materials such as US Census and BEA digital economy data, the US Bureau of Labor Statistics on software and data roles, OECD ICT indicators, and ISO or NIST guidance that shapes data governance and security expectations. We also review software company filings, annual reports, investor decks, product documentation, and reputable press coverage to understand packaging patterns and pricing direction.
To reduce gaps in private company visibility, we also reference paid subscriptions for company financials and intelligence, news and financials, patent databases, and global contracts and tenders where embedded analytics is clearly called out in project scopes. These sources help confirm timing of platform rollouts and typical deal structures, and then we carry those notes into interview guides. The desk sources listed above are illustrative only, and many other public documents were also reviewed for data collection, validation, and clarification.
Primary Interviews and Surveys
Primary work is used to pressure test the scope, check real pricing mechanics, and validate adoption timing across cloud and on-premises deployments. We speak with a mix of embedded analytics product owners, application providers, systems integrators, and enterprise buyers across major regions, and we reconcile differences in what respondents count as embedded versus sold as a separate analytics add-on.
Distribution of primary research fieldwork respondents
| Company type | Respondent position | Region |
|---|---|---|
| Top tier: 39% | CXOs: 13% | APAC: 44% |
| Mid tier: 45% | Functional/Unit leaders: 30% | EMEA: 31% |
| Smaller Players: 16% | Managers: 57% | Americas: 25% |
Market-Sizing & Forecasting
The core sizing model uses a top-down approach where software and IT spend signals are translated into an addressable embedded analytics demand pool by applying adoption and attach-rate assumptions across key application categories. The totals are then corroborated using selective bottom-up approximations, such as sampled average selling price ranges by deployment, partner channel checks, and vendor revenue disclosure cues, which are used to adjust for double counting and under-coverage.
Inputs are chosen because they can be explained and refreshed without relying on hidden data. The model is shaped by cloud versus on-premises mix, typical per-user or per-application pricing behavior, the share of analytics sold as an OEM or embedded bundle, implementation and support intensity by vertical, and buyer adoption timing tied to modernization cycles. When interview feedback shows gaps in the desk view (for example, how analytics is packaged inside ERP, CRM, or industry apps), we apply correction factors to avoid overstating pure embedded value.
For forecasting, scenario analysis is used because embedded analytics growth is strongly influenced by platform bundling decisions and enterprise budget cycles that can shift quickly. We set a base case using consensus expectations from primary respondents on adoption pace, price progression, and cloud migration, then we run conservative and aggressive cases by varying attach rates, services intensity, and currency assumptions.
Data Validation & Update Cycle
Validation is done through triangulation across independent signals, and outputs are checked for variance by region, deployment mix, and vertical spending patterns. If a segment shows an unexpected jump or drop, we re-check the driver inputs, review the underlying source trail, and re-contact select experts to confirm whether a real market event occurred or whether an assumption drifted.
Before sign-off, the model and narrative go through multi-step analyst reviews so that definitions, units, and year conversions stay consistent. Reports are refreshed annually, and interim updates are triggered when material events occur, such as major product bundling shifts, large platform launches, or sharp changes in enterprise software spending. Right before delivery, a final pass is completed so clients receive the most current view available.
Mordor Intelligence's Embedded Analytics Market Size Measured Against Other Published Estimates
Published market sizes for embedded analytics often vary because firms do not always count the same things, even when the market name looks identical. Differences usually come from how embedded functionality is separated from standalone analytics, whether services are included, and what year and currency timing are used.
The main gap comes from whether the estimate includes broad business intelligence platform revenue and adjacent standalone analytics tools, where Mordor Intelligence counts value only when analytics is delivered as embedded functionality inside a host application and then validated through deployment mix and packaging checks.
Benchmark comparison
| Source | Market Size | Gaps in Research Methodology |
|---|---|---|
| Mordor Intelligence | USD 78.53 B (2025) | |
| Global Consultancy A | USD 61.97 B (2024) | Uses an earlier year and appears to blend embedded analytics with broader analytics platform spend, which can pull in standalone BI subscriptions and inflate or shift the total depending on vendor mapping. |
| Industry Publisher B | USD 22.93 B (2025) | Applies a narrower definition that leans toward core embedded software revenue and may exclude a large share of services and partner-led implementation work that buyers commonly purchase alongside embedded deployments. |
The spread across published figures is mainly explained by what gets included as embedded versus adjacent analytics, plus timing choices such as the base year and currency conversions. By tying the totals to clear packaging rules, deployment mix, and buyer-validated attach rates, our estimate stays traceable to practical inputs that can be rechecked and updated without changing the goalposts each year.


Key Questions Answered in the Report
What is driving the rapid growth of the embedded analytics market?
Growth stems from the need to deliver real-time insight inside everyday applications, the maturation of cloud-native analytics engines, and a shift toward prescriptive AI features that speed decision-making at the point of action.
Which region leads the embedded analytics market and which is growing fastest?
North America leads with 36.50% revenue share in 2025, while Asia-Pacific is the fastest-growing at a 15.05% CAGR through 2031 as digital transformation investments accelerate.
How are low-code platforms influencing embedded analytics adoption?
Low-code tools paired with headless BI frameworks cut development time, letting teams embed custom analytics in weeks instead of months and boosting productivity by up to 40%.
Why is healthcare the fastest-growing vertical for embedded analytics?
Value-based reimbursement models and digitised clinical workflows require bedside insight; embedded analytics improves outcome tracking and revenue integrity, supporting a 15.25% CAGR in healthcare.
What deployment model is preferred for regulated industries?
Hybrid models that combine on-premise data processing with cloud-based visualisation let organisations meet data-sovereignty rules while still gaining scalability benefits.
How will prescriptive analytics shape future embedded solutions?
Prescriptive engines that recommend optimal actions are set to expand at 19.55% CAGR, turning embedded analytics from retrospective reporting into forward-looking decision engines that automate next-best steps.
How large is the Embedded Analytics management market in 2026?
The Embedded Analytics Market size is projected to expand from USD 78.53 billion in 2025 and USD 89.25 billion in 2026 to USD 169.18 billion by 2031, registering a CAGR of 13.65% between 2026 to 2031.
Page last updated on:


