Embedded Finance Market Size and Share
Market Overview
| Study Period | 2020 - 2031 |
|---|---|
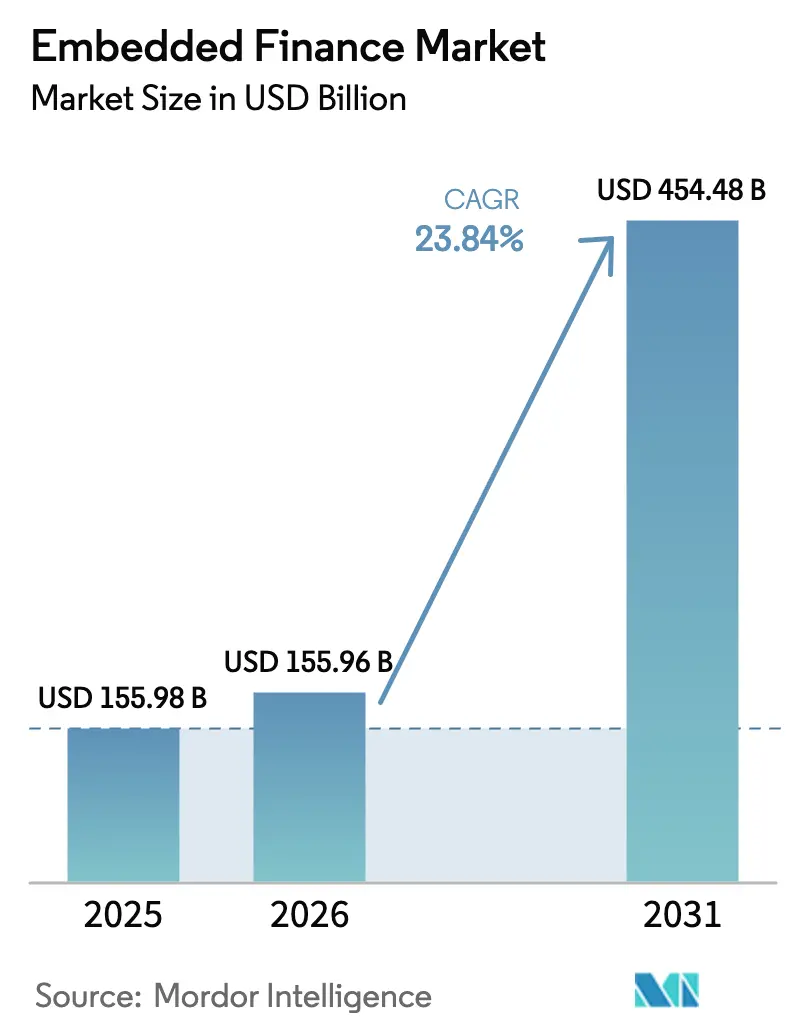
| Market Size (2026) | USD 155.96 Billion |
| Market Size (2031) | USD 454.48 Billion |
| Growth Rate (2026 - 2031) | 23.84% CAGR |
| Fastest Growing Market | Asia Pacific |
| Largest Market | North America |
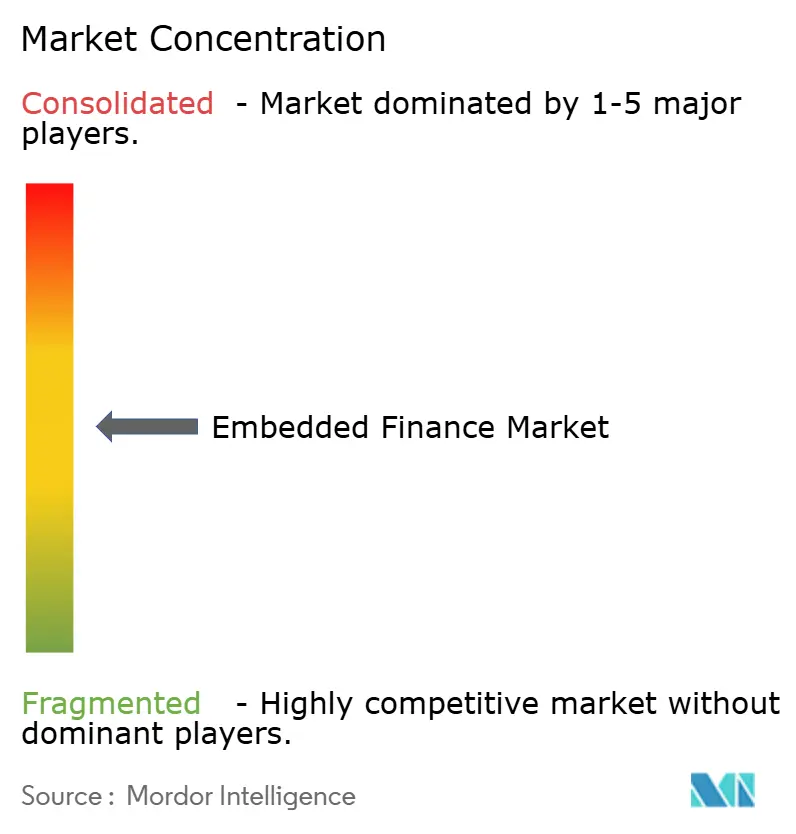
| Market Concentration | Medium |
Major Players *Disclaimer: Major Players sorted in no particular order Image © Mordor Intelligence. Reuse requires attribution under CC BY 4.0. | |
Embedded Finance Market Analysis by Mordor Intelligence
The Embedded Finance Market size is expected to increase from USD 155.98 billion in 2025 to USD 155.96 billion in 2026 and reach USD 454.48 billion by 2031, growing at a CAGR of 23.84% over 2026-2031.
Demand is propelled by merchants and software vendors seeking to keep customers inside their digital journeys, rapid Banking-as-a-Service (BaaS) roll-outs, and open-banking mandates that standardize data sharing. Integration of payment, lending, and investment functionality generates new revenue streams for platforms while simultaneously reducing acquisition costs for regulated financial institutions. North America presently drives adoption thanks to mature fintech rails, whereas Asia-Pacific’s mobile-first ecosystems support the fastest expansion. Competitive dynamics remain dispersed across banks, fintech infrastructure providers, and software platforms; tighter supervisory guidance for BaaS arrangements and rising compliance costs are expected to trigger selective consolidation.
Key Report Takeaways
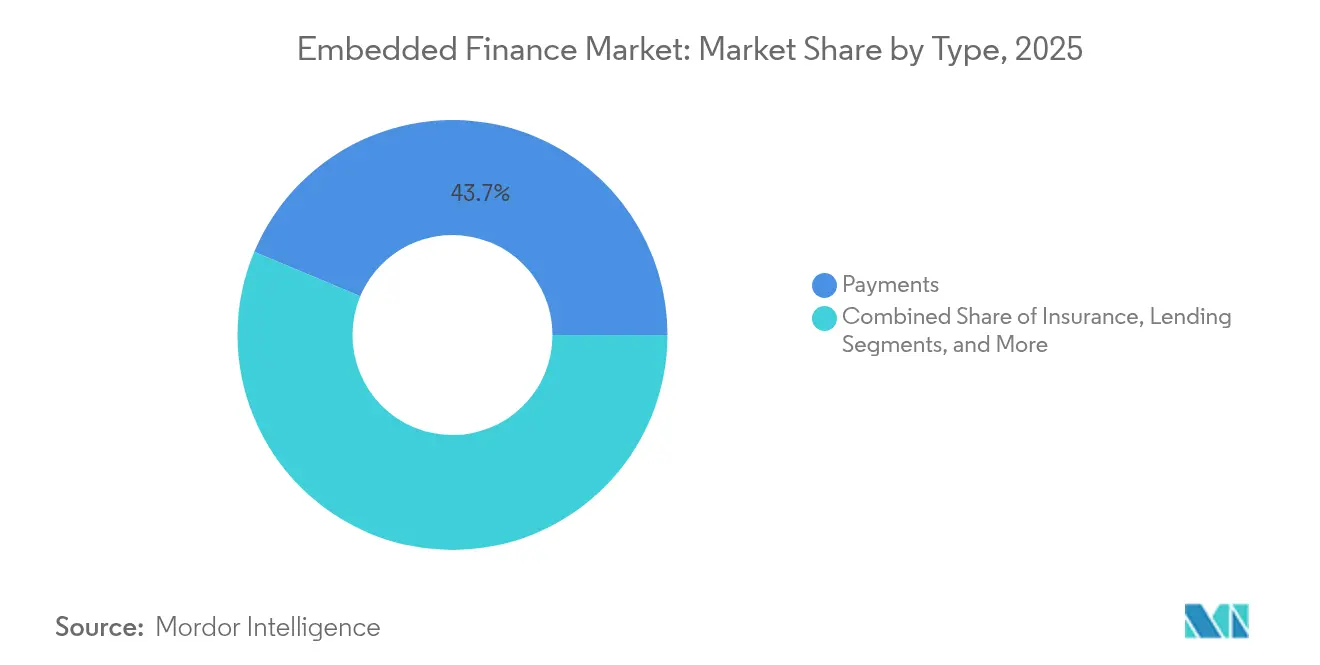
- By service type, payments led with 43.68% of embedded finance market share in 2025, while the investments category is projected to grow at a 27.66% CAGR to 2031.
- By end-use industry, retail and e-commerce captured 36.05% share of the embedded finance market in 2025; the healthcare and pharmaceuticals segment is advancing at a 26.12% CAGR through 2031.
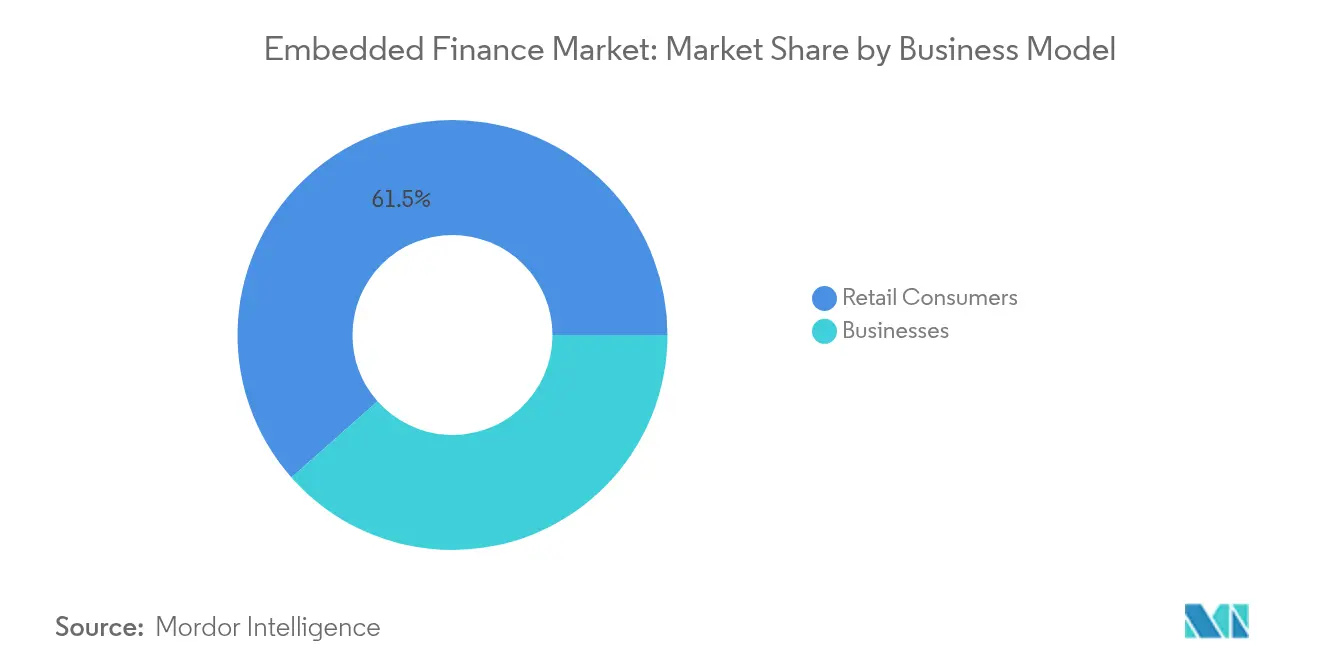
- By business model, the consumer segment retained 61.52% share of the embedded finance market size in 2025; enterprise-focused propositions are expected to post a 26.25% CAGR between 2026-2031.
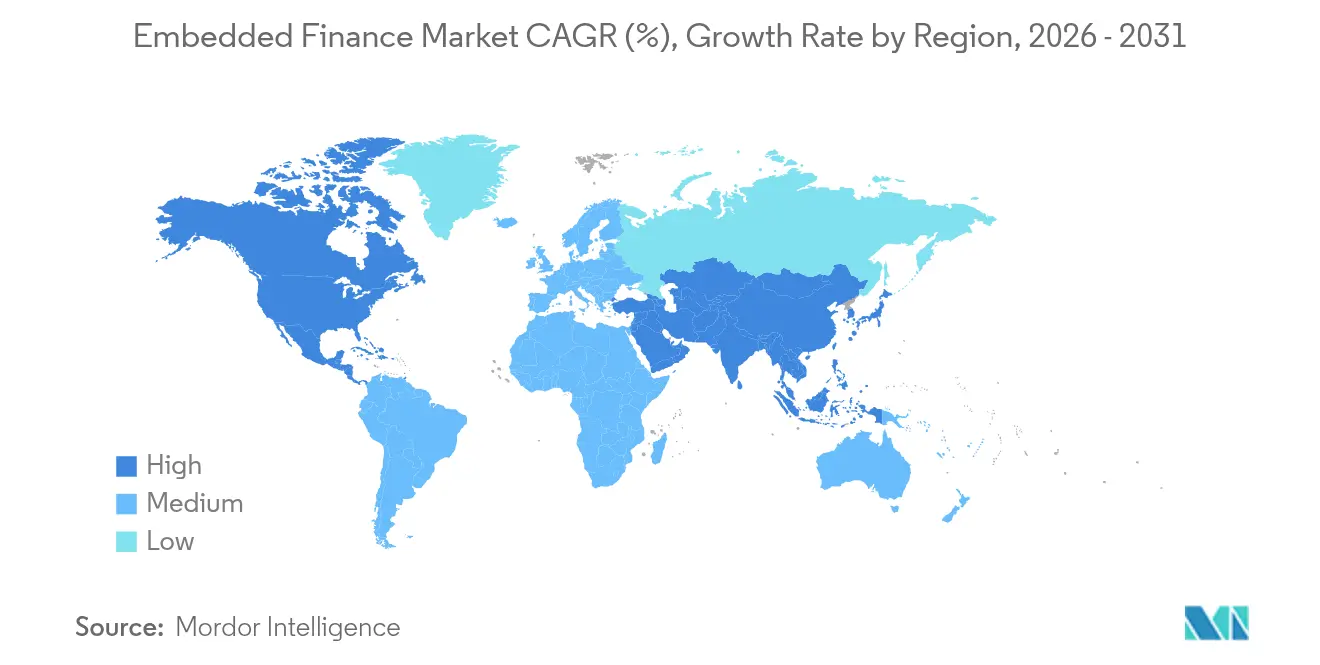
- By region, North America commanded a 39.10% share in the embedded finance market in 2025, while Asia-Pacific is expanding at a 25.72% CAGR to 2031.
Note: Market size and forecast figures in this report are generated using Mordor Intelligence’s proprietary estimation framework, updated with the latest available data and insights as of 2026.
Global Embedded Finance Market Trends and Insights
Drivers Impact Analysis*
| Driver | (~) % Impact on CAGR Forecast | Geographic Relevance | Impact Timeline |
|---|---|---|---|
| Friction-free customer experience in e-commerce & SaaS | +6.2% | Global (North America, Europe lead) | Short term (≤ 2 years) |
| Digital transformation of financial services | +5.8% | Global | Medium term (2-4 years) |
| API/BaaS proliferation | +4.9% | North America, Europe, Asia-Pacific core | Medium term (2-4 years) |
| Vertical SaaS adoption enabling embedded B2B finance | +3.7% | North America & Europe, spill-over to Asia-Pacific | Long term (≥ 4 years) |
| Open-banking mandates in emerging markets | +2.1% | Asia-Pacific core, Latin America, MEA | Long term (≥ 4 years) |
| Inclusion of under-banked micro-merchants | +1.6% | Global, concentrated in emerging markets | Long term (≥ 4 years) |
| Source: Mordor Intelligence | |||
Friction-free CX in E-commerce & SaaS
Seamless user journeys now benchmark retail and software experiences, and embedded payments or lending reduce checkout abandonment while adding platform revenue. E-commerce marketplaces integrating point-of-sale credit consistently report mid-teen conversion uplifts, while SaaS vendors monetize 10-25% of additional income from payments layered onto subscriptions. Buy-now-pay-later (BNPL) plug-ins illustrate this pattern; global partnerships between large BNPL specialists and ride-sharing or commerce APIs allow instant credit decisions without redirecting customers. Similar contextual delivery is appearing in insurance, micro-investing, and deposit products, indicating a broad shift toward invisible finance.
Digital Transformation of Financial Services
Banks are rebuilding core systems around open APIs so they can distribute products within third-party channels while retaining oversight. Institutions that embed accounts or cards inside marketplaces see roughly 30% improvements in new-to-bank volumes, validating the distribution upside [1]Federal Reserve Board, “Inter-agency Guidance on Bank-Fintech Partnerships,” federalreserve.gov. Cloud-native cores, automation, and real-time compliance monitoring are becoming prerequisites as regulators scrutinize data flows shared with software partners. As a result, more than two-fifths of large banks now rely on specialist fintech integrators to orchestrate embedded roll-outs.
API/BaaS Proliferation
Leading BaaS operators already process more than USD 1 trillion in annual payments via modular APIs. Standardized interfaces compress integration timelines from years to weeks and lower the technical threshold for non-financial brands. Yet federal agencies have released detailed guidelines that require banks to bolster oversight of their fintech partners, prompting larger, well-capitalized providers to pull ahead [2]Federal Deposit Insurance Corporation, “Conducting Business With Banks: Third-Party Relationships,” fdic.gov. The market is therefore moving toward fewer but stronger facilitators that combine scale, compliance, and product breadth.
Vertical SaaS Adoption Enabling Embedded B2B Financial Services
Industry-specific SaaS platforms increasingly bundle payments, working-capital loans, and treasury tools to deepen user stickiness. Independent software vendors (ISVs) now originate an estimated 40-65% of new SMB payment contracts in North America. European SaaS players are embracing the model, though still lag two-plus years behind US peers on revenue capture. The strategy delivers recurring payment income and allows finely-tuned credit products aligned with unique industry cash-flow cycles.
Restraints Impact Analysis*
| Restraint | (~) % Impact on CAGR Forecast | Geographic Relevance | Impact Timeline |
|---|---|---|---|
| Data privacy & security concerns | -3.4% | Global (EU GDPR most stringent) | Short term (≤ 2 years) |
| Partnership & integration complexity | -2.8% | Global | Medium term (2-4 years) |
| Regulatory tightening of BaaS providers | -2.1% | North America, Europe | Short term (≤ 2 years) |
| Capital & liquidity constraints for non-bank embedded lenders | -1.9% | Global, concentrated in emerging markets | Medium term (2-4 years) |
| Source: Mordor Intelligence | |||
Data Privacy & Security Concerns
GDPR, CCPA, and similar laws impose strict requirements on the handling of personal and transaction data. Over 60% of fintechs embedding finance into third-party apps have incurred compliance penalties exceeding USD 250,000 for inadequate monitoring [3]Consumer Financial Protection Bureau, “Supervisory Highlights on Digital Payments,” consumerfinance.gov. Regulators such as the Consumer Financial Protection Bureau have broadened supervisory scope to include large non-bank payment providers processing more than 50 million transactions annually. Financial data now traverses multiple environments, raising the bar for encryption, tokenization, and real-time anomaly detection. Elevated compliance costs and reputational risk can delay deployments, particularly for smaller brands.
Partnership & Integration Complexity
Embedding finance routinely involves banks, BaaS platforms, and front-end software vendors, each subject to distinct regulatory duties. Integration schedules frequently stretch six to twelve months beyond initial estimates as contracts, liability frameworks, and technical dependencies multiply. New guidance obliges chartered banks to run continuous risk assessments on fintech partners, reinforcing the need for stronger governance. Mid-sized enterprises without deep fintech teams often struggle with fragmented API stacks, accumulating technical debt that inflates future maintenance.
*Our forecasts treat driver/restraint impacts as directional, not additive. The impact forecasts reflect baseline growth, mix effects, and variable interactions.
Segment Analysis
By Type: Payments Dominate While Investments Accelerate
Payments accounted for 43.68% of the embedded finance market share in 2025, underscoring the entrenched position of integrated checkout, in-app wallets, and card-on-file solutions. Growth is propelled by retailers and SaaS vendors replacing legacy gateways with native options that capture interchange, fraud-risk margins, and data insights. Robo-advisory widgets and fractional investing features are propelling the investments segment, which is forecasted to compound at a 27.66% CAGR through 2031. AI-driven portfolio rebalancing and goal-based nudges embedded directly inside consumer super-apps have drawn billions in new assets. Lending maintains strong uptake via BNPL extensions at checkout and working-capital advances for merchants, while contextual insurance—such as device or trip coverage—is gaining familiarity.
Momentum in payments should remain robust as orchestration layers add domestic switch routing, network tokenization, and faster-payment rails. However, a steeper growth curve is expected for investment tools because of cross-sell opportunities with high-frequency trading communities and increased retail interest in passive asset allocation. Treasury-management microservices for vertical SaaS platforms could represent the next adjacency, addressing liquidity and escrow requirements inside B2B workflows.


By End-Use Industry: Retail Leads as Healthcare Transforms
Retail and e-commerce retained a 36.05% share in the embedded finance market in 2025, benefitting from pervasive card-on-file wallets, one-click checkout, and instalment lending. The segment’s leadership stems from established consumer familiarity and the clear ROI of higher conversion rates for merchants. The healthcare and pharmaceuticals segment is the fastest-growing vertical at a 26.12% CAGR, as providers embed patient-financing, real-time eligibility checks, and bundled insurance into telehealth portals. Rising out-of-pocket costs drive demand for flexible payment plans, while insurers and hospital systems see embedded finance as a mechanism to cut billing friction and improve collections. IT and telecom firms monetize usage-based billing and device-protection offers, whereas manufacturing companies are layering invoice financing and supply-chain credit into procurement portals to alleviate working-capital constraints.
The healthcare sector’s potential is amplified by digital-first clinics that integrate wallet-funded micro-savings programs for preventive care. Travel and hospitality operators similarly embed trip-based insurance and deferred payments, supporting revenue diversification. Agriculture, education, and professional services remain nascent but show signs of uptake as compliance frameworks mature and sector-specific SaaS penetration rises.
By Business Model: Consumer Focus Shifts Toward Enterprise
Consumer-oriented propositions commanded 61.52% of the embedded finance market size, driven by established BNPL, personal-budgeting, and embedded card products. Yet enterprise use cases are set to outpace consumer growth, expanding at a 26.25% CAGR through 2031. B2B platforms demand multi-party disbursements, automated reconciliation, and foreign-exchange hedging modules, capabilities now offered as micro-services by leading BaaS providers. Large marketplaces running seller ecosystems embed treasury accounts, instant payouts, and receivables financing to increase retention.
Enterprise take-up is further encouraged by corporates seeking cost optimization through integrated cash-flow analytics. Marketplace operators that streamline working-capital access observe higher seller lifetime value and lower churn. Fintech infrastructure players are, therefore, prioritizing ISO 20022 messaging, enterprise-grade service-level agreements, and SOC 2 certification to serve complex business environments.
Geography Analysis
North America held 39.10% of the embedded finance market share in 2025, leveraging a mature fintech workforce, venture capital depth, and supportive regulatory sandbox initiatives. Banks and processors headquartered in the United States pioneered BaaS models that later spread globally. However, enhanced guidance from the Federal Reserve and the Office of the Comptroller of the Currency now mandates stricter oversight of bank-fintech partnerships, which may temper near-term launch volumes while ultimately strengthening consumer safeguards.
Asia-Pacific is the fastest-growing geography in the embedded finance market, projected to record a 25.72% CAGR to 2031. Super-apps and QR-code payment schemes already dominate retail payments in China, India, Indonesia, and the Philippines, allowing new financial products to piggyback on existing wallets. In Southeast Asia, embedded finance accounted for over USD 4.3 billion of disclosed fintech funding during 2024. Low physical-branch density and mobile-centric behaviors enable leapfrog adoption of investment micro-services and merchant-lending engines. Policymakers in India and Singapore actively promote account-to-account payment frameworks that cut interchange fees, boosting merchant incentives to integrate native checkout packages.
Europe represents a balanced but slower trajectory in the embedded finance market. PSD2 and upcoming PSD3 regulations guarantee API access to bank data, yet fragmented licensing and languages increase localization costs. The region’s embedded finance market is projected to witness significant growth by 2030, supported by numerous BaFin-registered open-banking institutions in Germany alone. The United Kingdom continues to incubate innovative credit-builder and salary-advance services fueled by open-banking data. Latin America sees momentum from Brazil’s PIX instant-payment infrastructure, which unlocks person-to-merchant and merchant-to-merchant flows for micro-SMBs. Meanwhile, Gulf Cooperation Council states cultivate fintech sandboxes aimed at diversifying oil-dependent economies, and embedded finance platforms like Tabby illustrate rising BNPL penetration in the region.
Mordor Intelligence provides coverage of the embedded finance market across other key regional markets. Detailed country-level analysis extends to United States incorporating local coverage and market participation, as required.

Competitive Landscape
Competition is layered rather than head-to-head in the embedded finance market. Card networks, acquirers, and processor giants such as Stripe, Adyen, PayPal, and Block dominate global payment acceptance. BaaS specialists—including Synctera, Solaris, and Railsr—supply charter access, ledger, Know-Your-Customer (KYC), and compliance tooling. Vertical SaaS providers, notably Shopify and Toast, focus on embedding first-party gateways to monetize transaction volume. Traditional banks pursue “embedded‐bank” models, renting licenses and balance-sheet capacity while retaining deposit relationships.
Technology is an increasingly decisive moat. AI-based fraud mitigation, real-time credit adjudication, and adaptive checkout flows deliver measurable uplifts. Stripe’s Optimised Checkout Suite, which pairs network tokenization with ML-driven dynamic retry logic, has boosted merchant revenue by an average of 11.9%. Similarly, leading BNPL firms marry underwriting models with robust merchant networks to improve approval rates without elevating losses. Compliance know-how is equally critical: BaaS providers that pre-package Bank Secrecy Act tools and transaction-monitoring dashboards reduce the burden on brand partners.
Capital pressures and new supervisory frameworks could accelerate consolidation in the embedded finance market, particularly across under-capitalized platform banks and regional BaaS players. Larger processors may pursue acquisitions to obtain licenses or specialized vertical expertise. Conversely, niche insurance and investment-API vendors are expected to thrive by addressing focused use cases with high margin potential. The net result is likely to be a moderately concentrated landscape anchored by a handful of full-stack platforms and numerous specialized micro-service vendors.
Embedded Finance Industry Leaders
Stripe
PayPal
Adyen
Block (Square)
Shopify
- *Disclaimer: Major Players sorted in no particular order

Recent Industry Developments
- June 2025: FISPAN raised USD 30 million in Series B funding led by Canapi Ventures to accelerate embedded banking innovation for mid-market businesses.
- June 2025: OnePay and Synchrony unveiled a new credit-card programme with Walmart, fully integrated into the OnePay app.
- April 2025: Fiserv and Klarna partnered to enable instalment credit on Clover POS devices, marking Klarna’s first nationwide in-store play.
- March 2025: JPMorgan Chase and Walmart launched an embedded finance solution for marketplace sellers, offering integrated payments, lending, and cash management.


Research Methodology Framework and Report Scope
Market Definitions and Key Coverage
Our study views the embedded finance market as the gross revenue earned when non-financial platforms weave payments, lending, insurance, investment, or banking rails into their native user journeys through application-programming interfaces and Banking-as-a-Service partnerships.
Scope exclusion: We exclude pure-play fintech apps that operate as stand-alone wallets or neobanks without third-party embedding.
Segmentation Overview
- By Type
- Payments
- Insurance
- Lending
- Investments
- Other Service Types
- By End-Use Industry
- IT & Telecommunication
- Manufacturing
- Retail And E-Commerce
- Healthcare And Pharmaceuticals
- Travel & Hospitality
- Transportation & Logistics
- Other Industry Verticals
- By Business Model
- Retail Consumers
- Businesses
- By Region
- North America
- United States
- Canada
- Mexico
- South America
- Brazil
- Argentina
- Chile
- Colombia
- Rest of South America
- Europe
- United Kingdom
- Germany
- France
- Spain
- Italy
- Benelux (Belgium, Netherlands, and Luxembourg)
- Nordics (Sweden, Norway, Denmark, Finland, and Iceland)
- Rest of Europe
- Asia-Pacific
- China
- India
- Japan
- South Korea
- Australia
- South-East Asia (Singapore, Indonesia, Malaysia, Thailand, Vietnam, and Philippines)
- Rest of Asia-Pacific
- Middle East and Africa
- United Arab Emirates
- Saudi Arabia
- South Africa
- Nigeria
- Rest of Middle East and Africa
- North America
Detailed Research Methodology and Data Validation
Primary Research
Our analysts interviewed product heads at vertical SaaS platforms, BaaS orchestrators, regional card networks, and policy specialists across North America, Europe, and Asia-Pacific to validate fee corridors, penetration ratios, and year-one ramp curves. These conversations closed data gaps and confirmed early signals spotted in desk work.
Desk Research
We begin with public datasets from the BIS, World Bank Global Findex, and IMF Financial Access Survey, then layer in industry sales metrics from sources such as the National Retail Federation and EuroCommerce to anchor transaction pools. Company 10-Ks, investor decks, and patent filings help size take-rates and API call trends, while D&B Hoovers and Dow Jones Factiva provide audited financials and deal flows that sharpen our lens. Numerous additional public records and news feeds were reviewed beyond the sources named here.
A second sweep captures PSD2 and OCC guidance, open-banking sandbox statistics, and smart POS shipment records pulled via Volza, giving us regional adoption velocity and compliance cost benchmarks. This diverse desk stream frames realistic upper and lower bounds before we reach out to the market.
Market-Sizing & Forecasting
We build a top-down model that reconstructs gross platform revenue from digital commerce spending, instant-payment volumes, BNPL penetration, API price ladders, and average take-rates, and we sanity-check the totals through selective supplier roll-ups. Multivariate regression, informed by smartphone adoption and open-banking API traffic, generates the 2025-2030 trajectory. Bottom-up gaps such as under-reported marketplace flows are bridged with channel checks before final alignment.
Data Validation & Update Cycle
Our outputs run through variance thresholds, peer review, and a final analyst sign-off. Models refresh annually, with interim revisions triggered by material regulatory or macro events so clients always receive the latest view.
Why Mordor's Embedded Finance Baseline Commands Unmatched Reliability
We acknowledge that published estimates often diverge because firms choose different service mixes, estimate fees in varied ways, or freeze exchange rates months in advance. According to Mordor analysts, disciplined scope setting and a yearly refresh narrow those gaps.
Key gap drivers are other studies' omission of investment APIs, shorter region lists, and linear ASP assumptions, whereas Mordor Intelligence factors in evolving interchange caps and cross-border surcharges.
Benchmark comparison
| Market Size | Anonymized source | Primary gap driver |
|---|---|---|
| USD 125.95 B (2025) | Mordor Intelligence | - |
| USD 115.8 B (2024) | Global Consultancy A | Excludes investment APIs and Latin America |
| USD 107.27 B (2024) | Industry Association B | Uses flat take-rate; limited primary checks |
| USD 99.6 B (2023) | Trade Journal C | Counts booked revenue only; older currency basis |
These comparisons show that Mordor's disciplined variable set, transparent assumptions, and frequent refresh create a dependable baseline that decision-makers can trace back to clear, repeatable steps.


Key Questions Answered in the Report
How fast is the embedded finance market expected to grow?
The embedded finance market is forecasted to expand from USD 155.96 billion in 2026 to USD 454.48 billion in 2031, delivering a 23.84% CAGR over 2026-2031.
Which service type currently dominates embedded finance?
Payments led with 43.68% of embedded finance market share in 2025, owing to widespread integration of native checkout, in-app wallets, and card-issuing capabilities.
Why is Asia-Pacific forecast to be the fastest-growing region?
Mobile-first consumer behavior, super-app ecosystems, and regulatory programs such as India’s UPI and Singapore’s PayNow drive adoption, supporting a 25.72% CAGR to 2031.
What are the primary challenges for companies embedding finance?
Data-privacy compliance, integration complexity across multiple partners, and increasing regulatory oversight of BaaS arrangements are the main headwinds.
Which industries beyond retail are poised for high growth?
Healthcare is predicted to grow at a 26.12% CAGR as providers incorporate patient-financing, embedded insurance, and real-time eligibility checks into digital health platforms.
How does embedded finance benefit B2B platforms?
B2B marketplaces that integrate payments, lending, and treasury tools improve seller retention and revenue while automating reconciliation and cash-flow analytics.
Page last updated on:


