Market Overview
| Study Period | 2020 - 2031 |
|---|---|
| Forecast Data Period | 2026 - 2031 |
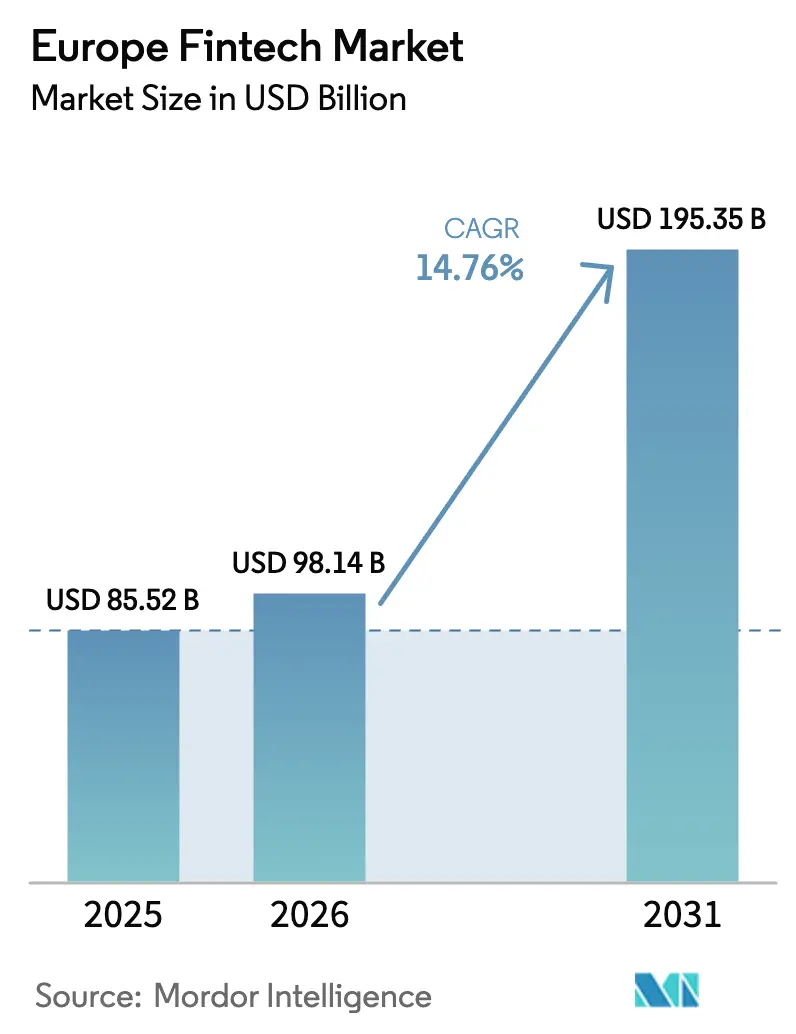
| Base Year Market Size (2025) | USD 85.52 Billion |
| Market Size (2026) | USD 98.14 Billion |
| Market Size (2031) | USD 195.35 Billion |
| Growth Rate (2026 - 2031) | 14.76% CAGR |
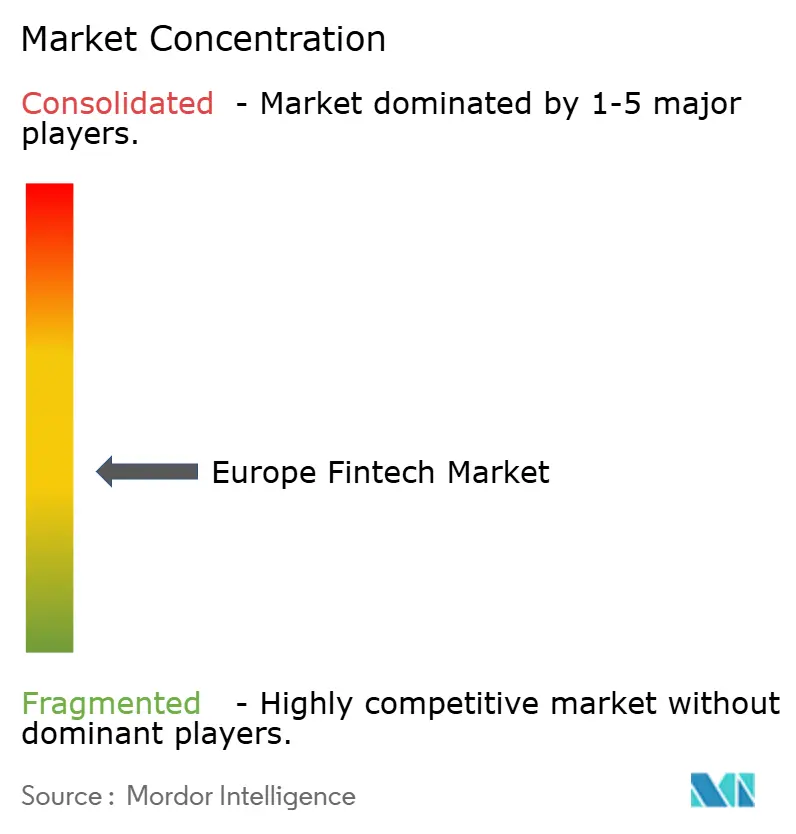
| Market Concentration | Medium |
Major Players *Disclaimer: Major Players sorted in no particular order Image © Mordor Intelligence. Reuse requires attribution under CC BY 4.0. | |
Europe Fintech Market Analysis by Mordor Intelligence
The Europe Fintech Market size is projected to expand from USD 85.52 billion in 2025 and USD 98.14 billion in 2026 to USD 195.35 billion by 2031, registering a CAGR of 14.76% between 2026 to 2031.
The European fintech market is growing rapidly due to a combination of regulatory reform, infrastructure modernization, and rising digital adoption across financial services. One of the primary drivers is the European Instant Payments Regulation, which promotes always-on account-to-account transactions and mandates verification of the payee, significantly improving payment speed, security, and consumer trust. This shift is reducing settlement times and enhancing liquidity management for businesses and consumers alike.
The market is further supported by strong momentum in embedded payments, as digital platforms increasingly integrate payment capabilities directly into their ecosystems. Payment infrastructure providers are benefiting from higher transaction volumes as merchants adopt omnichannel payment orchestration and real-time settlement solutions. Mobile-first consumer behavior continues to fuel fintech adoption, with biometrics, digital wallets, and card-on-file features reducing checkout friction and improving user experience. The rollout of the European Digital Identity Wallet is strengthening secure authentication across both public and private services, enabling safer digital financial interactions. Open banking initiatives are also expanding access to payment initiation and customer data, allowing fintech firms to develop more personalized and data-driven financial products.
Key Report Takeaways
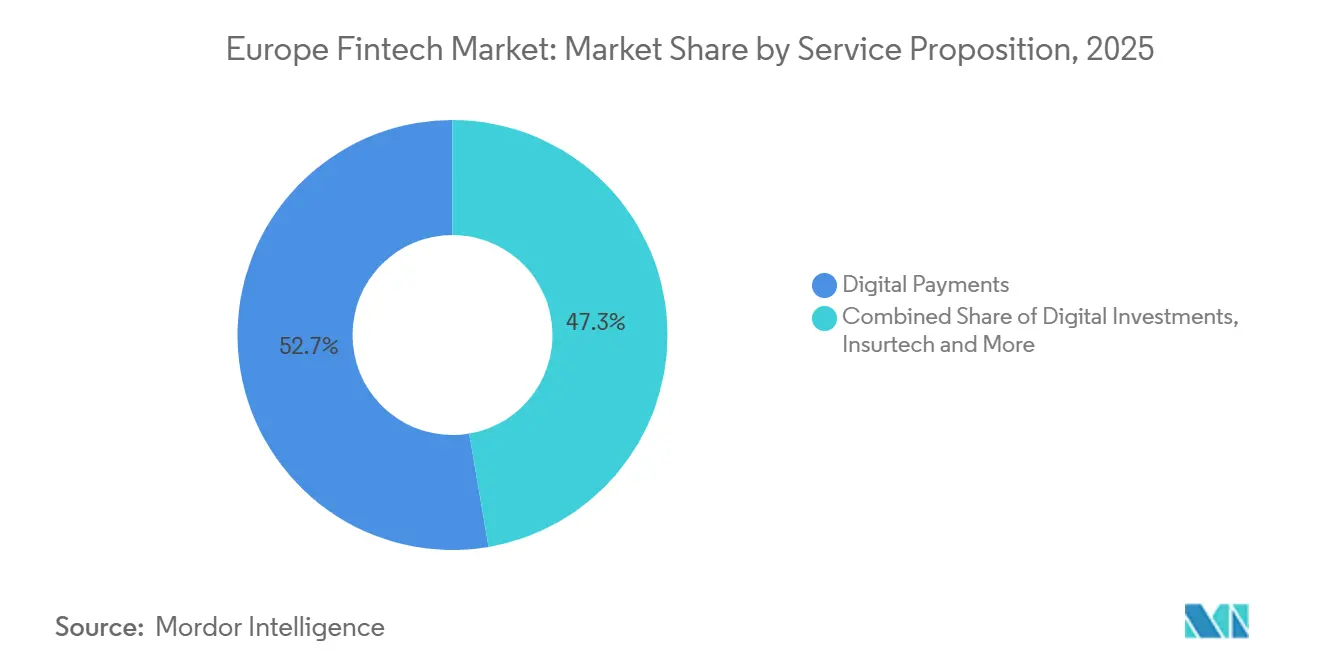
- By service proposition, digital payments led with 52.67% of the European fintech market share in 2025, while insurtech is forecasted to expand at a 16.58% CAGR through 2031.
- By end-user, the retail segment accounted for 67.82% of the European fintech market share in 2025, while businesses are projected to grow at a 15.77% CAGR through 2031.
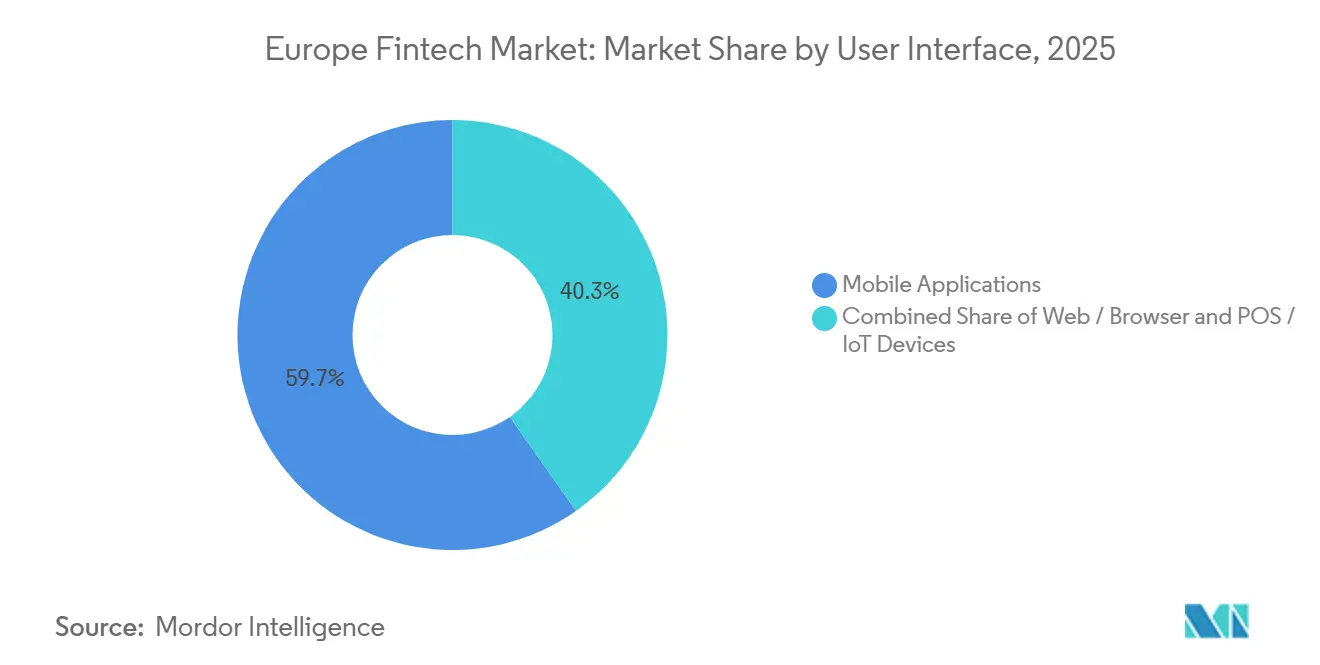
- By user interface, mobile applications commanded 59.73% of the European fintech market share in 2025 and are expected to post a 17.92% CAGR through 2031.
- By geography, the United Kingdom held 21.56% of the European fintech market share in 2025, while the Nordics are forecasted to grow at a 16.17% CAGR.
Note: Market size and forecast figures in this report are generated using Mordor Intelligence’s proprietary estimation framework, updated with the latest available data and insights as of January 2026.
Europe Fintech Market Trends and Insights
Drivers Impact Analysis*
| Drivers | (~) % Impact on CAGR Forecast | Geographic Relevance | Impact Timeline |
|---|---|---|---|
| Expansion of Account-to-Account Instant Payments Enabled by PSD2 and SEPA Infrastructure | +3.2% | Global (SEPA zone: 40 countries, including EU27, EFTA, United Kingdom, accession states) | Short term (≤2 years) |
| Acceleration of Embedded Payments Adoption Among European SMEs and Mid-Market Enterprises | +2.8% | Global, with early gains in the United Kingdom, the Netherlands, Germany, Nordics | Medium term (2-4 years) |
| Maturation of Open-Banking API Ecosystems Unlocking Data-Driven Revenue Streams | +2.5% | Global, strongest in the United Kingdom (13.3M users), France (537 TPPs), Germany (90+ PIs) | Medium term (2-4 years) |
| Rapid Uptake of Buy-Now-Pay-Later Solutions Across Regional E-commerce Channels | +2.1% | Europe-wide, concentrated in the Netherlands, the United Kingdom, Germany, Nordics | Short term (≤2 years) |
| European Central Bank Digital-Euro Pilots Catalysing Wallet and Digital Identity Investments | +1.8% | Eurozone core (19 countries), spillover to non-euro EEA by 2027-2029 | Long term (≥4 years) |
| Growth in Climate-Aligned Fintech Innovation Driven by EU Sustainable Finance Regulations | +1.4% | EU27 with extension to EEA; Germany, Netherlands, and France are early adopters | Long term (≥4 years) |
| Source: Mordor Intelligence | |||
Expansion of Account-to-Account Instant Payments Enabled by PSD2 and SEPA Infrastructure
The Instant Payments Regulation (IPR) adopted by the EU in 2024 is rapidly accelerating the deployment and uptake of instant account-to-account credit transfers in euros across Europe by mandating that providers of traditional euro credit transfers must also offer instant versions of those services. Under the regulation, instant payments must be available 24/7/365 and settled within seconds, narrowing the gap between payment initiation and final funds availability and fostering real-time transaction capabilities across banks and fintechs. PSPs (payment service providers) are required to ensure that instant payments are offered at no greater cost than standard credit transfers, helping to remove pricing barriers that previously discouraged adoption. The regulation also introduces a verification-of-payee (VoP) requirement, which alerts payers to mismatches between account identifiers and beneficiary names before execution, reducing fraud risk and strengthening trust in real-time account-to-account transfers. In addition, the regulation supports broader market participation by granting non-bank payment and e-money institutions access to core payment systems, widening the ecosystem of providers that can deliver instant payment services. By harmonizing access, pricing, and security standards across the Single Euro Payments Area (SEPA), the IPR significantly enhances the reliability, reach, and appeal of instant account-to-account payments, making real-time transactions an essential, scalable foundation for Europe’s evolving fintech landscape.[1]European Central Bank, “Instant Payments Regulation,” European Central Bank, ecb.europa.eu.
Acceleration of Embedded Payments Adoption Among European SMEs and Mid-Market Enterprises
The acceleration of embedded payments adoption among European SMEs and mid-market enterprises is a major driver of growth in the European fintech market, as reflected in Adyen’s H1 2025 performance. The company reported strong double-digit revenue growth, supported by increasing transaction volumes from platform businesses and mid-sized merchants that are embedding payments directly into their software and commerce ecosystems. Growth in Adyen’s platforms and issuing segments indicates rising demand for integrated payment acceptance, payouts, and card issuing capabilities that are delivered through a single, scalable infrastructure. European SMEs and mid-market enterprises are increasingly prioritizing embedded payments to reduce operational complexity, eliminate multiple vendor relationships, and improve speed to market. By integrating payments natively into enterprise resource planning systems, marketplaces, and SaaS platforms, these businesses can offer seamless checkout, faster settlement, and unified reporting across channels. Embedded payment models also support omnichannel strategies, allowing merchants to manage in-store, online, and mobile transactions through a single backend. As transaction volumes scale, payment infrastructure providers benefit from operating leverage, reinforcing investment in advanced fintech capabilities. This shift is particularly relevant in Europe, where fragmented markets and cross-border activity create demand for unified payment orchestration.[2]Adyen Investor Relations, “Shareholder Letter H1 2025,” Adyen, investors.adyen.com.
Maturation of Open-Banking API Ecosystems Unlocking Data-Driven Revenue Streams
The maturation of open-banking API ecosystems is a key driver of growth in the European fintech market, as banks move beyond regulatory compliance toward revenue-generating digital platforms. Under PSD2 and emerging open finance frameworks, banks are increasingly exposing standardized APIs for account data access, payment initiation, and financial services integration. These APIs enable fintechs and third-party developers to build data-driven applications that deliver personalized financial products and automated customer journeys. As ecosystems mature, banks are adopting API monetization models such as usage-based pricing, subscription tiers, and revenue-sharing arrangements. This shift is creating recurring, non-interest income streams from data access, analytics, and value-added services. Mature APIs also facilitate deeper partnerships between banks, fintechs, and digital platforms, expanding distribution channels and embedded finance use cases. Enhanced data availability supports advanced analytics, improving credit scoring, fraud detection, and customer insights.[3]Open Banking Limited, “Show Me the Money: Open Banking API Monetisation Models for Banks,” Open Banking Limited, openbanking.org.uk.
Rapid Uptake of Buy-Now-Pay-Later Solutions Across Regional E-Commerce Channels
The rapid uptake of buy-now-pay-later (BNPL) solutions across European e-commerce channels is a significant growth driver for the fintech market, supported by rising digital commerce activity and evolving regulatory clarity. Across the EU, BNPL adoption is expanding as consumers seek flexible, short-term financing options that integrate seamlessly into online and point-of-sale checkout experiences. Regulatory authorities are tightening conduct and creditworthiness standards, which is strengthening consumer protection while allowing the segment to scale within a formalized framework. The upcoming implementation of updated consumer credit rules is reinforcing affordability assessments and transparency, moving BNPL from unregulated growth toward sustainable, compliant expansion. Leading BNPL providers are leveraging AI-driven underwriting and risk analytics to improve approval accuracy, enhance on-time repayment rates, and reduce delinquencies. At the same time, providers are broadening merchant networks and diversifying product offerings to reach a wider consumer base. Partnerships with payment service providers are helping BNPL platforms optimize checkout flows and conversion rates without compromising risk controls.
Restraints Impact Analysis*
| Restraints | (~) % Impact on CAGR Forecast | Geographic Relevance | Impact Timeline |
|---|---|---|---|
| Prolonged venture capital slowdown is creating funding gaps for scale-ups | -2.8% | Europe-wide, with uneven recovery across major hubs | Short term (≤2 years) |
| Fragmented national licensing regimes are hindering cross-border expansion | -2.1% | EU27, United Kingdom, EEA with persistent localization and IBAN discrimination frictions | Medium term (2-4 years) |
| Rising compliance and operational costs from expanding EU financial regulations | -1.9% | EU27 and EEA, with a higher burden on SMEs and early-stage fintechs | Medium term (2-4 years) |
| Increasing competition from incumbent banks and Big Tech platforms is compressing fintech margins | -1.6% | Europe-wide, strongest in mature markets (Germany, France, Nordics, United Kingdom) | Medium to long term (3-5 years) |
| Source: Mordor Intelligence | |||
Prolonged Venture Capital Slowdown Creating Funding Gaps for Scale-Ups
Prolonged weakness in venture capital funding remains a key restraint for the European fintech market, particularly for scale-ups and early-stage firms. In 2025, investor appetite became increasingly selective, with capital concentrated on proven, later-stage business models and stronger revenue visibility. This shift has extended fundraising timelines and raised expectations around profitability, unit economics, and operating discipline. Recovery in fintech investment is uneven across Europe, as major hubs continue to attract funding while smaller or emerging markets face reduced deal activity. Elevated interest rates and global policy uncertainty have further reinforced investor preference for lower burn rates and sustainable growth strategies. As a result, fintechs without diversified revenue streams or clear paths to cash generation face constrained access to expansion capital.
Fragmented National Licensing Regimes Hindering Cross-Border Expansion
Fragmented national licensing regimes continue to restrain cross-border expansion for European fintechs. Fintechs face inconsistent authorization pathways, differing AML and compliance requirements, and technical divergences such as PSD2 API performance, which increase compliance costs and extend time-to-market for firms scaling internationally. Persistent IBAN discrimination, despite SEPA regulations, creates additional friction for consumers and complicates cross-border payments. Maintaining local licenses and branches often requires significant ongoing expenditure on risk management, AML, and data governance, diverting resources from innovation and customer acquisition. Divergent PSD2 API performance and support practices across countries further exacerbate operational challenges, as uptime, error handling, and incident resolution vary widely. The EDFA’s Bridging Borders report highlights these issues and emphasizes that greater harmonization, clearer guidance, and stronger regulatory cooperation are needed to make cross-border growth more predictable and efficient. While policymakers are pursuing market integration and supervisory convergence, progress remains gradual, leaving fintechs to carefully navigate national interpretations of common rules.[4]European Digital Finance Association, “Bridging Borders: Towards a More Coherent European Financial Market,” EDFA, europeandigitalfinance.eu.
*Our forecasts treat driver/restraint impacts as directional, not additive. The impact forecasts reflect baseline growth, mix effects, and variable interactions.
Segment Analysis
By Service Proposition: Neobanks Scale While Insurtech Draws AI Investment
Digital payments accounted for 52.67% of the European fintech market in 2025. Growth is driven by instant payment mandates, verification-of-payee requirements, and increasing merchant adoption of account-to-account and card-based flows. Infrastructure providers, such as Adyen, report strong revenue and transaction volume, reflecting the shift toward omnichannel, real-time payment acceptance. Regulatory measures like mandatory verification-of-payee enhance transaction security and build trust, encouraging broader adoption in both e-commerce and point-of-sale environments. Together, real-time rails, offline acceptance safeguards, and unified risk controls are making payments faster, safer, and more reliable for consumers and merchants across Europe.
Insurtech is the fastest-growing segment in Europe, projected to expand at a 16.58% CAGR through 2031, supported by data-driven underwriting, embedded distribution, and compliance-ready product design. Neobanking is evolving, with profitable leaders expanding product lines, improving operating leverage, and leveraging AI-enabled service flows, while smaller providers focus on cost efficiency. The growth of real-time payment rails and open APIs provides new channels for data, distribution, and personalization, enabling insurers and banks to embed coverage and financial services seamlessly into digital journeys. European rulemaking and participation in scheme governance are integrating fintechs more directly into the industry, strengthening settlement and standardization. Overall, these innovations allow multiple fintech segments to scale concurrently, with digital payments advancing on real-time infrastructure and Insurtech expanding via AI and partner-led distribution.


By End-User: Businesses Outpace Retail on Embedded Finance Uptake
Retail users accounted for nearly 67.82% of the European fintech market in 2025, continuing to drive transaction volume across payments and financial services. Mobile wallets and buy-now-pay-later solutions are maturing under stricter conduct rules, supporting safer, more reliable consumer experiences. Adoption is further reinforced by European digital identity initiatives, which streamline authentication, consent, and verification processes. These improvements reduce friction at checkout and increase engagement across online and in-store channels. As a result, retail users remain a key source of transaction volume while enabling fintechs to scale digital payment solutions efficiently.
The business segment is projected to grow at a 15.77% CAGR through 2031, driven by SMEs embedding payments, issuing, and lending tools within accounting, payroll, and commerce platforms. Digital integration enables faster onboarding, automated reconciliation, and real-time risk assessment, supporting working capital and credit solutions. Strong ecosystems in countries like Germany and the United Kingdom provide infrastructure and data access that facilitate embedded finance adoption. Platform providers offering unified commerce and capital solutions are accelerating cross-sell opportunities and reducing friction for both B2B and B2C transactions. Overall, the shift from standalone banking interfaces to native financial tools in vertical software is driving sustained growth in the Europe fintech market’s business segment.
By User Interface: Mobile Applications Lead as Web Channels Consolidate
Mobile applications held nearly 59.73% of the European fintech market in 2025 and are projected to grow at a 17.92% CAGR through 2031, reflecting strong consumer and business preferences for in-app checkout, card-on-file, and biometric authentication. Regulatory programs and institutional initiatives are enhancing the speed, security, and cost-efficiency of digital payments, reinforcing mobile-first adoption. Real-time payment rails, consent mechanisms, and tokenization improvements make mobile apps ideal for seamless repeat use in e-commerce and subscription services. While web channels continue to support discovery and onboarding, deep engagement is increasingly shifting to mobile apps where users can authenticate, pay, and manage money efficiently. Over the forecast period, mobile experience design is expected to remain a key driver for conversion, fraud mitigation, and user retention across both retail and business segments.
POS terminals and IoT-enabled devices represent a smaller channel but are essential for maintaining continuity during network outages and supporting offline capabilities for critical merchants. Germany’s near-universal instant payment adoption is enabling faster in-store refunds and more customer-friendly service flows, while merchant upgrades continue gradually across terminal fleets. Providers offering unified commerce solutions integrate APIs for online, mobile, and in-store transactions, simplifying orchestration, reporting, and reconciliation for retailers. European standards bodies are finalizing QR code specifications to enhance cross-border acceptance and interoperability between mobile and in-person interfaces. Together, these developments anchor a cohesive omnichannel experience, ensuring resilience, seamless payment flows, and improved user experience across all touchpoints.
Geography Analysis
The United Kingdom accounted for 21.56% of the European fintech market in 2025 and remains a leader in open banking. The country has seen strong growth in digital and contactless payments, while fraud prevention measures such as confirmation of payee are increasingly covering most payment flows. Fintech leaders with robust unit economics are investing in compliance and AI-enabled services to protect margins and scale operations efficiently. United Kingdom merchants and platforms are exploring account-to-account payment options, adapting to regulatory developments in fraud reimbursement and incident reporting. Over the forecast period, the United Kingdom’s mature open API base and real-time capabilities are expected to support ongoing product innovation while requiring careful risk management and customer protection.
Germany remains Europe’s second-largest fintech market by revenue, supported by a diverse ecosystem across payments, banking, and investments, bolstered by strong commerce and manufacturing sectors. BaFin’s supervisory focus on digital operational resilience, outsourcing risk, and cyber incident reporting under the DORA framework has raised standards for ICT governance across financial entities. Germany’s advanced instant payment infrastructure allows retailers to provide instant refunds and enables banks and PSPs to migrate more flows onto real-time rails. France complements this growth with a vibrant fintech community that added new unicorns by 2025, even as investors apply stricter standards on revenue quality and compliance readiness. Policy emphasis on domestic payment stacks, resilience, and innovation continues to guide European financial services over the medium term.
The Nordics are projected to achieve the highest regional CAGR at 16.17%, driven by high digital adoption, widespread instant transfers, and integrated mobile payments. Sweden’s Swish platform connects millions of individuals and businesses, while authorities ensure offline acceptance and redundancy to maintain transaction continuity. Southern Europe also shows growing fintech activity, supported by EIB financing for high-growth payment providers and strengthening merchant acceptance programs. Pan-European initiatives, including the Digital Identity Wallet and instant payment mandates, create a common innovation layer that reduces experience gaps across regions. Together, these developments enhance cross-border portability, shared payment rails, and regional expansion, even as local compliance and oversight require targeted adaptations.
Competitive Landscape
The European fintech market is moderately consolidated in payments infrastructure but remains fragmented in adjacent segments, with leading providers scaling omnichannel acceptance, instant payments, and expanding into issuing and working capital solutions. Major players are achieving strong financial and operational performance as merchants adopt more terminals and unified APIs for online and in-store acceptance. Open banking monetization and account-to-account capabilities are increasing competitive pressure on traditional card flows, while scheme governance evolves to include more fintech participants in standard-setting and SEPA programs. Companies with robust compliance programs, strong merchant relationships, and AI-driven execution are positioned to capture incremental market share. Overall, consolidation favors firms that can combine scale, technology, and operational excellence to serve complex merchant and enterprise needs.
Technology differentiation is becoming a key competitive advantage, with leading fintechs deploying AI across customer operations, risk management, checkout optimization, and collections. AI-driven tools help improve conversion, reduce fraud, and optimize operational costs, while investments in underwriting models enhance payment performance for BNPL and fixed-term financing. The adoption of richer messaging standards and early integration with modern infrastructure provides strategic advantages for players able to support data-rich payment flows. Participation in scheme governance and standards workstreams allows fintechs to influence interoperability improvements, lowering onboarding, testing, and support costs. This environment rewards scaled PSPs and banks that leverage shared rails and extend their product portfolios efficiently.
Regulatory programs like the Digital Operational Resilience Act strengthen incident reporting, third-party risk oversight, and ICT resilience, driving demand for compliance automation and operational testing across institutions. The digital euro initiative is advancing toward implementation, encouraging wallet readiness and identity integration for banks and PSPs. The European Digital Identity Wallet mandate standardizes authentication across public and private services, laying the groundwork for unified digital credential acceptance and future digital euro adoption. As instant rails, identity wallets, and rich messaging converge, cross-border offerings can expand with higher security and lower operational friction. Firms that build on these foundations while maintaining operational discipline and capital efficiency are expected to outperform in the coming years.
Europe Fintech Industry Leaders
Adyen N.V.
Klarna Bank AB
Revolut Ltd
Checkout.com Group
Wise plc
- *Disclaimer: Major Players sorted in no particular order

Recent Industry Developments
- January 2026: Australian fintech Airwallex announced plans to invest approximately Euro 200 million (USD 234 million) to expand its European operations from the Netherlands, significantly increasing staff and scaling multi‑currency payment services across the region.
- December 2025: The European Payments Council (EPC) has launched a public consultation on urgent change requests to the Verification of Payee (VOP) scheme rulebook version 1.1, inviting stakeholders to review proposed updates to address issues identified after its deployment and submit feedback by mid‑February 2026.
- June 2025: The European Retail Payments Board provided an update on the adoption of SEPA Instant Credit Transfer (SCT Inst) and the ongoing efforts to finalise a standardised QR code format for instant payments. The update highlights strong adherence to the SCT Inst scheme and progress toward publishing the QR code standard.
- January 2025: The Instant Payments Regulation came into force, obliging EU payment service providers to offer real-time euro transfers at no surcharge, accelerating A2A adoption across the European fintech market.


Research Methodology Framework and Report Scope
Market Definitions and Key Coverage
Our study defines the European fintech market as all fee or interest income earned within Europe by regulated providers of digital payments, lending and financing, investment platforms, insurtech offerings, and neobanking services that reach users through mobile apps, browser interfaces, or connected devices.
Scope exclusion: pure-play decentralized crypto exchanges that do not support fiat settlement are kept outside the frame.
Segmentation Overview
- By Service Proposition
- Digital Payments
- Digital Lending and Financing
- Digital Investments
- Insurtech
- Neobanking
- By End-User
- Retail
- Businesses
- By User Interface
- Mobile Applications
- Web/Browser
- POS/IoT Devices
- By Country
- United Kingdom
- Germany
- France
- Spain
- Italy
- Benelux (Belgium, Netherlands, and Luxembourg)
- Nordics (Sweden, Norway, Denmark, Finland, and Iceland)
- Rest of Europe
Detailed Research Methodology and Data Validation
Primary Research
Discussions with payment processors, challenger banks, reg-tech architects, venture investors, and former supervisors across the UK, Germany, France, Spain, and the Nordics guided elasticity assumptions, pricing drifts, and user-migration timelines. Surveys of small merchants and retail savers provided adoption rates for account-to-account rails and in-app wallets, letting us reconcile desk findings with customer reality and fine-tune country weights.
Desk Research
We begin with official macro and industry datasets such as Eurostat household digital-payment penetration, European Central Bank instant-payments volumes, Bank for International Settlements Red Book transaction flows, and European Banking Authority PSD2 compliance filings, which anchor channel mix and pricing ratios. Trade groups like the European Fintech Association, plus national statistics from BaFin, ACPR, and the FCA, enrich fee take-rates and license cohorts. Company filings, IPO prospectuses, and investor decks supply benchmark unit economics that feed our margin curves. Where public data fade, Mordor analysts reference paid resources including D&B Hoovers for revenue splits, Dow Jones Factiva for deal pipelines, and Volza for cross-border remittance flows. The examples above are illustrative; many other sources help us verify, cross-check, and clarify data points throughout the build.
Market-Sizing & Forecasting
A top-down reconstruction converts transaction values, balance sheets, and funding pools into service-level revenues, which are then validated through selective bottom-up checks such as sampled average revenue per user times active user bases. Key variables like mobile banking users, instant SEPA share of transfers, venture funding inflows, PSD2 API call volumes, digital-wallet penetration, and average merchant service charges drive both history and forecasts. Multivariate regression, layered with scenario analysis for regulatory or rate shocks, projects each driver through 2030. Where supplier or channel data remain incomplete, gaps are bridged using banker interviews and regional analogs before final triangulation.
Data Validation & Update Cycle
Outputs pass variance scans against independent payment and lending indicators, followed by senior analyst peer review. We refresh every twelve months, with interim revisions triggered by material events such as new ECB directives or megadeals; just before release, an analyst reruns the model so clients receive the latest vetted view.
Why Mordor's Europe Fintech Baseline Commands Reliability
Published estimates often diverge because analysts define services differently, apply distinct growth levers, or lock in outdated exchange rates.
Key gap drivers include whether unlicensed crypto venues are counted, the extent to which cross-border remittance fees are captured, and how quickly analysts refresh post-PSD2 adoption curves.
Benchmark comparison
| Market Size | Anonymized source | Primary gap driver |
|---|---|---|
| USD 85.52 B (2025) | Mordor Intelligence | |
| USD 96.50 B (2024) | Global Consultancy A | Includes non-regulated crypto venues and assumes uniform EU spread without country granularity |
| USD 89.30 B (2024) | Industry Data Firm B | Omits early-stage neobanks, applies flat 10% growth path across segments |
| USD 62.63 B (2024) | Regional Research House C | Excludes payment-gateway fees and cross-border remittances, relies heavily on funding data proxies |
These contrasts show that Mordor Intelligence, by selecting only regulated activities, layering market-specific variables, and updating annually, delivers a balanced and transparent baseline that decision-makers can trace back to reproducible steps and reliable inputs.


Key Questions Answered in the Report
What is the projected size and growth of the Europe fintech market to 2031?
The Europe fintech market size is USD 98.14 billion in 2026 and is projected to reach USD 195.35 billion by 2031 at a 14.76% CAGR, supported by instant payment mandates and open banking monetization.
Which service areas lead growth and scale in the Europe fintech market?
Digital Payments leads with 52.67% share in 2025, while Insurtech posts the highest projected growth at a 16.58% CAGR, reflecting a combination of real-time rails and AI-enabled underwriting.
How are EU regulations shaping payment speed and security for European fintechs?
The Instant Payments Regulation mandates instant euro transfers and verification of payee, which increases speed and trust across account-to-account flows and catalyzes merchant adoption.
Why are mobile applications central to user engagement in European financial services?
Mobile holds 59.73% interface share in 2025 and is set to grow at 17.92% CAGR as biometrics, card-on-file, and real-time rails make in-app payments seamless and secure.
Which regions show the strongest near-term momentum in European fintech?
The United Kingdom leads in open banking usage with 21.56% in 2025, while the Nordics are forecast to record the fastest regional CAGR at 16.17% as instant rails and digital comfort broaden use cases.
Page last updated on:


