Market Overview
| Study Period | 2020 - 2031 |
|---|---|
| Forecast Data Period | 2026 - 2031 |
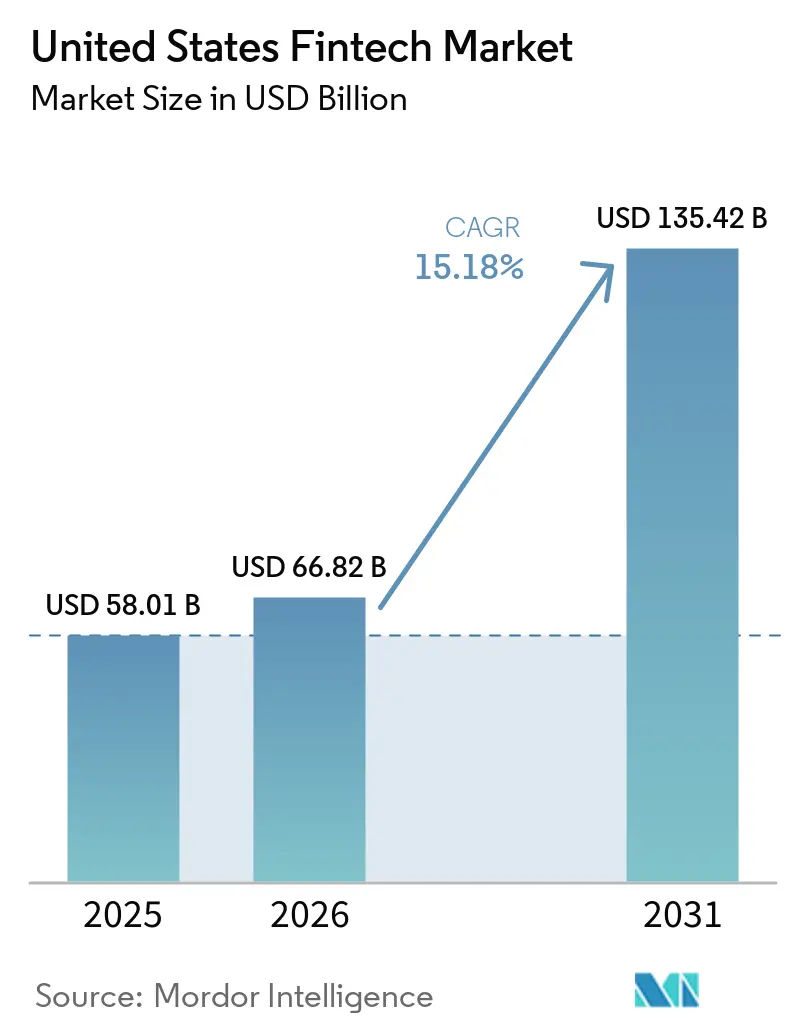
| Base Year Market Size (2025) | USD 58.01 Billion |
| Market Size (2026) | USD 66.82 Billion |
| Market Size (2031) | USD 135.42 Billion |
| Growth Rate (2026 - 2031) | 15.18% CAGR |
| Market Concentration | Low |
Major Players *Disclaimer: Major Players sorted in no particular order Image © Mordor Intelligence. Reuse requires attribution under CC BY 4.0. | |
United States Fintech Market Analysis by Mordor Intelligence
The United States fintech market size in 2026 is estimated at USD 66.82 billion, growing from 2025 value of USD 58.01 billion with 2031 projections showing USD 135.42 billion, growing at 15.18% CAGR over 2026-2031. A combination of nationwide real-time payment infrastructure, embedded finance adoption, and artificial-intelligence-driven risk tools is reshaping customer expectations and forcing incumbents to modernize. Venture capital investment has begun to recover from the 2024 trough, yet regulatory scrutiny of bank–fintech partnerships remains intense, influencing how quickly new products reach the market[1]Federal Reserve Board, “Number of Financial Institutions Participating in the FedNow Service Surpasses 1,300,” federalreserve.gov. . Regionally, the United States fintech market continues to benefit from the West’s technology ecosystem, even as the South records the fastest growth due to lower operating costs and supportive state policies. Competitive intensity is moderate because no single firm exceeds a double-digit share, leaving space for vertical specialists and community-bank-backed platforms to thrive.
Key Report Takeaways
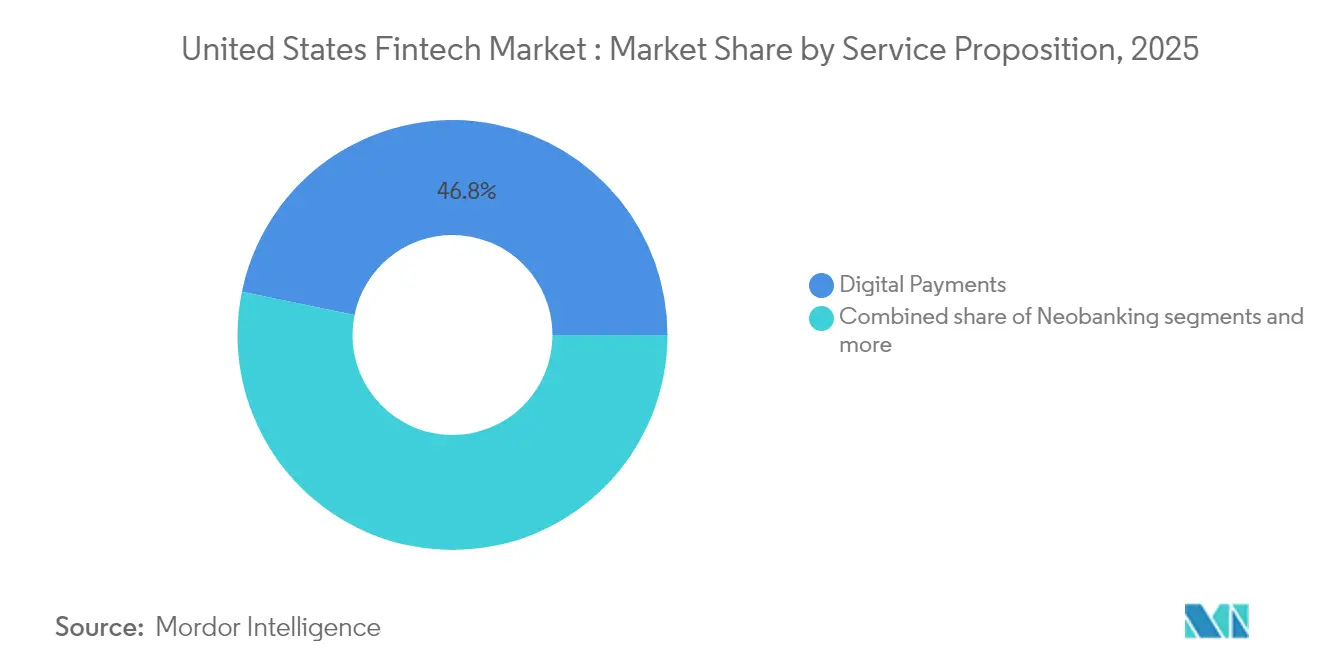
- By service proposition, digital payments captured 46.78% of the United States fintech market share in 2025, while neobanking is forecast to grow fastest at a CAGR of 21.05% between 2026 and 2031.
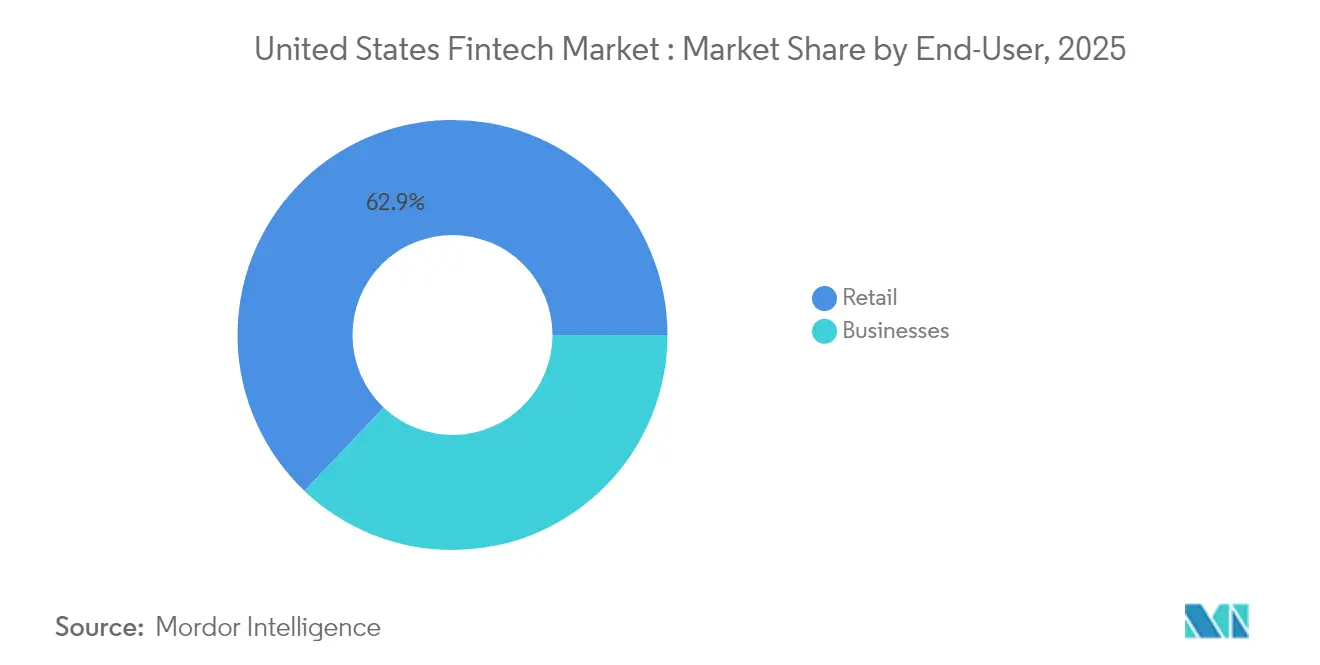
- By end-user, retail accounted for 62.91% of the United States fintech market share in 2025, with the market size for businesses expected to expand at a growth rate of 17.26% CAGR during 2026–2031.
- By user interface, mobile apps represented 70.21% of the United States fintech market share in 2025, while POS/IoT devices is projected to rise at a 16.45% CAGR through 2031.
- By geography, the Western region led with 35.92% of the United States fintech market share in 2025, while the Southern region is anticipated to grow at the fastest rate of 14.41% CAGR from 2026 to 2031.
Note: Market size and forecast figures in this report are generated using Mordor Intelligence’s proprietary estimation framework, updated with the latest available data and insights as of 2026.
United States Fintech Market Trends and Insights
Drivers Impact Analysis*
| Driver | (~) % Impact on CAGR Forecast | Geographic Relevance | Impact Timeline |
|---|---|---|---|
| Real-time payments rollout accelerates digital adoption | +3.2% | National, concentrated in West and Northeast | Medium term (2-4 years) |
| Embedded finance uptake by vertical SaaS platforms | +2.8% | National, strongest in West and South | Short term (≤ 2 years) |
| Mobile wallet & contactless penetration across demographics | +2.1% | National, higher penetration in urban areas | Short term (≤ 2 years) |
| AI/ML-driven credit & fraud models improve risk economics | +1.9% | National, led by West Coast innovation centers | Medium term (2-4 years) |
| "Fin-infra-as-code" open-source stacks slash go-to-market time | +1.4% | National, concentrated in tech hubs | Long term (≥ 4 years) |
| Tokenised deposits & programmable money pilots by U.S. megabanks | +0.8% | National, pilot programs in major financial centers | Long term (≥ 4 years) |
| Source: Mordor Intelligence | |||
Real-Time Payments Rollout Accelerates Digital Adoption
FedNow expanded from 35 launch banks to more than 1,300 institutions by August 2024, illustrating how public infrastructure can overcome network-effect barriers. The USD 500,000 transaction ceiling attracts commercial flows that once relied on wires. Concurrently, The Clearing House’s RTP network processed 87 million transfers worth USD 69 billion in Q3 2024, growing about 17% quarter-over-quarter. Fintech providers leverage these rails to offer instant bill pay and earned-wage access, boosting daily active users. Yet the proliferation of multiple instant-payment schemes raises interoperability challenges that favor orchestration platforms able to abstract settlement complexity for community banks.
Embedded Finance Uptake by Vertical SaaS Platforms
Vertical software vendors now generate three-to-four times more revenue once payments and lending become embedded features, shifting their strategic focus from licensing fees to transaction economics. Banking-as-a-Service (BaaS) intermediaries fill regulatory gaps, though new OCC and FDIC guidance issued in July 2024 elevates due-diligence costs for sponsor banks. Established core-banking providers such as Temenos took minority stakes in U.S. BaaS players to accelerate time-to-market instead of rebuilding tech stacks from scratch. Interchange caps under the Durbin Amendment incentivize smaller community banks to partner with SaaS platforms, fragmenting issuer relationships but broadening service reach. ISO 20022 data standards further enhance reconciliation and dynamic pricing modules embedded within these vertical ecosystems.
Mobile Wallet & Contactless Penetration Across Demographics
Tokenization and biometric authentication have expanded mobile wallet use among middle-aged and senior consumers, pushing contactless acceptance above the 80% merchant threshold in large metropolitan areas. The Federal Trade Commission reported bank-transfer fraud losses eclipsing cryptocurrency scams for the first time in 2024, demonstrating mainstream traction—and new risks—in digital rails. Wallet providers are responding with device-fingerprint analytics that score risk in milliseconds without additional friction. NFC-enabled kiosks and connected-car dashboards illustrate how IoT endpoints are becoming payment initiators, broadening addressable transaction volume. Rich token data also allow merchants to run targeted promotions while remaining compliant with state privacy laws such as the CCPA.
AI/ML-Driven Credit & Fraud Models Improve Risk Economics
Machine-learning credit engines now ingest alternative data, including telecom signals and device behaviors, to expand approval rates while keeping default rates stable. Community institutions deploying consortium-based fraud analytics report no material increase in losses after adopting instant payments, highlighting the efficacy of shared intelligence. The Federal Reserve’s Fraud Classifier tool provides a common taxonomy that enhances cross-bank information exchange. Vendors like FICO released purpose-built models for real-time rails capable of scanning payloads in sub-second latencies [2]FICO Analysts, “Ecosystem to Detect and Prevent Real-Time Payments Fraud,” fico.com. . These advances permit lenders to automate decisions, cut manual review costs, and accelerate fund disbursement—improving customer satisfaction and loyalty within the United States fintech market.
Restraints Impact Analysis*
| Restraint | (~) % Impact on CAGR Forecast | Geographic Relevance | Impact Timeline |
|---|---|---|---|
| Fragmented federal & state regulation raises compliance burden | −2.4% | National, highest in CA & NY | Short term (≤2 years) |
| Escalating fraud & cybersecurity costs in real-time rails | −1.8% | National, high-volume hubs | Medium term (2-4 years) |
| Funding pull-back & valuation compression post-2022 | −2.7% | National, with stronger impact on early-stage hubs like SF and Austin | Medium term (2-4 years) |
| Heightened OCC/FDIC scrutiny of sponsor-bank partnerships | −2.3% | National, concentrated in neobank and BaaS ecosystems | Medium to long term (2-5 years) |
| Source: Mordor Intelligence | |||
Fragmented Federal & State Regulation Raises Compliance Burden
Fintech firms must navigate 50 state money-transmitter regimes plus overlapping federal oversight, which increases legal costs and lengthens product launches. The July 2024 OCC-FDIC guidance imposed stronger vendor-management rules on BaaS banks, prompting several fintech sponsors to pause onboarding while they upgrade controls. Early-stage startups may spend 20% of operating budgets on AML/KYC requirements, limiting experimentation and favoring well-capitalized incumbents. Potential CFPB action on liability sharing for scam losses adds another layer of uncertainty. Collectively, these factors moderate the near-term expansion pace of the United States fintech market.
Escalating Fraud & Cybersecurity Costs in Real-Time Rails
Irrevocable instant payments have spurred a rise in authorized push-payment scams; 45% of U.S. banks reported growth of 25% or more in such attacks during 2023. Consumers lost USD 12.5 billion to scams in 2024, up 14% year-over-year, placing pressure on institutions to invest in real-time detection systems[3]American Banker Staff, “VC Fintech Funding Slides to Lowest Level Since 2016,” americanbanker.com. . Generative-AI voice cloning complicates customer-verification workflows, forcing providers to implement multi-factor defenses that elevate operating expenses. Industry groups under the FedPayments Improvement initiative advocate coordinated data-sharing to curb mule networks. Elevated fraud losses can erode user trust and temper adoption unless mitigated.
*Our forecasts treat driver/restraint impacts as directional, not additive. The impact forecasts reflect baseline growth, mix effects, and variable interactions.
Segment Analysis
By Service Proposition: Neobanking Drives Future Growth
Digital Payments controlled 46.78% of the United States fintech market in 2025, reflecting broad consumer and merchant acceptance across cards, wallets, and account-to-account rails. Neobanking, while smaller, is projected to grow at a 21.05% CAGR through 2031, underpinned by branch-free models that reduce cost-to-serve and enable fee-free checking propositions. The United States fintech market size for Neobanking is therefore expected to widen considerably, attracting investors despite tighter capital markets.
Cross-selling is increasing: payment-facilitating SaaS vendors now embed short-term lending and treasury tools, weaving multiple propositions into a single workflow. US Digital Lending & Financing maintains a healthy 26.92% share, aided by AI underwriting that speeds decisions for thin-file borrowers. Insurtech accounts for only 7.36% because of capital adequacy rules, yet its usage-based auto and embedded travel policies illustrate convergence with payment channels. Digital Investments, at 4.89%, is consolidating after Goldman Sachs exited pure robo-advice; incumbents leverage omnichannel distribution to hold assets. These overlaps illustrate how every proposition ultimately competes for wallet share within the United States fintech market.


By End-User: Business Segment Accelerates
Retail users comprised 62.91% of the United States fintech market size in 2025, anchored by ubiquitous smartphones and simplified onboarding flows. Still, Business customers, particularly small and medium-sized enterprises, are on track for a 17.26% CAGR through 2031 as they integrate real-time payments and automated invoicing into back-office systems. Integrated offerings often command higher take-rates, bolstering provider revenues even if transaction volume trails retail.
Vertical SaaS platforms targeting health, property, and logistics sectors routinely embed accounts receivable financing and spend management cards, creating sticky ecosystems. Regional banks like Huntington deploy white-label advisory tools to retain commercial deposits and cross-sell treasury services. Regulatory green lights for FedNow corporate use cases reinforce the appeal of instant settlement for cash-flow management. Consequently, suppliers building API-first stacks see growing demand from software developers, further expanding the United States fintech market.
By User Interface: IoT Integration Transforms Access
Mobile Applications dominated interfaces with 70.21% United States fintech market share in 2025, thanks to intuitive biometrics and contextual insights. However, POS/IoT endpoints—smart terminals, connected cars, and self-checkout kiosks—should post a 16.45% CAGR, showcasing how commerce is moving beyond handheld screens. Rich ISO 20022 data accompanying each IoT transaction enables analytics engines to deliver real-time loyalty offers and risk scores simultaneously.
Browser-based portals retain relevance for complex tasks like loan origination and portfolio rebalancing that benefit from larger screens. Voice assistants and wearables, though nascent, highlight the next wave of ambient financial access where authentication happens passively through biometrics. Even so, cybersecurity standards must harden as device diversity multiplies potential attack vectors. Providers that can secure and orchestrate these varied interfaces will capture incremental value within the broader United States fintech market.
Geography Analysis
The West retained 35.92% United States fintech market share in 2025 owing to decades-long venture-capital clustering and mature cloud infrastructure. California’s Consumer Privacy Act pushes compliance spending higher, which can limit new entrants but strengthens the resilience of established platforms. Tech-forward regulators in Arizona and Utah offer sandboxes that shorten licensing cycles, keeping innovation anchored in the region.
The Northeast benefits from proximity to Wall Street and federal regulators, fostering faster partnership formation between banks and startups. New York overtook San Francisco for deal count in 2024, accounting for roughly 30% of national fintech transactions. High talent costs and office rents temper profitability, though hybrid work arrangements are mitigating pressure. Meanwhile, the Midwest provides affordable labor and a dense network of community banks eager for BaaS alliances, yet limited venture funding can slow late-stage scaling.
The South posts the fastest 14.41% CAGR to 2031 as states like Texas and Florida roll out fintech-friendly charters and tax incentives. Lower operating expenses, coupled with a growing migrant population, create demand for cross-border remittances and gig-worker payouts. Nebraska’s conditional approval of Telcoin’s digital-asset depository shows how smaller states can seize niche opportunities in the United States fintech market. Across regions, community-bank distribution and state policy variety ensure that localized strategies remain essential to national expansion.
Competitive Landscape
The United States fintech market is moderately fragmented, with a few major players holding notable influence while leaving ample room for new entrants and specialized innovators. This market structure supports the growth of vertical-focused fintech solutions, allowing niche disruptors to address specific customer needs. Established firms, meanwhile, leverage their scale, infrastructure, and regulatory relationships to maintain a competitive edge. PayPal's evolution from a traditional payments provider to a full-fledged financial services platform highlights how incumbents must continuously adapt to stay ahead of both legacy banks and emerging fintech competitors. Competitive intensity continues to rise as traditional banks enhance their digital capabilities and pursue fintech acquisitions to accelerate innovation.
At the same time, regulatory scrutiny is shaping the landscape, particularly around sponsor-bank partnerships that many fintechs rely on for banking access. The increasing oversight from agencies such as the OCC and FDIC is creating barriers to entry, favoring firms with established regulatory compliance structures. This changing environment puts pressure on fintechs to not only innovate but also to meet more stringent operational and compliance standards. As a result, companies with robust governance and established banking relationships are better positioned to navigate this shift. This regulatory climate, while challenging, also acts as a competitive moat for well-prepared firms.
Technology remains a key differentiator in the market, particularly in areas like AI-driven fraud detection, credit underwriting, and personalized customer experiences. Companies such as FICO are developing advanced real-time fraud prevention tools that secure instant transactions without disrupting the user journey. Meanwhile, significant white-space opportunities exist in areas like B2B payment orchestration, SME-focused cross-border remittances, and embedded finance for specialized SaaS platforms in industries such as healthcare and real estate. Fiserv’s acquisition of Payfare for USD 265 million reflects how established players are expanding through strategic deals rather than organic growth, especially in emerging segments like gig economy payments. As technology and regulation continue to evolve, successful fintechs will be those that combine innovation with compliance and targeted market focus.
United States Fintech Industry Leaders
PayPal
Stripe
Block (Square & Cash App)
Intuit (QuickBooks / Credit Karma)
Chime
- *Disclaimer: Major Players sorted in no particular order


Recent Industry Developments
- February 2025: Telcoin received conditional approval from the Nebraska Department of Banking and Finance to launch the state’s first digital-asset depository institution, paving the way for its eUSD stablecoin under the Nebraska Financial Innovation Act.
- December 2025: Fiserv announced the acquisition of Payfare for USD 265 million to expand its gig economy payment capabilities and strengthen its position in the growing freelance and contractor payment market, reflecting consolidation trends in specialized payment segments.
- July 2024: The Office of the Comptroller of the Currency and Federal Deposit Insurance Corporation issued joint guidance requiring enhanced due diligence for bank-fintech partnerships, establishing new supervisory expectations that could reshape the Banking-as-a-Service ecosystem and increase compliance costs for participating institutions.
- May 2024: Temenos made a minority investment in U.S. Banking-as-a-Service provider Mbanq to accelerate BaaS adoption and capture market growth opportunities, demonstrating how established financial technology vendors are positioning for embedded finance expansion through strategic partnerships.


United States Fintech Market Report Scope
Fintech (financial technology), is a term used to describe a range of products and services that use technology to enhance and automate traditional financial operations and processes. Examples of Fintech products and services include online banking services, mobile payments, P2P lending, digital wallets and financial management tools.
Sales of platform- and technology-based financial services, along with related products, make up the FinTech (Financial Technologies) market. FinTech refers to the application of technology and innovation to the delivery of financial services via web-based platforms. The scope of the report comprises a complete background analysis of the US fintech industry, including a valuation of emerging trends by segments, significant changes in market dynamics, market overview, market size approximation for key segments, and key company profiles also covered in the report.
The United States Fintech Market is Segmented by Service Proposition (Digital Payments (Mobile POS Payments, Digital Remittance, and Digital Commerce), Digital Investments (Neo-Brokers and Robo-Advisors), Alternative Lending, Alternative Funding (Crowd Investing and Crowd Funding), Neo-banking, and Online insurance and insurance marketplaces. The report offers Market size and forecasts for United States Fintech Market in value (USD Million) for all the above segments.
By Service Proposition
| Digital Payments |
| Digital Lending & Financing |
| Digital Investments |
| Insurtech |
| Neobanking |
By End-User
| Retail |
| Businesses |
By User Interface
| Mobile Applications |
| Web / Browser |
| POS / IoT Devices |
By Geography
| Northeast |
| Midwest |
| South |
| West |
| By Service Proposition | Digital Payments |
| Digital Lending & Financing | |
| Digital Investments | |
| Insurtech | |
| Neobanking | |
| By End-User | Retail |
| Businesses | |
| By User Interface | Mobile Applications |
| Web / Browser | |
| POS / IoT Devices | |
| By Geography | Northeast |
| Midwest | |
| South | |
| West |


Key Questions Answered in the Report
How large is the United States fintech market in 2026?
It is valued at USD 66.82 billion and is projected to more than double by 2031.
What is driving the fastest growth within U.S. fintech?
Neobanking is set to expand at a 21.05% CAGR thanks to branch-free models and embedded finance synergies
Which region leads in U.S. fintech adoption?
The West holds the highest 2025 share at 35.92%, buoyed by venture funding and tech infrastructure.
How will instant payments affect corporate users?
FedNow and RTP allow same-day settlement, improving cash-flow management for small and medium businesses.
What are the main regulatory challenges for fintech firms?
Overlapping state money-transmitter laws and stricter OCC-FDIC oversight raise compliance costs for new entrants.
Are fraud losses rising in real-time payment systems?
Yes; 2024 consumer scam losses hit USD 12.5 billion, prompting heavier investment in AI-based detection tools.
Page last updated on:


