Market Overview
| Study Period | 2020 - 2031 |
|---|---|
| Forecast Data Period | 2026 - 2031 |
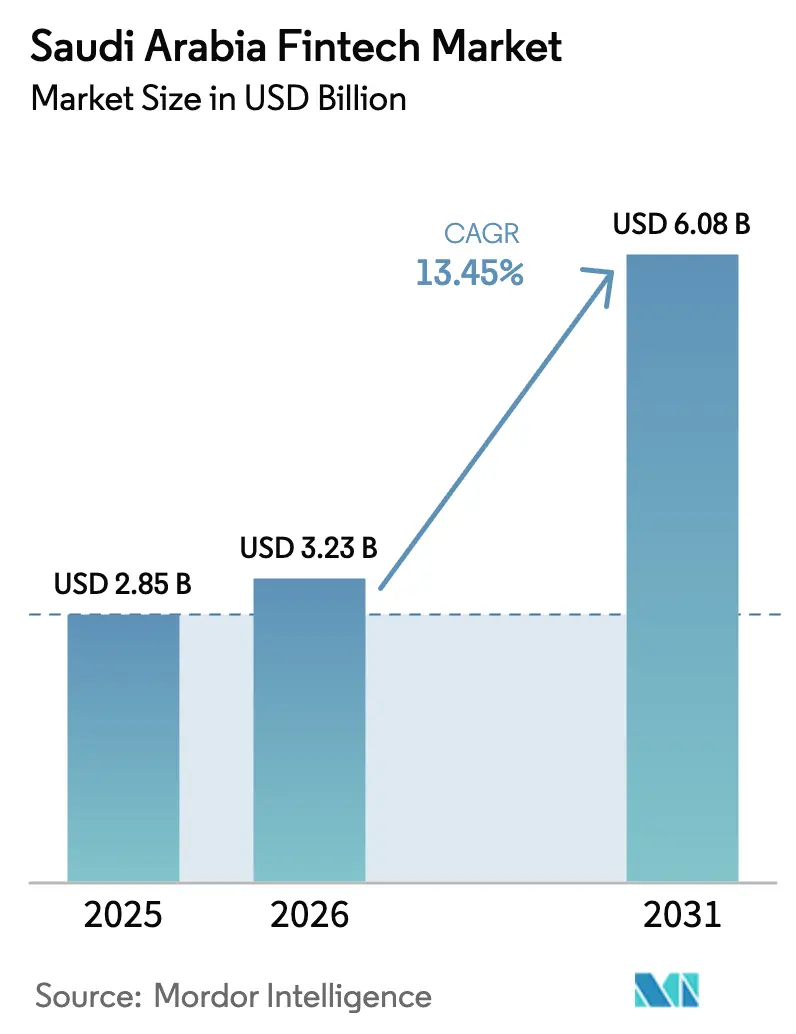
| Base Year Market Size (2025) | USD 2.85 Billion |
| Market Size (2026) | USD 3.23 Billion |
| Market Size (2031) | USD 6.08 Billion |
| Growth Rate (2026 - 2031) | 13.45% CAGR |
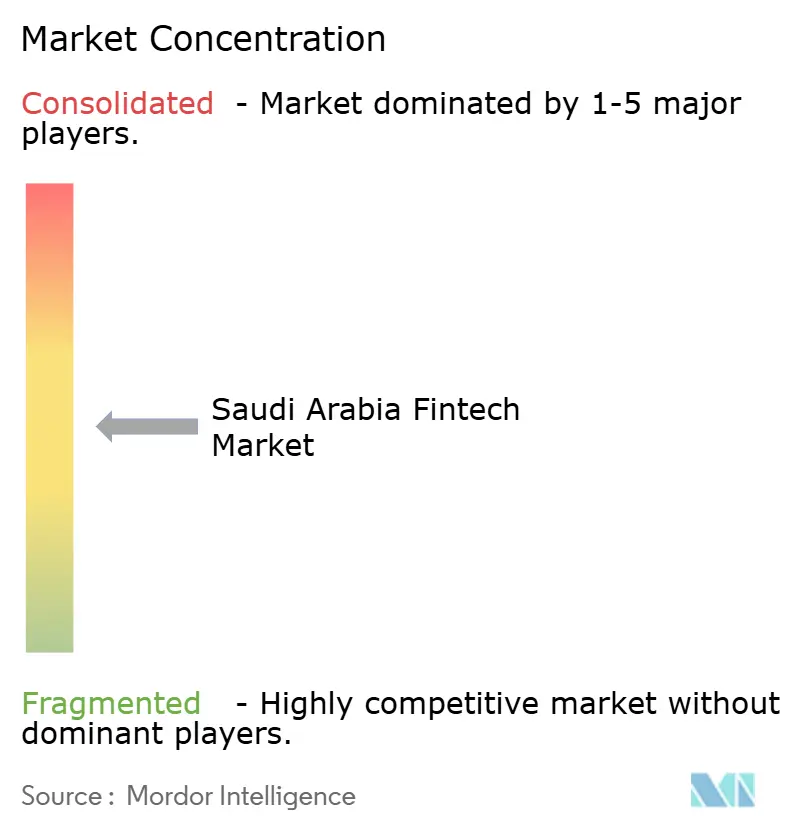
| Market Concentration | Medium |
Major Players
*Disclaimer: Major Players sorted in no particular order Image © Mordor Intelligence. Reuse requires attribution under CC BY 4.0. |
|
Saudi Arabia Fintech Market Analysis by Mordor Intelligence
The Saudi Arabia Fintech Market size was valued at USD 2.85 billion in 2025 and is estimated to grow from USD 3.23 billion in 2026 to reach USD 6.08 billion by 2031, at a CAGR of 13.45% during the forecast period (2026-2031).
The growth pattern reflects policy-led modernization that embeds finance in commerce, public services, and everyday transactions. Open banking APIs and embedded finance models shift financial access from traditional channels into retail and digital ecosystems, which is changing product design and customer journeys. Regulatory clarity and targeted licensing have expanded the number of licensed firms and concentrated investment in scalable use cases tied to Vision 2030 programs. The operating environment also benefits from agile infrastructure, with national payment rails and consent-based data access in place to enable wider fintech adoption.
Key operating indicators support the momentum observed in the Saudi Arabian fintech market. By mid-2025, the ecosystem crossed 261 licensed firms, created 11,046 direct jobs, and attracted SAR 7.9 billion (USD 2.1 billion) in cumulative funding, outpacing earlier targets by a wide margin. Electronic payments accounted for 79% of all retail transactions in 2024, while near-field communication payment adoption reached 94%, which positioned the Kingdom at the top of global rankings on this metric.
Key Report Takeaways
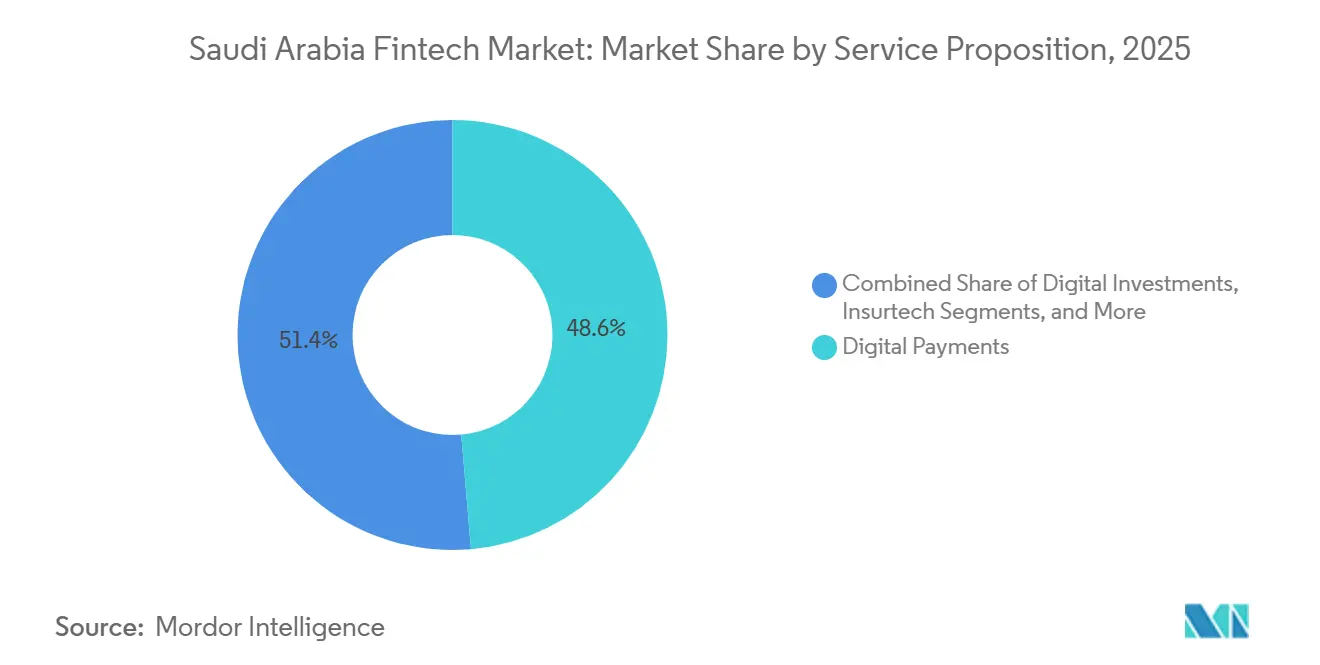
- By service proposition, digital payments led with 48.62% market share in 2025; neobanking is forecasted to expand at a 16.31% CAGR to 2031.
- By end-user, the retail segment held 64.17% share in 2025; business services recorded the highest projected CAGR at 14.02% through 2031.
- By user interface, mobile applications accounted for a 67.59% share in 2025; the mobile segment is advancing at a 15.27% CAGR through 2031.
Note: Market size and forecast figures in this report are generated using Mordor Intelligence’s proprietary estimation framework, updated with the latest available data and insights as of January 2026.
Saudi Arabia Fintech Market Trends and Insights
Drivers Impact Analysis*
| Driver | (~) % Impact on CAGR Forecast | Geographic Relevance | Impact Timeline |
|---|---|---|---|
| National Vision 2030 digital transformation mandate | +3.2% | National, strongest in Riyadh, Jeddah, and Eastern Province technology hubs | Medium term (2-4 years) |
| High smartphone penetration and youth-driven mobile uptake | +2.8% | National, acute in urban centers with 99% internet connectivity | Short term (≤ 2 years) |
| SAMA open-banking framework rollout | +2.5% | National, early concentration in major banks and licensed fintechs in the Central Region | Medium term (2-4 years) |
| Hajj and Umrah-driven seasonal digital payment spikes | +1.4% | Makkah and Madinah regions, with nationwide spillover to hospitality and transport | Short term (≤ 2 years) |
| SME credit gap propelling alternative lending | +2.1% | National, the highest intensity in manufacturing and retail across provinces | Long term (≥ 4 years) |
| Rising preference for Shariah-compliant products | +1.5% | National, stronger in conservative regions and government-linked enterprises | Medium term (2-4 years) |
| Source: Mordor Intelligence | |||


National Vision 2030 Digital Transformation Mandate Fueling Fintech Adoption
The Financial Sector Development Program’s push to scale licensed fintechs that align regulatory approvals with employment and GDP-linked outcomes has accelerated licensing throughput. Regulatory sandboxes for open banking and peer-to-peer models confer a protected experimentation period that establishes early leadership advantages. The mandate is reinforced by sovereign coordination, where capital allocation aligns with Vision 2030 KPIs such as SME financing penetration, non-cash transaction share, and skilled job creation in fintech. Access to national rails like the Mada network and the real-time Sarie system is a further differentiator, while the Personal Data Protection Law, effective since September 2024, has raised compliance thresholds for cross-border entrants through data residency rules and defined penalties[1]ICLG Editors, “Fintech Laws and Regulations Report 2025-2026: Saudi Arabia,” ICLG, iclg.com.
High Smartphone Penetration Enabling Mobile Payment Uptake Across Saudi Youth
Smartphone penetration intersects with a demographic skew, which concentrates demand for mobile-first financial products. The shift to mobile channels is visible in banking usage patterns, with a clear preference for app-based account access and transaction management that reduces distribution costs for providers. This preference fuels growth in categories where mobile delivery lowers distribution costs. Digital wallets expanded to 14.4 million active customers in 2024, up 52% year-over-year, while mobile point-of-sale terminals surged 18% to reach 2 million units. The generational split in digital wallet adoption for cross-border payments is 63% among Generation Z versus 28% among baby boomers, suggesting that cohort replacement alone will drive adoption curves upward over the next decade. Competitive ordering reflects these habits, as STC Pay’s wallet is among the most widely used alongside global platforms, with security frameworks and national cybersecurity standards reinforcing user trust[2]PYMNTS, "Saudi Small Businesses Rethink Payments for a Faster Future," PYMNTS, pymnts.com.
Launch of SAMA Open-Banking Framework Accelerating API-Led Innovation
SAMA’s staged open-banking implementation, beginning with account information services in November 2022 and expanding to payment initiation services in September 2024, emphasizes stability and security as adoption scales. Mandatory participation for licensed banks and optional participation for fintechs have broadened the perimeter of API-ready institutions as payment initiation became available, which helped push up digital service adoption. The 680% surge in open-banking transactions at Alinma and Bank Albilad stems from their early deployment of Banking-as-a-Service APIs, which allow fintechs to white-label bank products and split revenue rather than compete for direct customer relationships. Transaction volumes at banks that enabled Banking-as-a-Service APIs rose quickly as white-label arrangements let fintechs package bank products without competing for primary relationships.
Hajj & Umrah Pilgrim Volume Driving Seasonal Digital Payment Spikes
Religious tourism creates a concentrated test bed for digital payments, where millions of pilgrims transact over compressed timeframes and across many languages and device conditions. Wallets built for pilgrim use cases processed high shares of on-site transactions digitally in 2024, which validated system capacity and offline mode designs under peak loads. These volumes drive practical enhancements, such as faster biometric checks, AI-enabled ID verification, and streamlined onboarding flows for transient visitors who still need KYC-compliant solutions. Regulatory expectations for anti-money-laundering controls apply even to short-stay users, which has pushed innovation in mobile identity capture and risk scoring. Providers extend the pilgrim relationship beyond travel by bundling insurance, halal investment, and zakat calculators into wallets, which convert seasonal usage into year-round engagement in the Saudi Arabia fintech market[3]Inside Saudi, "Shaping the future of finance," Inside Saudi, insidesaudi.media.
Restraints Impact Analysis*
| Restraint | (~) % Impact on CAGR Forecast | Geographic Relevance | Impact Timeline |
|---|---|---|---|
| Dominance of cash in small retail outside major cities | -1.8% | Southern Region, rural Asir, Jazan, Najran, with fintech penetration of 50% vs 82% in the Central Region | Long term (≥ 4 years) |
| Limited availability of local tech talent | -1.4% | National, with acute shortages in Riyadh and Eastern Province for AI/ML and cybersecurity | Medium term (2-4 years) |
| Stringent cybersecurity and data-residency rules | -0.9% | National, with a stronger effect on international and cross-border providers | Short term (≤ 2 years) |
| Consumer trust concerns around non-bank digital lenders | -0.6% | National, higher among older demographics and rural areas | Medium term (2-4 years) |
| Source: Mordor Intelligence | |||
Dominance of Cash in Small Retail Transactions Outside Major Cities
While major urban centers approach cashless parity, many rural markets still favor cash for small-value transactions. Informal supply chains and undocumented credit arrangements sustain cash usage among small retailers in southern provinces, where digitization can disrupt tacit agreements. Reported cash shares across micro-segments such as day labor, street food, and household services remain persistent even as terminals spread. Bridging the gap requires embedded lending solutions that can replace supplier credit, tax frameworks attuned to irregular incomes, and targeted financial literacy interventions. Government-backed credit guarantees that leverage faster risk assessment show how public programs can reduce friction for informal participants as digital rails expand.
Limited Availability of Local Tech Talent Constraining Product Development
A visible gap between job openings and qualified local hires has emerged as fintech companies scale products and operations in Riyadh and other hubs. Regulations such as SAMA’s cybersecurity framework and integration demands with Mada and Sarie call for specialized engineers and security professionals. Government programs announced to upskill youth and expand digital capabilities are moving forward, but current demand outpaces supply for roles that support API security, cloud infrastructure, and AI-driven services. Localization policies add pressure to hire and promote nationals in leadership roles, which lengthens time-to-market as in-house training cycles extend product schedules. Salary inflation for senior engineers has also narrowed historic cost advantages over other regional hubs, which can tilt execution benefits toward large banks with deeper training budgets and longer payback horizons[4]International Monetary Fund Staff, “Saudi Arabia: 2025 Article IV Consultation—Press Release; and Staff Report,” IMF, imf.org.
*Our forecasts treat driver/restraint impacts as directional, not additive. The impact forecasts reflect baseline growth, mix effects, and variable interactions.
Segment Analysis
By Service Proposition: Neobanking Leads Growth Despite Digital Payments’ Market Dominance
Digital payments’ 48.62% share of the Saudi Arabia fintech market size in 2025 reflects entrenched advantages across domestic rails, merchant acceptance, and consumer familiarity. The next growth leg is expected from neobanking, which carries a 16.31% forecast CAGR, supported by three licensed digital banks and digital units of incumbents that target customers open to app-only account relationships. Licensing scarcity through 2024 elevated demand and customer acquisition as new digital banks converted large wallet user bases and onboarded customers quickly once approved, which shaped early growth patterns for the Saudi Arabia fintech market.
Product approvals shape the trajectory of insurance and investment categories in the Saudi Arabian fintech market. Insurtech momentum followed a successful public listing for a leading aggregator in 2024, while new product approvals, such as marine coverage in late 2024 and the move toward broader life insurance licensing, have expanded the addressable base. A general SME insurance bundle is advancing through regulatory review, with expected timelines that influence growth in small business coverage adoption. A pipeline of wealth and savings apps is active, and selective fundraising has supported new offerings while compliance and partner bank integrations proceed.


By End-User: Business Services Accelerate as Embedded Finance Unlocks SME Workflows
Retail users held 64.17% in 2025, but business services are projected to grow faster at a 14.02% CAGR as embedded finance integrates into daily SME workflows. Embedded payments, instant settlement, and credit at the point of sale remove friction for small merchants that previously lacked formal borrowing options, which aligns with the shift toward platforms that process transactions and provide working capital in the same interface. Players serving merchants report large customer bases and multi-billion-dollar annual processing volumes, which signal the size of workflows that fintech providers can convert into credit and treasury products for the Saudi Arabian fintech market. Bank-fintech partnerships bring underwriting to terminals and inventory systems through open-banking arrangements, which give SMEs real-time access to financing tied to verified cash flows rather than collateral.
Retail growth is still solid, though gains in urban areas now require more nuanced propositions for older users and rural communities where cash remains entrenched. Business services benefit from regulatory timing that permits supply-chain financing and invoice-based products, which expands when large enterprises participate through structured working capital programs. Alternative lenders and crowdfunding platforms have developed product sets that move approvals into hours rather than weeks, which attracts SMEs that need speed and predictability. As these models compound, value creation is expected to tilt toward B2B use cases that convert transaction data into credit signals and simplify working capital cycles across the Saudi Arabia fintech market.
By User Interface: Mobile Applications Sustain Leadership as Super-App Strategies Converge
Mobile interfaces held 67.59% share in 2025 and are posting the fastest growth at a 15.27% CAGR, backed by smartphone ubiquity and cohort preferences for app-first engagement. Web interfaces retain relevance for enterprise-grade functions, including treasury, reconciliation, and reporting, where desktop displays and workflows remain competitive. POS and IoT endpoints are expanding from a smaller base with a focus on SoftPOS to reduce hardware barriers for micro-merchants that want contactless acceptance. Regional providers have demonstrated SoftPOS deployments across thousands of merchants, which validates the model and accelerates merchant-side digitization for the Saudi Arabia fintech market.
Interface strategies are converging toward super apps that combine payments, lending, savings, insurance, and lifestyle services inside a single app experience. BNPL leaders have moved to add spending accounts, cards, and budgeting tools, while new digital banks unify telecom-linked accounts and wallets into one interface. Open APIs enable these bundles by letting third parties embed financial features into non-financial apps, which further increases reach and share of customer time. The Saudi Arabia fintech market continues to shift toward mobile consent and granular permission controls, which gives mobile apps a usability edge for PDPL-compliant data sharing.

Geography Analysis
In 2025, the Central Region, anchored by Riyadh, held a significant share of Saudi Arabia's fintech market value. The Western Region, which includes Jeddah and Makkah, accounted for a notable portion. The Eastern Province accounted for a smaller share, with the remaining value distributed across the other regions. Riyadh's significance is supported by the presence of SAMA and the Capital Market Authority, which provide advantages in licensing and regulatory engagement. This centralization facilitates adoption cycles and speeds up product approvals. Venture funding density and a pipeline of late-stage companies further reinforce the lead, as high-profile fundraises and secondaries signal investor confidence in scaling enterprises. The Western Region benefits from tourism-season volumes that validate stress scenarios for payment systems, which then inform broader rollout across the Saudi Arabia fintech market. Seasonality remains a planning consideration in Makkah and Madinah, although product teams leverage the spikes to refine multi-lingual and offline flows for future growth.
The Eastern Province presents a distinct profile where legacy enterprise workflows in energy-related sectors slow the pace of consumer-side adoption. Business models that rely on embedded finance have expanded presence in restaurants, retail, and services, which positions the region to catch up as product-market fit improves. As the Saudi Arabia fintech market matures across provinces, early focus on major cities is giving way to targeted expansion into industrial and commercial clusters. Local bank partnerships and cloud-enabled infrastructure help reduce the setup burden for new deployments outside Riyadh, which supports faster regional scale-up.
Southern and Northern provinces together represent 7% of activity and face higher hurdles, such as cash preference in the informal economy and smaller pools of fintech talent. National rules on data protection and cybersecurity apply uniformly, which ensures user protections but can raise fixed costs for providers expanding into smaller markets. The Personal Data Protection Law’s data-residency requirements favor in-Kingdom hosting and mobile-first consent capture, while uniform payment rails reduce variability in acceptance and settlement times. Providers in the Saudi Arabia fintech market adopt a phased expansion approach into these provinces, focusing on embedded lending, simplified compliance, and agent-assisted onboarding to address local constraints. Over the forecast period, steady infrastructure gains and targeted literacy initiatives are expected to sustain broader adoption beyond core cities.
Competitive Landscape
The Saudi Arabia fintech market remains moderately fragmented with licensed firms across payments, lending, insurtech, wealth, and digital banking, while a smaller set of scale players capture outsized funding and mindshare. Payment acceptance shows elevated concentration, with one provider reporting a 75% share in its core category and sustained processing capacity gains following core system modernization. Alternative lending remains distributed across multiple SAMA-licensed platforms, which have supported experimentation in invoice financing, revenue-based lending, and supply chain finance. Category differences in regulatory friction shape competition in the Saudi Arabian fintech market, with neobanking constrained by license scarcity and embedded finance benefiting from broader partner integrations.
Strategic moves reflect three recurring playbooks in the Saudi Arabian fintech market. First, horizontal integration through acquisitions and product bundling expands the share of wallet and lowers switching in consumer and SME segments. A BNPL leader moved to acquire a SAMA-licensed wallet to broaden into spending accounts and money management, while a regional spend management firm acquired a local corporate card provider to fast-track its Kingdom rollout. Second, embedded finance specialists leverage distribution, bringing lending and expense tools directly into merchant and enterprise workflows at the point of sale and through partner networks. Third, infrastructure providers monetize the digital plumbing of payments orchestration, tokenization, and open banking connectivity to banks and fintechs that prefer to buy rather than build.
Technology deployment is a differentiator in credit decisioning, real-time payment routing, and ledger modernization as providers scale the Saudi Arabia fintech market. Lenders have raised larger warehouse and credit facilities to accelerate originations, while orchestration platforms reported large transaction volumes on Saudi-built systems to serve local clients securely. Experiments in cross-border settlement using multi-CBDC models are active at the central bank level, which may influence future foreign payment flows. Regulatory clarity around BNPL, PDPL, and open banking, along with CMA permitting for investment and crowdfunding categories, has become a core dimension of competitive positioning. Well-capitalized players that meet higher compliance thresholds and can partner with banks have structural advantages as the market moves into a consolidation phase.
Saudi Arabia Fintech Industry Leaders
-
STC Pay
-
HyperPay
-
Geidea
-
Tamara
-
Hala
- *Disclaimer: Major Players sorted in no particular order

Recent Industry Developments
- November 2025: Saudi alternative financing platform erad secured a USD 125 million scalable credit facility led by Jefferies with co-investment from Channel Capital, marking Jefferies’ first major GCC asset-backed SME financing transaction and enabling acceleration of embedded finance solutions across the region.
- September 2025: Saudi fintech unicorn Tamara secured a Shariah-compliant asset-backed financing facility of up to USD 2.4 billion from a consortium including Goldman Sachs, Citi, and Apollo funds, upsizing its previous facility and supporting expansion into credit and payment products.
- September 2025: Saudi Arabia-based fintech HALA raised USD 157 million in a Series B funding round led by TPG’s Rise Fund and Sanabil Investments, one of the largest fintech Series B rounds in the Middle East, to strengthen its market position and expand embedded financial services for MSMEs.
- January 2025: The Saudi Central Bank (SAMA) granted STC Bank full approval to launch its digital banking operations, marking the first licensed digital bank in Saudi Arabia and a significant step in the Kingdom’s financial digital-transformation agenda.


Research Methodology Framework and Report Scope
Market Definitions and Key Coverage
Our study treats the Saudi Arabian fintech market as the annual revenue earned within the Kingdom from technology-enabled financial products, digital payments, lending and financing platforms, investment apps, insurtech solutions, and fully digital banks accessed through mobile, web, or point-of-sale interfaces. The unit of measure is gross revenue in U.S. dollars generated by regulated service providers that hold, move, or intermediate money.
Scope exclusion: cryptocurrency mining, pure technology outsourcing, and in-house bank IT spending are kept outside the sizing.
Segmentation Overview
-
By Service Proposition
- Digital Payments
- Digital Lending and Financing
- Digital Investments
- Insurtech
- Neobanking
-
By End-User
- Retail
- Businesses
-
By User Interface
- Mobile Applications
- Web / Browser
- POS / IoT Devices
Detailed Research Methodology and Data Validation
Primary Research
Conversations with regulators, payment processors, neobanks, Shariah scholars, and SME merchants across Riyadh, Jeddah, and Dammam clarified shadow segments, average take-rates, and likely adoption curves. Quick online polls among retail users validated frequency of use and fee tolerance benchmarks that secondary data could not reveal.
Desk Research
We began by mapping the regulatory and usage landscape through non-paywalled sources such as Saudi Central Bank payment statistics, Vision 2030 progress dashboards, World Bank Findex adoption metrics, IMF Financial Soundness Indicators, and Arab Monetary Fund open-banking updates. Corporate filings, IPO prospectuses, press releases, and respected trade portals supplemented service-specific pricing and user data. Our team also accessed D&B Hoovers and Dow Jones Factiva for company financials and funding flows. These sources, while illustrative, are not exhaustive; many additional references informed supporting estimates and assumptions.
A second sweep captured demand drivers, smartphone penetration from CITC, venture funding tallies from Tenity, and transaction volume insights from SAMA's SARIE and Mada networks. Cross-checking headline figures across multiple years helped us flag anomalies before modeling.
Market-Sizing & Forecasting
A top-down construct starts with transaction values and account balances reported by SAMA and breaks them into service buckets using penetration shares, which are then tempered by average revenue per user evidence from interviews. Bottom-up spot checks, supplier roll-ups and sample ASP × active user math keep totals grounded. Key model inputs include non-cash transaction share, active digital wallets, fintech license count, SME credit gap, and venture inflows. Forecasts employ multivariate regression with smartphone penetration, GDP per capita, and regulatory milestone dummies steering CAGR paths; scenario analysis adjusts for policy or funding shocks.
Data Validation & Update Cycle
Outputs face a three-layer review: analyst peer checks, senior moderation, and variance testing against external benchmarks. Models refresh annually, with off-cycle updates triggered by material regulatory or funding events, ensuring clients always receive the latest view.
Why Mordor's Saudi Arabia Fintech Baseline Commands Reliability
Published figures often diverge because firms select different revenue pools, convert currencies on varying dates, and refresh at uneven cadences. Our disciplined scope setting, yearly update rhythm, and dual-track modeling reduce that spread.
Key gap drivers include whether gross transaction value is mistaken for revenue, if informal P2P apps are counted, and how foreign currency lines are converted. Some publishers also roll regional data into Saudi numbers without clear apportioning.
Benchmark comparison
| Market Size | Anonymized source | Primary gap driver |
|---|---|---|
| USD 2.85 B (2025) | Mordor Intelligence | - |
| USD 1.9 B (2024) | Regional Consultancy A | Counts only regulated wallet fees; ignores lending and insurtech streams |
| USD 39.91 B (2024) | Trade Journal B | Uses gross payment volume and includes telecommunications airtime transfers |
| USD 41.8 M (2023) | Industry Brief C | Focuses on venture funding, not operating revenue |
The comparison shows that once scope and revenue definitions align, our number sits squarely between inflated turnover figures and narrow fee snapshots, giving decision-makers a balanced, traceable starting point.


Key Questions Answered in the Report
What is the current size and expected growth of the Saudi Arabia fintech market?
The Saudi Arabia fintech market size is USD 3.23 billion in 2026 and is forecast to reach USD 6.08 billion by 2031 at a 13.45% CAGR.
Which segment is growing fastest within the Saudi Arabia fintech market?
Neobanking is the fastest-growing segment with a projected 16.31% CAGR through 2031, while digital payments currently lead by share at 48.62%.
How do demographics influence adoption in the Saudi Arabia fintech market?
High smartphone penetration and a young population drive mobile-first usage, which supports wallet adoption, SoftPOS acceptance, and super-app strategies.
What factors shape B2B growth in the Saudi Arabia fintech market?
Embedded finance in SME workflows, POS-linked lending, and supply chain financing are accelerating business services at a 14.02% CAGR.
Which regions lead the Saudi Arabia fintech market and where is growth strongest?
Riyadh leads by value with the Central Region at 45% in 2025, while the Eastern Province is expected to grow at 16.9% through 2031.
What compliance themes matter most in the Saudi Arabia fintech market?
Open banking, PDPL-driven data consent, and cybersecurity standards are the key compliance anchors that guide bank-fintech partnerships and product design.
Page last updated on:


