Market Overview
| Study Period | 2020 - 2031 |
|---|---|
| Forecast Data Period | 2026 - 2031 |
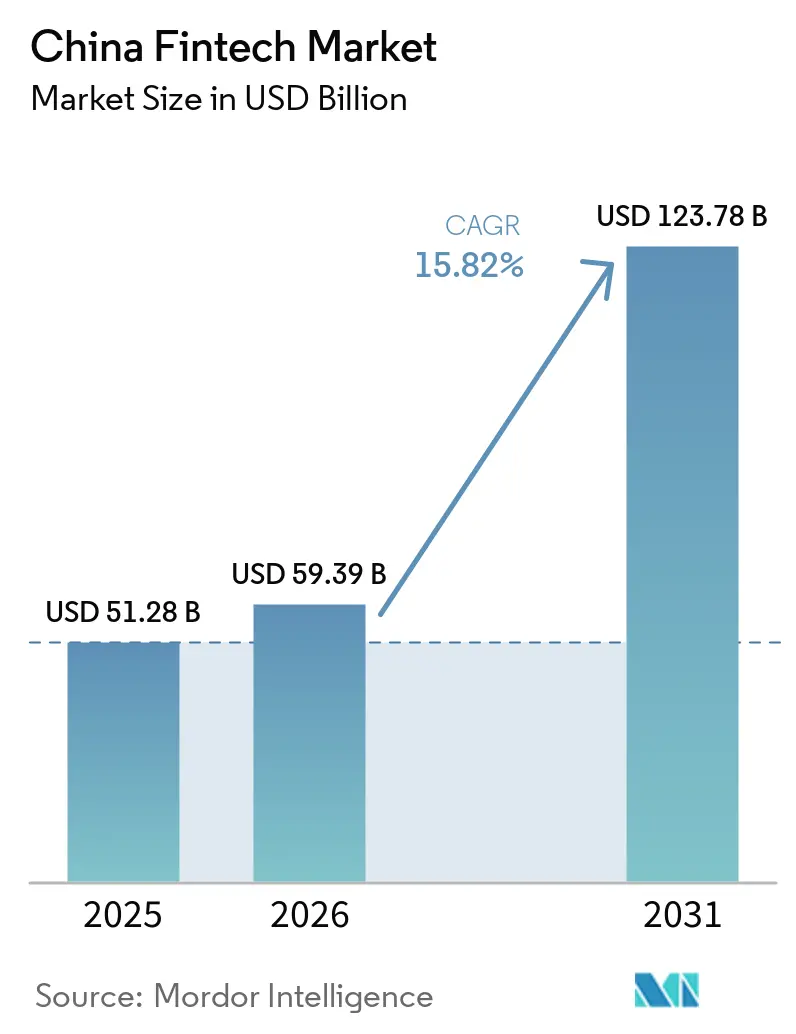
| Base Year Market Size (2025) | USD 51.28 Billion |
| Market Size (2026) | USD 59.39 Billion |
| Market Size (2031) | USD 123.78 Billion |
| Growth Rate (2026 - 2031) | 15.82% CAGR |
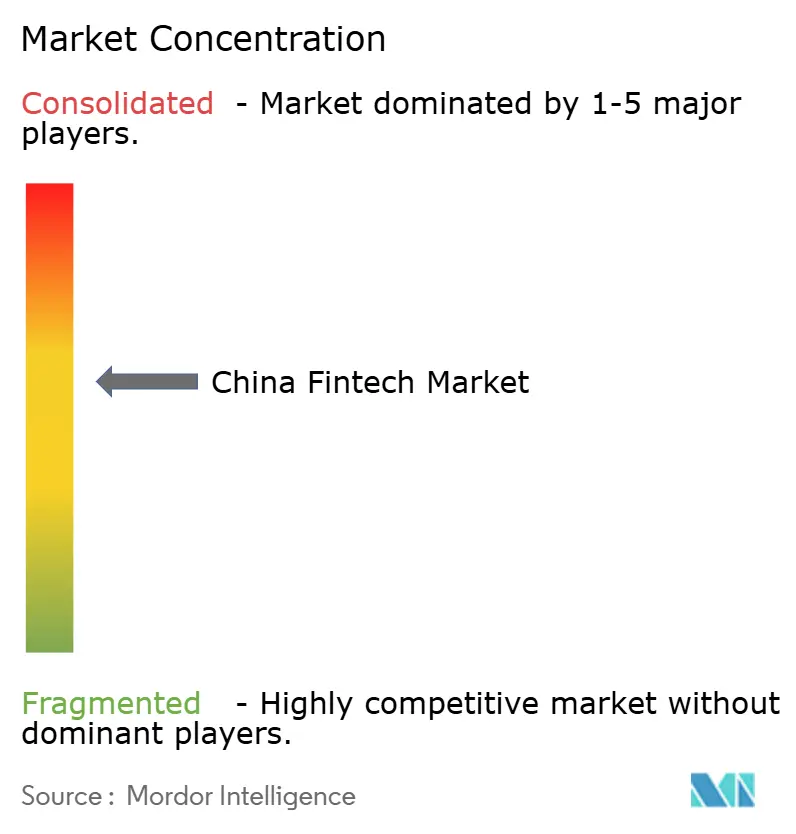
| Market Concentration | Medium |
Major Players *Disclaimer: Major Players sorted in no particular order Image © Mordor Intelligence. Reuse requires attribution under CC BY 4.0. | |
China Fintech Market Analysis by Mordor Intelligence
The China Fintech Market size was valued at USD 51.28 billion in 2025 and is estimated to grow from USD 59.39 billion in 2026 to reach USD 123.78 billion by 2031, at a CAGR of 15.82% during the forecast period (2026-2031).
The growth trajectory reflects an accelerated e-CNY rollout into tier-2 and tier-3 cities, which strengthens digital payment rails while shifting wallets into a deposit-like framework in 2026. Third-party payment volumes continue to scale on the NetsUnion clearing mandate, signalling resilience of core retail payment infrastructure under a centralized model that the central bank supervises. A persistent financing gap for MSMEs anchors demand for data-rich credit models and supply chain finance as banks and digital platforms expand inclusive lending programs with policy support. Heightened cybersecurity and data localization requirements are reshaping operating models in 2026 as financial data flows face stricter compliance under cross-border transfer rules and incident response obligations.
Key Report Takeaways
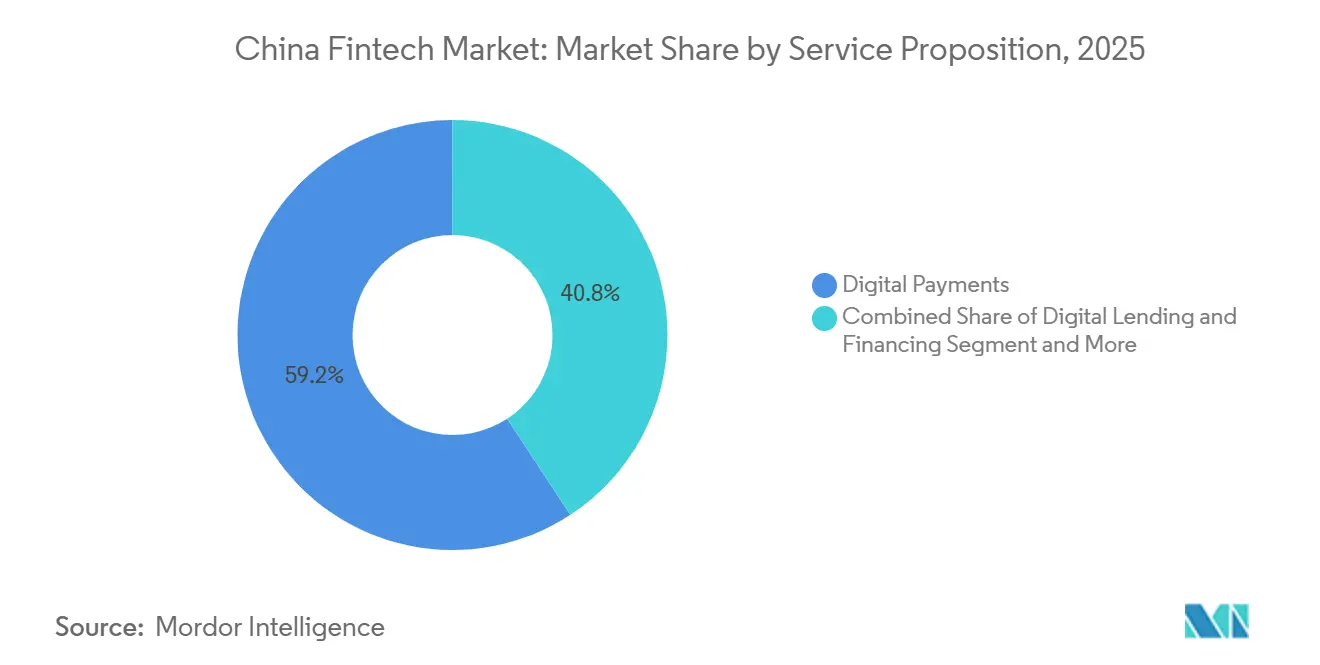
- By service proposition, digital payments led with 59.23% of the China fintech market share in 2025, while neobanking is projected to grow at a 19.58% CAGR through 2031.
- By end-user, retail accounted for 68.37% of the China fintech market share in 2025, with retail also positioned as the fastest-growing end-user segment at a 17.12% CAGR through 2031.
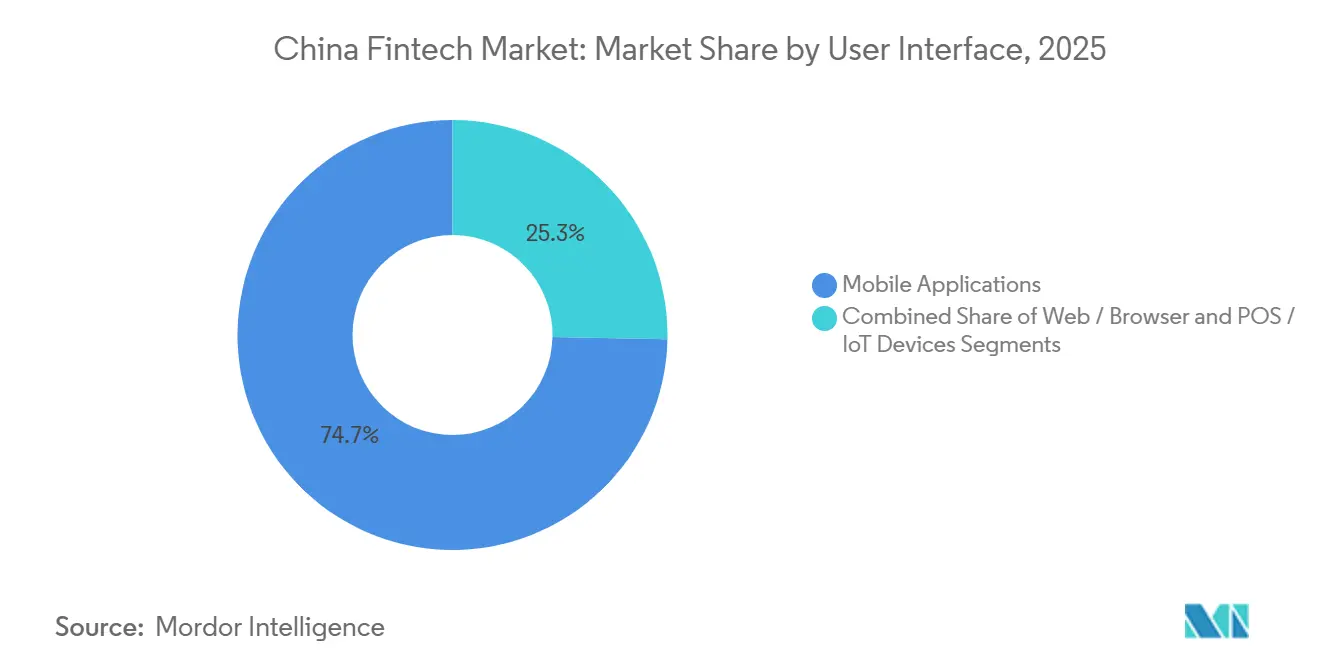
- By user interface, mobile applications represented 74.69% of the usage distribution of the China fintech market share in 2025, while POS and IoT devices are forecasted to advance at an 18.61% CAGR through 2031.
Note: Market size and forecast figures in this report are generated using Mordor Intelligence’s proprietary estimation framework, updated with the latest available data and insights as of January 2026.
China Fintech Market Trends and Insights
Drivers Impact Analysis*
| Driver | (~) % Impact on CAGR Forecast | Geographic Relevance | Impact Timeline |
|---|---|---|---|
| PBOC e-CNY Roll-out Accelerating Digital Payments Adoption Across Tier-2/3 Cities | +2.8% | National, concentrated in tier-2/3 cities, including Guangdong, Zhejiang, Jiangsu, and inland provinces. | Medium term (2-4 years) |
| NetsUnion Clearing Mandate Boosting Third-Party Payment Volumes | +2.5% | National infrastructure benefiting all digital payment platforms | Short term (≤ 2 years) |
| SME Financing Gap Driving P2P & Supply-Chain Fintech Lending Platforms | +3.2% | National, with higher demand in manufacturing hubs (Guangdong, Zhejiang, Jiangsu) and western development zones | Medium term (2-4 years) |
| Wealth Management Connect Schemes Fuelling Robo-advisor Uptake | +1.9% | Greater Bay Area (Guangdong-Hong Kong-Macao), potential expansion to Shanghai, Beijing | Medium term (2-4 years) |
| Commercial Health Insurance Tax Incentives Propelling InsurTech Growth | +2.7% | National, early adoption in coastal provinces and major metropolitan areas | Long term (≥ 4 years) |
| Cloud-native Core Upgrades by Joint-stock Banks Expanding BaaS/API Consumption | +2.1% | National banking infrastructure, led by joint-stock and city commercial banks | Medium term (2-4 years) |
| Source: Mordor Intelligence | |||


PBOC e-CNY Roll-out Accelerating Digital Payments Adoption Across Tier-2/3 Cities
The e-CNY framework shifted to interest-bearing deposit money effective January 1, 2026, folding wallet balances into bank liabilities and reserve calculations, and aligning non-bank payment institutions with 100% reserve requirements, which integrates digital currency into standard banking oversight. By November 2025, cumulative e-CNY transactions reached 3.48 billion, supported by hundreds of millions of personal and corporate wallets, indicating foundational scale before the deposit-bearing pivot takes effect in 2026[1]State Council Information Office, “China to Enhance Digital Yuan Management with Deposit Features Starting 2026,” Xinhua, scio.gov.cn. The adoption challenge remains material because users still favour incumbent third-party platforms that dominate mobile payments, which makes incentives and merchant acceptance mandates decisive for closing the usage gap over the next two to four years. Pilot coverage has expanded from initial sites to dozens of cities, and the architecture is designed for interoperability with commercial bank distribution, which targets underserved regions where mobile payment habits are less entrenched than in tier-1 hubs. The shift supports policy transmission through reserve mechanics and enhances compliance under a model that sits closer to bank deposits than to digital cash, while bolstering the Chinese fintech market with standardized wallet design and merchant acceptance guardrails.
NetsUnion Clearing Mandate Boosting Third-Party Payment Volumes
The centralized clearing regime processes vast transaction volumes at a national scale, which demonstrates the technical capacity required to support continuous use of QR code-based and in-app transactions across retail and services. NetsUnion handled 319.67 billion transactions in Q3 2025, and UnionPay cleared 100.01 billion interbank transactions in the same period, establishing layers of redundancy and throughput in the core payments stack[2]People’s Bank of China, “Payment System Report (Q3 2025),” People’s Bank of China, pbc.gov.cn. Consolidation of clearing reduces fragmentation from the earlier direct-connection model between platforms and hundreds of banks, which improves visibility for the central bank and streamlines risk controls for anti-money-laundering monitoring. These structural gains support merchants and consumers as volumes spike during holiday periods and major shopping festivals, providing a buffer against operational bottlenecks. The scale and consistency of this infrastructure enable new fintech use cases to ride on stable rails while the Chinese fintech market broadens from payments into lending, insurance, and wealth, all of which depend on reliable clearing performance.
SME Financing Gap Driving P2P & Supply-Chain Fintech Lending Platforms
MSMEs face a financing gap sized at USD 1.8 trillion, which is a substantial share of national GDP and keeps demand high for alternative underwriting, embedded finance, and supply chain finance delivered through digital channels[3]World Bank, “China Economic Update (June 2025),” World Bank, worldbank.org. Policymakers supported inclusive lending through dedicated refinancing facilities and guarantee funds, and outstanding inclusive loans to micro and small enterprises reached RMB 36 trillion as of Q3 2025, which raised coverage for underserved firms. Banks expanded credit to small businesses, including the Bank of China, which reported RMB 2.65 trillion of inclusive MSE loans and a deep footprint serving more than a million loan customers with technology finance. Private banks and digital-only banks also reached scale using data-driven risk models and highly efficient core systems, as seen in WeBank’s large customer base and sub-USD 1 per-account annual IT costs. Together, these supply-side shifts continue to shape credit delivery models, and they encourage participation by platforms that can plug into bank ecosystems, while strengthening the China fintech market through persistent demand for digital lending workflows and supply chain finance services.
Wealth Management Connect Schemes Fuelling Robo-advisor Uptake
Cross-boundary fund access in the Greater Bay Area produced steady increases in cumulative flows and individual investor participation after quota adjustments took effect, signalling strong demand for diversified wealth solutions[4]Xiaoqing Wang and Denise Jia, “China Weighs Expanding Wealth Management Connect Beyond Greater Bay Area,” Caixin Global, caixinglobal.com. The growth of Wealth Management Connect heightened the appeal of low-cost advisory models and digital onboarding, which accelerates the adoption of robo-advisors among retail investors in the cross-border corridors. Regulatory coordination between Hong Kong and the Mainland also expanded payment linkages with Payment Connect, allowing real-time retail transactions that complement wealth flows, settlement cycles, and customer experience within the corridor. These policy pilots lower frictions in client acquisition and servicing for banks and fintechs with cross-boundary strategies, aligning retail payment convenience with investment product access. The combined effect supports a faster ramp for digital investment tools in the Greater Bay Area and creates a reference model for broader regional expansion in the Chinese fintech market.
Restraints Impact Analysis*
| Restraint | (~) % Impact on CAGR Forecast | Geographic Relevance | Impact Timeline |
|---|---|---|---|
| Data Security Law Tightening Cross-border Data Transfers for SaaS Fintechs | -1.8% | National compliance, acute for MNCs and platforms with overseas data flows. | Short term (≤ 2 years) |
| Rising NPL Ratio in Micro-lending Elevating Capital-adequacy Burdens | -1.6% | National, concentrated in lending-heavy platforms and consumer finance companies. | Medium term (2-4 years) |
| Saturation of Mobile Payments Limiting Incremental Volume Growth | -1.2% | Tier-1 cities primarily (Beijing, Shanghai, Guangzhou, Shenzhen); less impact in tier-2/3 | Long term (≥ 4 years) |
| Cybersecurity Threats and Data Privacy Concerns | -1.4% | National infrastructure risk, with elevated exposure for large-scale platforms (>50M users) | Medium term (2-4 years) |
| Source: Mordor Intelligence | |||
Data Security Law Tightening Cross-border Data Transfers for SaaS Fintechs
China’s cross-border personal information framework is complete as of January 1, 2026, with certification available for certain volumes, standard contracts for many non-CIIOs, and security assessments required above thresholds, which creates operational checkpoints for international data flows. Sectoral rules for financial institutions require local storage and processing for financial customer information, which anchors data localization as a baseline obligation for banking and insurance entities. Amendments to the Cybersecurity Law raised maximum fines for severe violations and broadened extraterritorial reach, increasing enforcement risk for overseas activities that harm domestic cybersecurity. Incident reporting measures now require fast notification windows for CIIOs and network operators, which increases the governance burden for incident detection, triage, and response. These requirements heighten compliance architecture needs across engineering, legal, and operations teams for firms operating in or with China, and they influence product design and vendor choices throughout the China fintech market.
Rising NPL Ratio in Micro-lending Elevating Capital-adequacy Burdens
Small business loan quality indicators remained manageable through 2024, but outlooks point to gradual pressure as banks expand inclusive lending and as macro conditions play through borrower balance sheets. Inclusive MSE loan growth decelerated from the high growth rates seen in 2021-2023, which reflects thinner risk-adjusted returns as policy lending expands and pricing tightens. Banks disclosed inclusive portfolios and NPL metrics for MSME loans in mid-2025, which helps investors and partners calibrate risk appetite and loss expectations for small-ticket and short-tenor lending. Household leverage and non-mortgage consumer balances are high, which can spill into tighter underwriting and added provisioning in consumer finance channels. These dynamics make capital adequacy planning and credit analytics a priority for platforms with heavy lending exposure in the Chinese fintech market, while banks maintain collateral frameworks and provisioning buffers to absorb cyclical strains.
*Our forecasts treat driver/restraint impacts as directional, not additive. The impact forecasts reflect baseline growth, mix effects, and variable interactions.
Segment Analysis
By Service Proposition: Digital Payments Anchor Market, Neobanking Surges as Fastest Grower
Digital payments held the largest position with a 59.23% share in 2025, reflecting the scale of QR-based and in-app payments integrated into everyday commerce within the Chinese fintech market. Centralized clearing confirms system capacity with 319.67 billion transactions processed by NetsUnion in Q3 2025 and 100.01 billion transactions cleared by UnionPay’s interbank system, which underpins merchant acceptance and user trust. Mobile-first reach across retail categories keeps transaction velocity high, while e-CNY distribution through banks adds a public option that standardizes wallet design and reserves treatment from 2026. The duopoly of private platforms remains central to retail payments, supported by a large online user base and consumer familiarity that reinforces habitual use. These factors keep digital payments positioned as the anchor segment that supports cross-selling into lending, insurance, and wealth across the Chinese fintech market.
Neobanking is projected to post the fastest growth with a 19.58% CAGR through 2031 as digital-only banks use data and cloud-native cores to scale low-cost operations and AI-driven decisioning within the Chinese fintech market. WeBank’s user and MSME footprint demonstrates the model’s operating leverage and its ability to serve long-tail customers at scale, which supports fee and interest income diversification across retail and small business books. The digital lending landscape remains shaped by the earlier P2P wind down, with supply chain finance and licensed consumer finance taking the lead in filling credit gaps alongside inclusive bank lending. Wealth platforms gain from cross-boundary pilots and product standardization that lowers onboarding friction for advisory-led experiences. These dynamics collectively lift the growth outlook for neobanking and digital investments even as digital payments continue to carry the largest revenue base.


By End-User: Retail Dominance Reflects Consumer Fintech Penetration, Business Segment Gains Traction
Retail users commanded a 68.37% share in 2025, supported by the depth of mobile payment adoption across daily consumption and services in the Chinese fintech market. Bank-processed mobile payment transactions reached 60.631 billion in Q3 2025 with a transaction value of 137.53 trillion yuan, which illustrates the density of payment activity feeding broader consumer fintech services. The deposit-bearing evolution of e-CNY reinforces standardized wallet governance for retail users while maintaining interoperability with bank channels and merchant acceptance. For consumers, low transaction fees and embedded financial products deepen platform usage beyond payments into savings, credit, and investment tools that encourage stickiness. This user behaviour entrenches retail as the anchor end-user base while enabling cross-sell and lifetime value growth in the Chinese fintech market.
Business users make up the remainder of the segment mix and are gaining coverage as inclusive finance, supply chain finance, and bank-fintech collaboration expand credit access within the Chinese fintech market. NFRA reported RMB 36 trillion of inclusive loans to micro and small enterprises as of Q3 2025, while the Bank of China and other institutions increased small business lending with defined risk controls. Private banks and digital-only banks such as WeBank scaled MSME services using data-driven underwriting and modular product design, which supports cost-effective origination across regions. Supply chain finance research shows that fintech development amplifies the benefits of supply chain finance on SME financing efficiency, which validates continued investment in digital workflows and risk models. These trends together raise the trajectory for business-focused solutions even as retail remains the dominant end-user group.
By User Interface: Mobile Applications Dominate, POS and IoT Devices Accelerate
Mobile applications represented 74.69% of user interface distribution in 2025, underscored by bank-processed mobile transactions and non-bank online payment volumes that show deep retail adoption across China’s cities. The architecture of QR-based and in-app payments supports rapid checkout and consistent user experience for retail and service categories, which reinforces mobile-first design for new fintech offerings in the Chinese fintech market. The e-CNY wallet app adds a public option with standardized wallet rules and deposit alignment from 2026, further normalizing mobile wallet use and balancing public and private rails. For complex workflows, web and browser interfaces remain relevant to enterprise treasury, institutional trading, and wealth management, yet the centre of gravity continues to sit with mobile. This balance gives product teams flexibility to tune experiences by user type while maintaining a single clearing backbone for payments.
POS and IoT devices are projected to grow the fastest through 2031 at an 18.61% CAGR as merchants invest in contactless terminals and embedded acceptance that ease high-throughput payment environments in the Chinese fintech market. Payment Connect and cross-boundary pilots also encourage merchants serving travellers to support seamless acceptance for inbound users, which can include embedded devices in retail and hospitality. This interface mix expands acceptance beyond smartphone payment flows and positions merchants for multi-rail transaction capture. The net effect is a broader device footprint that complements mobile-centric usage patterns while lifting throughput capacity at the point of sale.
Geography Analysis
The Chinese fintech market operates at a national scale but with distinct regional rhythms, as tier-1 cities show mature digital payment behaviour while tier-2 and tier-3 cities are the focus of accelerated e-CNY pilots and merchant interoperability in 2026. The shift of e-CNY wallets to deposit treatment brings a consistent governance model for all participating regions and paves the way for new government services and public payment use cases. The duopoly in China mobile payments remains influential in tier-1 cities where user penetration is high, while adoption in lower-tier cities is catalysed by merchant QR interoperability and government incentives. Bank clearing volume data confirms system-wide capacity for continued retail activity, leaving room for regional product tailoring rather than infrastructure overhaul. These regional nuances shape go-to-market decisions and partner selection across the Chinese fintech market.
The Greater Bay Area is a focal point for cross-boundary pilots that combine payments and wealth management connectivity with supervised corridors that reduce friction for residents and institutions. Wealth Management Connect cumulative transfers reached 120.9 billion yuan by July 2025, and individual investors more than doubled after quota expansions, which shows persistent demand for diversified financial products across the boundary. Payment Connect linked the Mainland’s IBPS and Hong Kong’s FPS for real-time retail cross-boundary payments, and early participants created templates that other institutions can follow in 2026. Together, these systems create a test bed for embedded financial services that align payments, investments, and identity verification under coordinated rules. The experience gained in the Greater Bay Area informs scalability to other metropolitan clusters and deepens the China fintech market integration of cross-boundary use cases.
Western and inland provinces are targeted for modernization of bank cores and digital channels, and recent project awards confirm increased activity to upgrade general ledgers and core platforms that can support broader product sets. Inclusive lending expansion shows national reach, with banks reporting larger books of small business loans and dedicated technology finance that helps manufacturers and service SMEs access credit. Health insurance demand adds another layer, with policy incentives increasing product attractiveness and raising coverage in metropolitan areas first, then widening to other provinces. These dynamics encourage region-specific product design in lending and insurance while leveraging national rails for payments. As these regional upgrades proceed, the Chinese fintech market gains a more even technology baseline that can support consistent risk management and compliance controls across provinces.
Competitive Landscape
The Chinese fintech market shows moderate concentration in retail payments but broader fragmentation across lending, wealth, and insurance technology as banks, digital-only banks, and technology providers address different use cases. The mobile payments duopoly continues to define consumer checkout behaviour, while bank clearing data confirms parallel growth of interbank infrastructure that underlies overall resilience. Cross-boundary initiatives such as Payment Connect and Wealth Management Connect introduce collaborative models for banks and platforms to scale regionally compliant services. Technology providers are upgrading banks’ cores and digital channels, signalling that modern architectures and APIs are becoming table stakes for growth and compliance. This mix preserves competitive intensity beyond payments while keeping the core transaction rails standardized and supervised in the Chinese fintech market.
Leading firms are investing in AI, cloud, and data governance to drive risk analytics and to scale cross-sell into MSME finance and wealth, aligning technology with regulatory expectations. Tencent highlighted AI plus cloud solutions adopted by thousands of financial customers and supported the rapid migration and full-cloud operations of virtual banks, which demonstrates the readiness of cloud-native stacks for regulated workloads. WeBank’s distributed core and low per-account IT cost show how efficient infrastructure supports large-scale retail and MSME customer service without sacrificing reliability. Bank of China’s inclusive finance expansions and Minsheng’s disclosure of inclusive, supply chain, and sci-tech innovation loan books show banks as active competitors and partners in digital credit ecosystems. Insurance technology players such as ZhongAn reported healthy growth in health ecosystem premiums, underscoring that embedded distribution channels and digital claims can scale in regulated product lines within the China fintech market.
Competitive strategies increasingly prioritize compliant cross-boundary flows, incident response readiness, and data localization, which shape procurement choices and vendor selection in 2026. The hardened regulatory perimeter for cybersecurity, data privacy, and cross-border data transfer drives broader investment in security certifications, user consent management, and contractual frameworks. At the same time, cross-boundary payment connectivity and wealth corridors let firms expand addressable demand in coordinated regulatory environments. Firms with strong compliance operations and scalable digital cores are positioned to grow faster as new pilots expand and as merchants adopt additional acceptance endpoints. These positioning strategies reinforce the multipolar nature of the China fintech market, where incumbents, digital-only banks, and technology specialists compete and partner across a regulated ecosystem.
China Fintech Industry Leaders
Ant Group (Alipay)
Tencent Holdings (Tenpay)
WeBank Co. Ltd.
Lufax Holding Ltd.
JD Technology (JD Digits)
- *Disclaimer: Major Players sorted in no particular order

Recent Industry Developments
- November 2025: Ant Group introduced LingGuang, a multimodal AI assistant capable of processing language, images, and data. It delivers structured outputs, including 3D models, charts, and applications, enhancing user interaction. Key features include fast research, flash app creation, and real-time scene analysis. LingGuang exemplifies Ant Group's advancements in AI, now available on major app platforms, supporting its Artificial General Intelligence goals.
- November 2025: Tencent expanded its mobile payment network through TenPay Global, launching TenPay Global Checkout in November to enable merchants operating inside WeChat mini programs to accept payments from overseas e-wallets and international cards, initially in Singapore and Macau, with plans for Australia, Japan, and New Zealand, onboarding over 40 partners across 10 countries since September 2025.
- October 2025: China Pacific Insurance (CPIC) launched China's first humanoid robot insurance product on October 17, addressing the emerging sector of humanoid robots integrating artificial intelligence, advanced manufacturing, and new materials as a key track in future industries.
- June 2025: Hong Kong Monetary Authority (HKMA) and People's Bank of China (PBoC) launched Payment Connect on June 22, linking Mainland China's Internet Banking Payment System (IBPS) with Hong Kong's Faster Payment System (FPS) to support secure, efficient real-time cross-boundary payment for residents and institutions, with six institutions each from the Mainland and Hong Kong participating at launch.


Research Methodology Framework and Report Scope
Market Definitions and Key Coverage
Mordor Intelligence defines China's fintech market as the annual gross revenue generated by domestic providers of digitally delivered financial services across payments, lending, investment, insurance, and neobanking that rely on internet or mobile-first interfaces and are regulated by the People's Bank of China or other state financial watchdogs.
Scope exclusion: Pure technology outsourcing for overseas financial institutions is kept outside the study.
Segmentation Overview
- By Service Proposition
- Digital Payments
- Digital Lending and Financing
- Digital Investments
- Insurtech
- Neobanking
- By End-User
- Retail
- Businesses
- By User Interface
- Mobile Applications
- Web / Browser
- POS / IoT Devices
Detailed Research Methodology and Data Validation
Primary Research
Mordor analysts held structured discussions with executives at domestic payment firms, digital lenders, regional banks, and policy advisers across Beijing, Shanghai, Shenzhen, and Chengdu. These interviews helped validate pricing spreads, user acquisition costs, and saturation levels that are not disclosed in public data, and they sharpened our assumptions around near-term regulatory pacing.
Desk Research
Our analysts began with authoritative statistical portals such as the People's Bank of China, China Banking and Insurance Regulatory Commission, China Internet Network Information Center, and the World Bank, which outline user bases, payment volumes, and financial inclusion ratios. Trade association white papers from the National Internet Finance Association and working papers from the Bank for International Settlements provided guardrails on regulatory shifts and CBDC pilots. Company filings, IPO prospectuses, and reputable news archives accessed through Dow Jones Factiva and D&B Hoovers enriched firm-level revenue splits and product rollouts. This list is illustrative; many additional open and licensed sources were scrutinized to cross-check figures and narrative signals.
Market-Sizing & Forecasting
The baseline revenue pool is first built top down from central bank payment fee data, outstanding digital credit balances, AUM held on robo platforms, and written premium flows in online insurance, which are then aligned with penetration rate benchmarks drawn from household surveys. Supplier roll-ups and sampled average service fees provide a selective bottom-up check before totals are frozen. Key variables tracked include smartphone penetration, e-CNY pilot coverage, small-business credit demand, AML compliance spend, and average merchant discount rates; each variable is projected with an ARIMA model that feeds our five-year multivariate forecast. Where bottom-up inputs are sparse, gaps are bridged through guided interpolation approved during peer review.
Data Validation & Update Cycle
Outputs run through variance checks against historic CAGR bands, counterpart indices, and preceding editions. Any variance above two standard deviations reopens analyst review, followed by supervisor sign-off. Reports refresh annually, and material policy moves trigger an interim update so clients receive the latest vetted view.
Why Our China Fintech Baseline Commands Reliability
Published numbers diverge because firms choose dissimilar revenue versus transaction metrics, include foreign outsourcing work, or apply unsupported uptake curves.
Benchmark comparison
| Market Size | Anonymized source | Primary gap driver |
|---|---|---|
| USD 51.28 B (2025) | Mordor Intelligence | - |
| USD 76.50 B (2024) | Regional Consultancy A | Bundles cloud outsourcing and overseas remittance hubs that our scope excludes |
| USD 4.59 T (2024) | Trade Journal B | Reports transaction value, not revenue, and assumes uniform 90% adoption without device cost checks |
Taken together, the comparison shows that Mordor's disciplined scope setting, mixed-method modeling, and annual refresh cadence offer investors and planners a stable, decision-ready baseline.


Key Questions Answered in the Report
What is the current size and growth outlook for the Chinese fintech market?
The China fintech market size is USD 59.39 billion in 2026 and is projected to reach USD 123.78 billion by 2031 at a 15.82% CAGR.
Which segments lead growth within the Chinese fintech market?
Digital payments hold the largest share, while neobanking is forecast to grow the fastest through 2031, supported by cloud-native cores and data-led underwriting.
How are regulations shaping data flows and cybersecurity in China's fintech?
Cross-border data certifications, stringent incident reporting, and higher fines under the amended Cybersecurity Law are raising compliance requirements for all participants.
What is driving MSME finance within the Chinese fintech market?
A USD 1.8 trillion MSME financing gap, inclusive loan programs, and supply chain finance workflows are expanding small business credit delivery with policy support.
How important is the Greater Bay Area to China's digital finance expansion?
The GBA anchors cross-boundary pilots, with Wealth Management Connect and Payment Connect easing retail investment and payments, creating scalable models for expansion.
How will e-CNY influence the competitive dynamics in the Chinese fintech market?
The 2026 deposit-bearing framework integrates e-CNY into bank balance sheets, standardizes wallet rules, and strengthens merchant acceptance, while private platforms continue to dominate mobile payments.
Page last updated on:


