Electricity Retailing Market Size and Share
Market Overview
| Study Period | 2021 - 2031 |
|---|---|
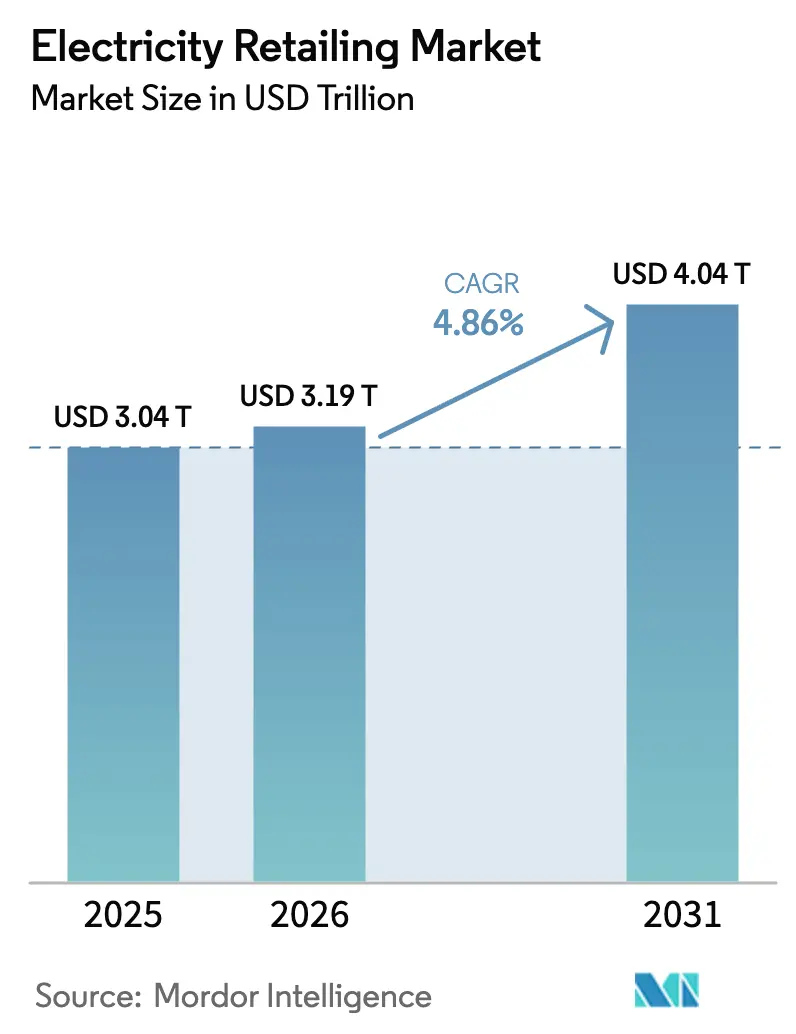
| Market Size (2026) | USD 3.19 Trillion |
| Market Size (2031) | USD 4.04 Trillion |
| Growth Rate (2026 - 2031) | 4.86% CAGR |
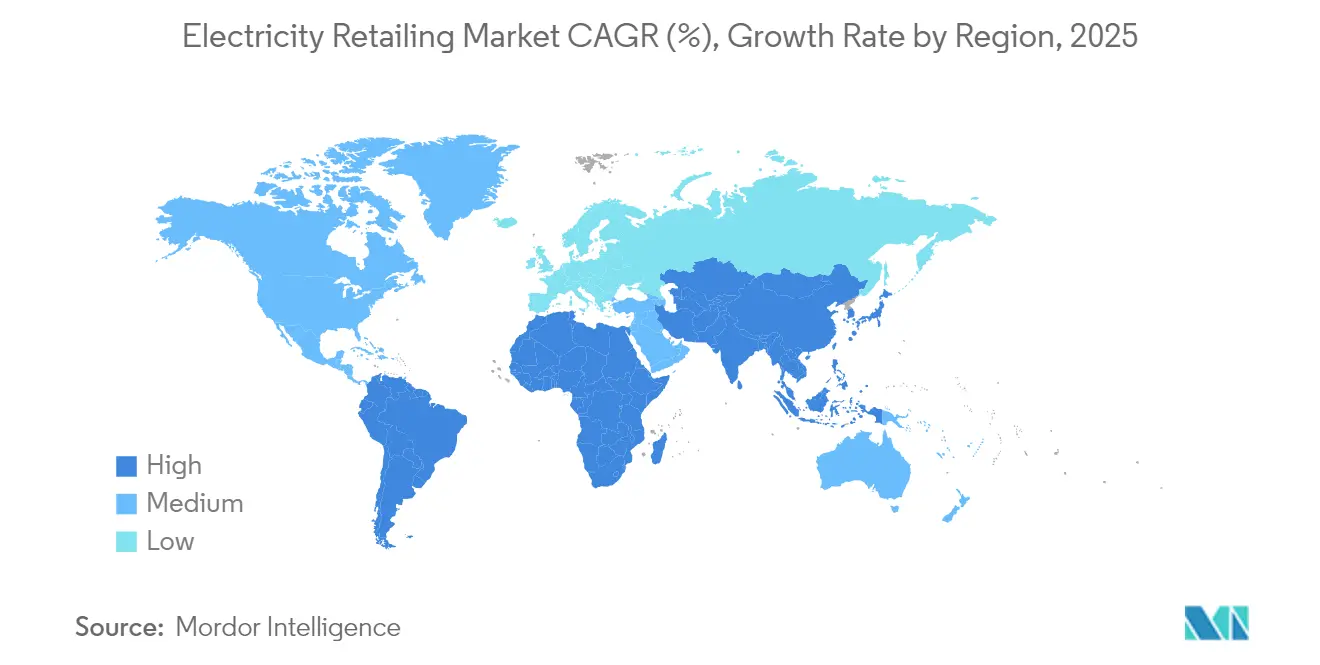
| Fastest Growing Market | Asia Pacific |
| Largest Market | Asia Pacific |
| Market Concentration | Low |
Major Players *Disclaimer: Major Players sorted in no particular order Image © Mordor Intelligence. Reuse requires attribution under CC BY 4.0. | |
Electricity Retailing Market Analysis by Mordor Intelligence
The Electricity Retailing Market size was valued at USD 3.04 trillion in 2025 and estimated to grow from USD 3.19 trillion in 2026 to reach USD 4.04 trillion by 2031, at a CAGR of 4.86% during the forecast period (2026-2031).
The continued electrification of transport, sustained investment in renewable-rich grids, and the accelerating digitalization of customer interfaces are expanding revenue pools for retailers worldwide. The Asia-Pacific region retained its leadership on the supply side, while data-center demand and rapid public-charging rollouts in North America and Europe created unprecedented load growth opportunities. Utilities that deployed advanced metering infrastructure captured granular consumption data, which underpinned new tariff innovations. At the same time, margin volatility intensified as regulators extended default tariffs to shield vulnerable customers and prosumers offset part of their demand through rooftop solar and batteries. Technology-enabled entrants exploited these cross-currents by offering bundled services, reshaping the competitive landscape of the electricity retailing market.
Key Report Takeaways
- By tariff type, fixed/flat-rate tariffs held 44.61% of the electricity retailing market share in 2025, while Green/Renewable-Backed tariffs are forecast to record a 7.38% CAGR through 2031.
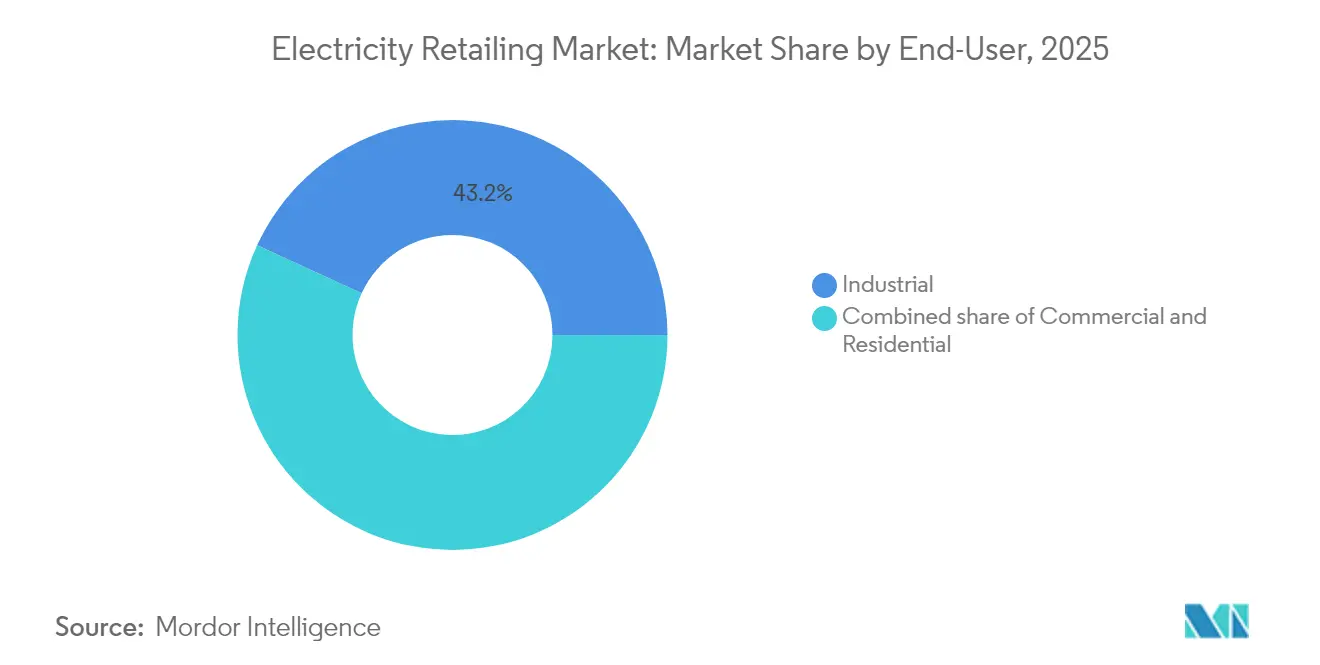
- By end-user industrial segment accounted for 43.15% of the electricity retailing market size in 2025; the commercial segment is projected to advance at a 5.92% CAGR through 2031.
- By geography, the Asia-Pacific region commanded a 46.02% revenue share of the electricity retailing market in 2025 and is poised for a 5.72% CAGR during the forecast period.
- Six legacy suppliers controlled 91% of the United Kingdom’s retail volumes in 2024, reflecting an oligopolistic structure amid 23 licensed competitors.
- Microsoft’s 10.5 GW global renewable PPA with Brookfield was the largest single buyer contract signed to date, underscoring the corporate tilt toward 24/7 clean-energy supply.
Note: Market size and forecast figures in this report are generated using Mordor Intelligence’s proprietary estimation framework, updated with the latest available data and insights as of 2026.
Global Electricity Retailing Market Trends and Insights
Drivers Impact Analysis*
| Driver | (~) % Impact on CAGR Forecast | Geographic Relevance | Impact Timeline |
|---|---|---|---|
| Surging EV-charging load in urban grids | +1.20% | North America, Europe, China | Medium term (2-4 years) |
| Digitally enabled switching & price-comparison portals | +0.80% | Europe, North America, Australia | Short term (≤ 2 years) |
| Universal smart-meter roll-outs | +0.90% | Europe, Australia, Japan | Medium term (2-4 years) |
| Retailer entry into behind-the-meter BESS aggregation | +0.70% | North America, Australia, Germany | Long term (≥ 4 years) |
| Blockchain-based peer-to-peer energy trading pilots | +0.30% | Australia, Europe, select US states | Long term (≥ 4 years) |
| Corporate 24/7 renewable PPAs as retail products | +1.10% | North America, Europe, Global | Medium term (2-4 years) |
| Source: Mordor Intelligence | |||
Surging EV-Charging Load in Urban Grids
Electric vehicle uptake is reshaping urban demand curves, with California expected to have more than 2 million EVs on the road by 2025 and projections indicating 12.5 million units on the road by 2035. North American utilities reported capital expenditures for charging infrastructure in 2024 that nearly doubled the prior-year outlays, underscoring the scale of electrification momentum. Load flexibility programs are enabling data-center operators to curtail usage at peak times to secure interconnection, and pilot virtual power plant (VPP) projects in Texas have demonstrated 40% customer-bill savings when batteries are charged during low-price hours and then discharged during system peaks.(1)Sonnen, “Virtual Power Plant Savings in Texas,” sonnen.comThese initiatives highlight how the electricity retailing market is evolving toward bidirectional, service-rich models.
Digitally Enabled Switching & Price-Comparison Portals
Consumer access to real-time offers expanded rapidly; by 2025, 90% of UK households were aware of time-of-use tariffs, even though fewer than half were inclined to switch. Germany is legislating mandatory dynamic tariffs by 2025, creating space for algorithmic advisers that help end-users align their consumption with renewable output patterns. Retailers that built intuitive, app-based journeys achieved reduced churn while attracting digitally savvy customers, thereby accentuating platform competition across the electricity retailing market.
Universal Smart-Meter Roll-Outs (EU, AUS, JP)
Spain, Sweden, and Finland have already exceeded 95% meter penetration, whereas Germany and the UK are seeking to catch up after experiencing technical and privacy-related delays. Australia is committed to near-universal deployment by 2030, yet customer complaints about estimated billing climbed to 13% in the latest fiscal year. Smart-meter data now feeds demand response, vehicle-to-grid, and granular credit-risk analytics, forming a cornerstone for dynamic products in the electricity retailing market.
Retailer Entry into Behind-the-Meter BESS Aggregation
California increased installed battery storage in the CAISO footprint from 500 MW in 2020 to 11,200 MW by mid-2024, with half of this capacity co-located with solar generation. The Netherlands' TSO, TenneT, projected that up to 12.7 GW of batteries could be connected by 2030, reinforcing the revenue logic for aggregation services. Retailers are rolling out zero-up-front subscription offers that guarantee customers fixed-price energy sourced from on-site solar plus battery dispatch, a differentiator that is redefining customer value capture within the electricity retailing market.
Restraints Impact Analysis*
| Restraint | (~) % Impact on CAGR Forecast | Geographic Relevance | Impact Timeline |
|---|---|---|---|
| Margin squeeze from regulated default tariffs & price caps | -1.80% | Europe, Australia, regulated US markets | Short term (≤ 2 years) |
| Load erosion from prosumer self-consumption | -1.10% | Australia, California, Germany, Spain | Medium term (2-4 years) |
| Credit-risk spike amid rising household energy debt | -0.70% | UK, Europe, select US states | Short term (≤ 2 years) |
| Grid-usage levies on retailers in high-RES markets | -0.90% | Germany, Australia, Denmark | Medium term (2-4 years) |
| Source: Mordor Intelligence | |||
Margin Squeeze from Regulated Default Tariffs & Price Caps
The Australian Default Market Offer for 2025-26 increased residential tariff ceilings by up to 8.9%, reflecting higher wholesale-cost pass-through while restricting retailer margin upside. German household prices averaged EUR 0.4519 per kWh in 2024, with more than half attributable to taxes and levies, thereby compressing the retailer differentiation potential. Similar interventions in South Korea saddled incumbent KEPCO with mounting debt, underscoring how policy objectives can distort the electricity retailing market’s risk-return profile.
Credit-Risk Spike Amid Rising Household Energy Debt
By late 2024, UK arrears exceeded GBP 2.9 billion, prompting suppliers to raise bad-debt provisions and tighten onboarding credit checks.(2)Ofgem, “Energy Debt and Customer Vulnerability Report 2025,” ofgem.gov.uk Continental Europe faced similar stress as Italy’s default-service arrears climbed 27% year-on-year despite government bill-relief schemes. Retailers are rolling out pre-pay options, installment plans, and targeted energy-efficiency advisory services to contain receivables risk. Fintech-style propensity-to-pay analytics, fed by smart meter data, are reducing disconnection events, although privacy concerns persist. Elevated debt costs compress working capital, reducing strategic headroom at a time when the electricity retailing market requires record investment in digital systems and customer acquisition.
*Our forecasts treat driver/restraint impacts as directional, not additive. The impact forecasts reflect baseline growth, mix effects, and variable interactions.
Segment Analysis
By Tariff Type: Green Products Outpace Legacy Plans
Fixed/Flat-Rate plans maintained a 44.61% share in 2025 as households prioritised bill certainty amid price volatility. Green/Renewable-backed offers grew at a 7.38% CAGR, propelled by corporate supply chains seeking low-carbon Scope 2 footprints and consumers aligning their lifestyle choices with climate values. Spanish households on the regulated dynamic tariff saved 8-11% annually when shifting usage to solar-rich afternoon hours. Dynamic/Real-Time pricing, still niche, flourished where smart-meters covered virtually all endpoints, notably in Sweden and Finland. Subscription-style Energy-as-a-Service models, exemplified by ABB’s zero-capex battery bundle, represent the electricity retailing market’s shift from commodity sales to integrated solutions.
The competitive arena increasingly prizes digital engagement and behavioural insights. Retailers investing in AI-driven usage forecasting and gamified mobile dashboards report churn rates that are 40% lower than those of their peers. In deregulated US states, app-based brands have captured millennials by combining renewable offsets with cashback loyalty, reaffirming that customer experience, rather than tariff mechanics, drives differentiation across the electricity retailing industry.


By End-User: Commercial Load Accelerates
Industrial customers represented 43.15% of 2025 volumes; however, hyperscale data center growth propelled the Commercial segment to a 5.92% CAGR outlook, potentially risking local grid-capacity bottlenecks in Virginia, Ohio, and Frankfurt. Retailers supplying these campuses increasingly negotiate capacity-reservation charges and curtailment clauses to manage 24/7 operations. Residential electrification through heat pumps and vehicle charging is steady but constrained by upfront appliance costs.
Commercial buyers also pioneer 24/7 PPAs and behind-the-meter batteries, unlocking ancillary-service revenues that offset retail rates. Simultaneously, industrial process electrification—from steel hydrogen furnaces to semiconductor fabs—could add 120 TWh to the 2030 baseline demand in the Asia-Pacific alone, diluting the Industrial segment’s historical volatility and enhancing the electricity retailing market’s resilience to macroeconomic cycles.
Geography Analysis
Asia-Pacific led with 46.02% share and a 5.72% CAGR outlook, undergirded by Guangdong’s 650 billion kWh provincial exchange and India’s renewable buildout pipeline exceeding 70 GW. Widening wholesale-retail spreads in Japan and South Korea attract fintech-enabled entrants despite tariff-cap uncertainties.
Europe grappled with structurally high taxes and levies that comprised 54% of German household bills in 2024; however, advanced grid digitalization offers a platform for dynamic pricing and demand response. Nordic retailers leverage near-100% smart-meter coverage to market hourly green certificates, illustrating how innovation offsets regulatory drag.
North America experienced unprecedented commercial load requests—Xcel Energy alone reviewed 6.7 GW of data center interconnection proposals—while abundant gas and accelerating renewables cushioned wholesale cost spikes. State-by-state regulation produces a mosaic of risk-return profiles, but healthy liquidity and sophisticated hedging underpin a robust electricity retailing market size for investors.

Competitive Landscape
The electricity retailing market features moderate concentration. Legacy incumbents dominate meter-point counts in Japan, Germany, and parts of the US; yet, digital challengers now capture a growing share of switchers in deregulated zones. Iberdrola has earmarked EUR 41 billion through 2026 for network reinforcement and renewables, while Duke Energy’s USD 83 billion 2025-2029 capital expenditure plan targets grid modernization—moves that defend incumbent scale advantages.
Platform-centric newcomers deploy AI-based tariff selection, micro-PPA aggregation, and real-time carbon tracking. UK data show that six large suppliers still controlled 91% of residential accounts in 2024, but app-only suppliers grew their customer bases by 35% year-on-year, underscoring the latent churn potential. M&A remains selective: Eni Gas e Luce’s purchase of Aldro Energía granted immediate Iberian beachhead access without organic license hurdles.
Technology capabilities now outweigh pure buying power. Sonnen’s Texas VPP monetises FERC Order 2222 market access for aggregated residential batteries, whereas ABB’s BESS-as-a-Service removes capital constraints for SMEs. Coupled with blockchain pilots and peer-to-peer initiatives, these models signal a shift from tariff competition to platform ecosystems, a defining trajectory for the electricity retailing market.
Electricity Retailing Industry Leaders
AGL Energy Ltd.
China Huadian Corporation LTD. (CHD)
Electricite de France SA.
Engie SA
Duke Energy Corporation
- *Disclaimer: Major Players sorted in no particular order

Recent Industry Developments
- June 2025: Duke Energy announced a 22% year-over-year increase in earnings per share (EPS) for the first quarter of 2025, and also revealed an $83 billion capital investment plan for the period of 2025-2029.
- May 2025: ABB recently launched Battery Energy Storage Systems-as-a-Service (BESSaaS), a subscription-based model for commercial clients.
- April 2025: NextEra Energy plans to invest USD 50 billion from 2025 to 2029 to add 25 gigawatts of new renewable energy and battery storage capacity by 2034, primarily within its Florida Power & Light (FPL) subsidiary.
- March 2025: Tata Power Renewable Energy Ltd (TPREL), a subsidiary of Tata Power, has signed a Memorandum of Understanding (MoU) with the Andhra Pradesh government to develop 7 gigawatts (GW) of renewable energy projects with a total investment of INR 49,000 crore (approximately USD 5.9 billion).


Global Electricity Retailing Market Report Scope
Electricity retailing is the final sale of electricity from generation to the end-use consumer. This is the fourth major step in electricity delivery, including generation, transmission, and distribution.
The electricity retailing market is segmented by end-user and geography (North America, Europe, Asia-Pacific, South America, and Middle-East & Africa). By end-user, the market is segmented into residential, commercial, and industrial. The report also covers the market size and forecasts for the electricity retail market across major regions. The market sizing and forecasts have been done for each segment based on revenue (USD).
| Fixed/Flat-Rate |
| Time-of-Use (ToU) |
| Dynamic/Real-Time |
| Green/Renewable-Backed |
| Subscription-Based (EaaS) |
| Residential |
| Commercial |
| Industrial |
| North America | United States |
| Canada | |
| Mexico | |
| Europe | Germany |
| United Kingdom | |
| France | |
| Italy | |
| NORDIC Countries | |
| Russia | |
| Rest of Europe | |
| Asia-Pacific | China |
| India | |
| Japan | |
| South Korea | |
| ASEAN Countries | |
| Rest of Asia-Pacific | |
| South America | Brazil |
| Argentina | |
| Rest of South America | |
| Middle East and Africa | Saudi Arabia |
| United Arab Emirates | |
| South Africa | |
| Egypt | |
| Rest of Middle East and Africa |
| By Tariff Type | Fixed/Flat-Rate | |
| Time-of-Use (ToU) | ||
| Dynamic/Real-Time | ||
| Green/Renewable-Backed | ||
| Subscription-Based (EaaS) | ||
| By End-User | Residential | |
| Commercial | ||
| Industrial | ||
| By Geography | North America | United States |
| Canada | ||
| Mexico | ||
| Europe | Germany | |
| United Kingdom | ||
| France | ||
| Italy | ||
| NORDIC Countries | ||
| Russia | ||
| Rest of Europe | ||
| Asia-Pacific | China | |
| India | ||
| Japan | ||
| South Korea | ||
| ASEAN Countries | ||
| Rest of Asia-Pacific | ||
| South America | Brazil | |
| Argentina | ||
| Rest of South America | ||
| Middle East and Africa | Saudi Arabia | |
| United Arab Emirates | ||
| South Africa | ||
| Egypt | ||
| Rest of Middle East and Africa | ||


Key Questions Answered in the Report
How large is global electricity retail revenue today?
The electricity retailing market size reached USD 3.19 trillion in 2026 and is projected to climb to USD 4.04 trillion by 2031.
Which tariff category grows the fastest toward 2031?
Green/Renewable-Backed plans chart a 7.38% CAGR thanks to corporate sustainability mandates and consumer climate awareness.
Why are commercial loads expanding more quickly than industrial loads?
Hyperscale datacentres and AI compute clusters boost commercial demand, driving a 5.92% CAGR versus slower industrial growth.
What role do smart meters play in retailer strategy?
Near-real-time data enable dynamic pricing, demand response, and credit analytics, underpinning new service models.
How are retailers addressing customer energy debt?
Suppliers are deploying pre-pay options, installments, and data-driven risk scoring to temper rising arrears.
Which region leads market share and growth?
Asia-Pacific holds 46.02% share and a 5.72% CAGR outlook, propelled by large-scale electrification and renewables investment.
Page last updated on:


